Summer is the ideal time to conduct a midyear financial check-up. Waiting until December leaves very little room to adjust strategy and waiting until tax filing season means it is already too late.
Taking a proactive approach now allows you to optimize your tax position, capture available incentives, and ensure your investment strategy directly aligns with your long-term goals.
Here are 5 key tax and financial check-ins to perform today while there is still time to take action.
1. Review Your Tax Withholdings (IRS Form W-4)
If you changed jobs, got married, welcomed a child, or experienced a significant shift in income this year, update your IRS Form W-4 with your employer.
Avoid large tax surprises: Underwithholding results in unexpected bills and potential penalties at year-end.
Stop giving the IRS an interest-free loan: A huge refund means you overpaid throughout the year. The IRS does not pay interest on your money. Redirecting that excess cash flow into high-yield savings or investment strategies allows your money to work for you.
Action item: Use the IRS Tax Withholding Estimator online or review your recent pay stubs to verify that your withholdings match your actual year-to-date income.
2. Maximize Pre-Tax Account Limits (FSAs & HSAs)
Review your current contribution levels and balances for employer-sponsored benefit accounts.
Flexible Spending Accounts (FSAs): Check your remaining balances for healthcare and dependent care FSAs. Because FSA funds operate on a “use-it-or-lose-it” basis (with limited rollover or grace period options), plan out your qualified medical, dental, or dependent care expenses now rather than rushing at year-end.
Health Savings Accounts (HSAs): Unlike FSAs, HSA balances roll over indefinitely. If you participate in a high-deductible health plan, aim to max out your HSA contributions to capture triple-tax benefits: tax-deductible contributions, tax-deferred growth, and tax-free withdrawals for qualified medical expenses.
3. Audit Your 401(k) Pacing and Matching
While IRA contributions can be made until the April tax filing deadline, 401(k) salary deferrals must be completed through payroll by December 31.
Employer Match Optimization: Ensure your contributions are paced evenly across all pay periods to capture your employer’s full match. Maxing out your 401(k) too early in the year can cause you to miss out on employer matching dollars in later paychecks unless your plan includes a “true-up” provision.
Catch-Up Contributions: If you are age 50 or older, review your payroll deductions to ensure you are utilizing catch-up contribution limits across your retirement accounts.
4. Strategize Capital Gains, Losses, and Business Expenses
Midyear provides enough year-to-date data to accurately project your marginal tax bracket.
Tax-Loss Harvesting: If you hold investments in taxable brokerage accounts, evaluate opportunities to offset realized capital gains with capital losses.
Roth Conversions: If your income is lower than usual this year, executing a partial Roth conversion can move funds into a tax-free growth bucket at a lower tax rate.
Business Owners & Side Hustles: Review business income and expenses. Ensure all legitimate deductions are tracked through dedicated business accounts. If operating as an S-Corporation, evaluate your expected annual income to ensure your mix of reasonable salary and distributions remains compliant and tax-efficient.
5. Streamline and Update Your Financial Records
Proactive tax planning relies entirely on clean, real-time financial data.
Maintain Clean Books: Reconcile your business and personal accounts monthly using software like Quicken or QuickBooks to spot errors and monitor cash flow.
Track Property Basis: Keep digital copies of closing documents and receipts for major home upgrades or rental property improvements. You will need these to calculate your cost basis accurately when selling.
Document Retention: Store tax records, receipts, and supporting documents in a secure, organized system. As a general rule, retain records supporting tax returns for at least 3 to 7 years.
Please comment or send an email if you have any questions.
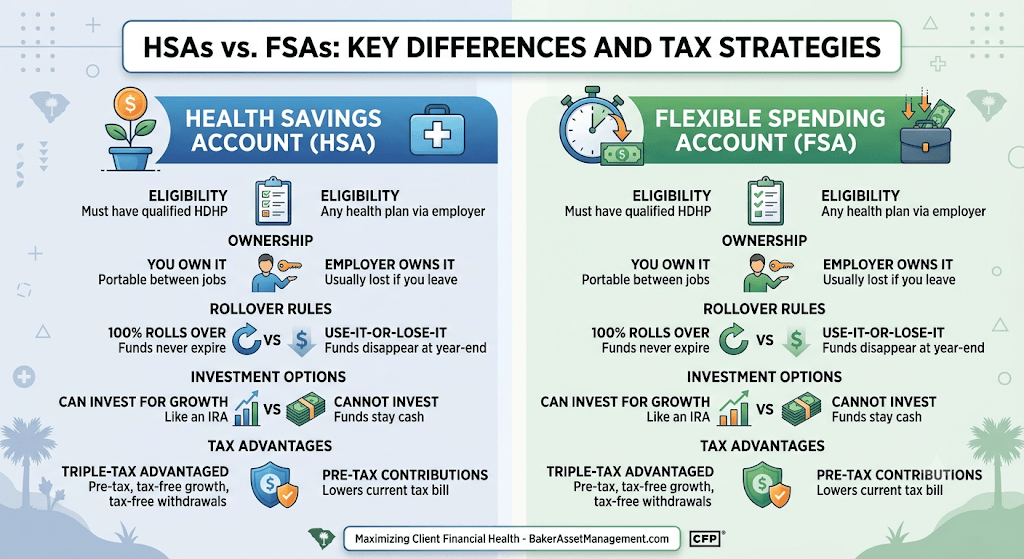
Back in May, I broke down the powerful wealth-building advantages of Health Savings Accounts (HSAs). While that post focused strictly on HSAs, today I want to compare them directly with Flexible Spending Accounts (FSAs). Both accounts allow you to pay for qualified medical expenses using tax-free dollars, but their underlying rules governing ownership, rollover capabilities, and investment growth potential make them vastly different financial tools.
Understanding how to leverage each account—and navigating the updated limits—can significantly lower your annual tax bill while building a dedicated reserve for future medical costs.
HSAs vs. FSAs At-a-Glance
While both accounts deliver immediate tax relief, their structure and long-term utility differ substantially:
Feature
Health Savings Account (HSA)
Flexible Spending Account (FSA)
Health Plan Requirement
Must be enrolled in a qualified High Deductible Health Plan (HDHP).
Available with most employer-sponsored health plans.
2026 Contribution Limit
$4,400 (Self-Only) / $8,750 (Family)
$3,400 per employee
Catch-Up Contribution (Age 55+)
Additional $1,000 annually
Not applicable
Account Ownership & Portability
You own it. Retained if you change jobs or retire.
Employer owns it. Generally lost upon job departure.
Unused Funds Rule
100% Roll-Over. Balances accumulate indefinitely.
Use-It-or-Lose-It. Subject to carryover caps or grace periods.
Investment Options
Funds can be invested in stocks, bonds, and mutual funds.
Cash-only holding account (no investment component).
The Triple-Tax Advantage of the HSA: The Ultimate Stealth Wealth Tool
For taxpayers looking to maximize tax efficiency, an HSA is often superior to traditional retirement accounts due to its unique triple-tax advantage:
Tax-Deductible / Pre-Tax Contributions: Contributions made via payroll deduction reduce your gross income (and bypass FICA taxes) or can be claimed as a deduction on your income tax return.
Tax-Free Growth: Capital gains, dividends, and interest generated inside an HSA grow completely free of federal and state income taxes.
Tax-Free Withdrawals: Distributions used for qualified medical expenses—ranging from doctor copays to dental care and prescription eyewear—are tax-free at any age.
Strategic Retirement Angle: Once you reach age 65, an HSA functions similarly to a Traditional IRA. You can withdraw funds for non-medical expenses subject to standard income tax without penalty. However, if used for medical expenses in retirement, distributions remain 100% tax-free.
Navigating the FSA “Use-It-or-Lose-It” Trap
Flexible Spending Accounts are valuable employer-provided benefits, but they carry strict timeline constraints. If you do not spend your allocated FSA dollars within the plan year, you risk forfeiting those funds back to your employer.
Employers typically choose one of two relief mechanisms allowed by the IRS:
The Carryover Provision: Employers may allow employees to carry over up to $680 of unused 2026 FSA funds into 2027.
The Grace Period Provision: Employers can grant up to 2.5 additional months (typically until March 15th) following the end of the plan year on December 31st to spend remaining funds.
Note: Employers are permitted to offer either the carryover option OR the grace period, but not both.
Actionable Tax Strategies for Individuals and Business Owners
1. The HSA “Shoebox Strategy” (Long-Term Compounding)
If your cash flow permits, pay current out-of-pocket medical expenses using external cash rather than tapping your HSA. Save and digitize every medical receipt. Because the IRS imposes no time limit on when you must reimburse yourself from an HSA, you can let your HSA balance compound tax-free in growth investments for 10 to 20 years, then reimburse yourself tax-free in retirement using your saved receipts.
2. Confirm HDHP Qualification Rules for 2026
To contribute to an HSA in 2026, your health insurance plan must meet specific minimum deductible thresholds:
Family Minimum Deductible: $3,400 (Max Out-of-Pocket: $17,000)
3. Utilize a Limited-Purpose FSA Alongside an HSA
If your employer offers a Limited-Purpose FSA (restricted strictly to vision and dental expenses), you can contribute to both an HSA and an FSA simultaneously. This preserves your full HSA balance for long-term investment while funding predictable vision and dental costs with pre-tax FSA dollars.
4. Maximize Contributions Before the Tax Filing Deadline
You have until the federal tax filing deadline (typically April 15th) of the following year to make prior-year HSA contributions.
The Bottom Line
While an FSA is a practical tool for funding immediate, predictable healthcare costs within a single calendar year, an HSA is a powerful wealth-building instrument that should be integrated directly into your long-term retirement and tax strategy.
Please comment or send an email if you have any questions.
August has no Federal holidays. Markets will remain open standard hours throughout the month.
Stocks spent July navigating the crosscurrents of strong artificial intelligence momentum and a “higher-for-longer” interest rate environment anchored by the Federal Reserve. With structural inflation pressures persisting due to geopolitical conflicts in the Middle East and the ongoing restriction of maritime transit through the Strait of Hormuz, macroeconomic headwinds continue to cap runaway market gains.
For the month of July, the S&P 500 finished down just a bit, -0.09%, falling well short of its historical 30-year June average of +1.40%. Year-to-date, the index is now up 9.38%. Tech sector leaders continue to act as the primary engine for market performance, supported by robust corporate earnings, while broader market participation adjusts to delayed rate cut expectations following Fed Chairman Kevin Warsh’s hawkish stance.
On the corporate front, bottom lines are beginning to absorb the positive liquidity windfall from the tariff refund process for U.S. companies, helping offset higher input costs due to renewed tariffs and the ongoing closing of the Strait of Hormuz. While tech sector valuations reflect enthusiastic market sentiment, today’s AI leaders present a starkly different fundamental profile than past speculative rallies. Rather than relying on debt-fueled projections, today’s mega-cap tech companies are funding massive infrastructure deployments directly out of record free cash flows and fortress balance sheets.
Historically, August typically presents a more challenging environment for equities. Over the past three decades, August has been one of the weakest months for the S&P 500 index, with an average return of -0.01%, essentially flat. This late-summer stretch often features thinner trading volumes and cautious pre-announcements from companies adjusting their full-year guidance. However, if diplomatic efforts yield a definitive resolution to the Middle East conflict and safely reopen global shipping lanes, the market possesses the underlying fundamental strength to easily defy this seasonal slump.
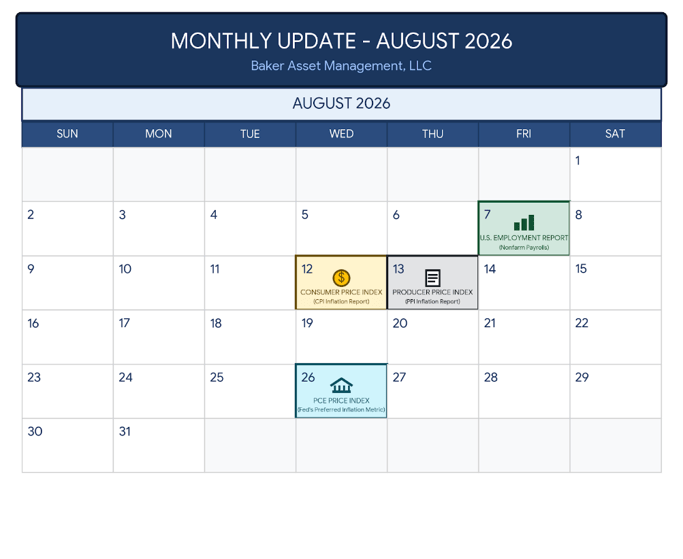
Take a look at the Outlook section below to see what events could move the markets over the short term.
Bond prices continued to reflect the Federal Reserve’s hawkish stance throughout July as fixed-income markets adjusted to persistent cost-push inflation pressures. Safe-haven U.S. Treasuries saw yields push higher as 2026 rate-cut expectations were erased, while corporate credit held steady on the back of strong balance sheets.
10-Year U.S. Treasury Note Yield: Finished July at 4.75% (compared to 4.45% in June).
30-Year U.S. Treasury Bond Yield: Closed July at 5.28% (compared to 4.94% in June).
I continue to track the High-Yield Credit Spread (HYCS), which settled July at 2.87%. After hovering near tight historical lows earlier this summer, this narrow spread signals that credit markets continue to price in a near-frictionless macroeconomic environment. Given active Middle East supply chain bottlenecks and domestic import tariff pressures, pricing in absolute perfection demands extreme prudence. I am maintaining a strict stance against taking unnecessary risks in lower-quality “junk” bonds, as current spreads do not offer sufficient compensation for credit risk.
At the July 28–29 meeting, the Federal Open Market Committee voted to keep the benchmark federal funds rate anchored at 3.50%–3.75%. However, Chairman Kevin Warsh delivered a hawkish tone, emphasizing that elevated shipping and energy overhead must not anchor higher long-term inflation expectations. Notably, three committee members dissented in favor of an immediate rate hike, highlighting a growing willingness within the Fed to tighten further if inflation prints accelerate.
The next FOMC meeting is scheduled for September 15–16, 2026. Investors should expect policymakers to reiterate their restrictive stance. Rate cuts remain off the table for the remainder of 2026, and a defensive rate increase remains a distinct possibility if upcoming CPI and PCE reports show sticky inflation.
Savings rates remained elevated throughout July following the Federal Reserve’s decision to keep the benchmark federal funds rate anchored at 3.50%–3.75%. As highlighted in the updated table below, a significant yield gap continues to divide traditional brick-and-mortar institutions from competitive online platforms. Investors who actively manage their liquid cash can secure returns roughly ten times higher than standard retail account averages. Allocating a few minutes to evaluate your cash placement remains one of the simplest ways to optimize short-term returns.
Account Type
Average Rate (APY)
Highest Rate (APY)
Money Market Account
0.45%
3.90%
High-Yield Savings Account
0.62%
4.15%
1-Year CD
2.01%
4.11%
3-Year CD
1.67%
4.15%
5-Year CD
1.73%
4.20%
Total capital parked on the sidelines in U.S. money market funds remains near historic highs, holding firm in the $7.86 trillion range. This substantial cash balance is unlikely to shift significantly back into equities or longer-duration bonds until short-term yields experience a meaningful Fed rate cut—a scenario Chairman Warsh has effectively ruled out for the rest of 2026. In the meantime, certificates of deposit (CDs) and liquid High-Yield Savings Accounts (HYSAs) serve as ideal vehicles for short-term liquidity and emergency reserves. As a quick safeguard, please verify that your liquid cash deposits remain below the $250,000 per-person limit per institution to ensure full FDIC coverage.
Mortgage rates trended modestly higher throughout July, mirroring the upward pressure on 10-year Treasury yields amid persistent “higher-for-longer” inflation concerns. While elevated borrowing costs continue to keep the refinancing market subdued and present headwinds for prospective buyers, expanding home inventory levels are providing prospective buyers with more options and slightly improved negotiating leverage compared to last year.
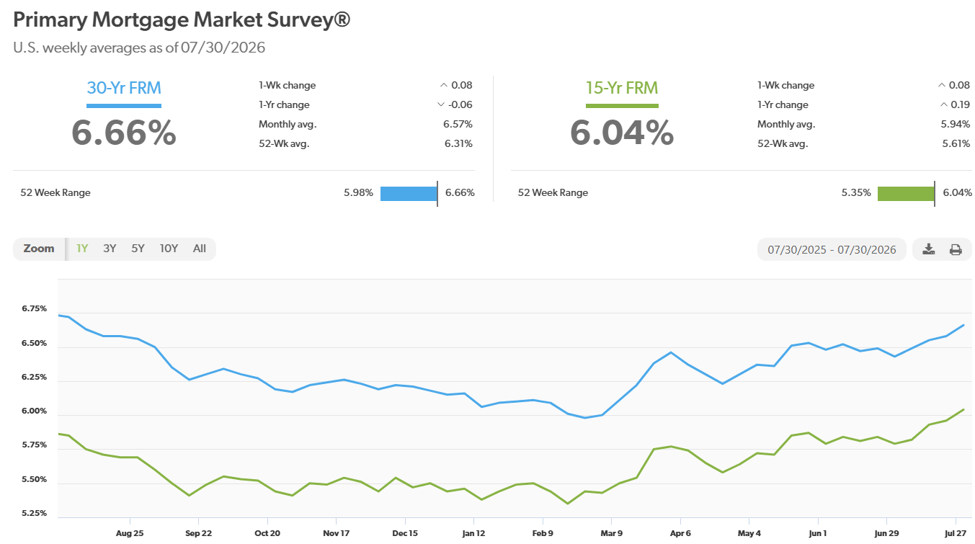
According to Freddie Mac, the 30-year fixed-rate mortgage closed out the final week of July averaging 6.66%, up from the 6.49% average at the end of June. The 15-year fixed-rate mortgage averaged 6.04% over the same period, compared to 5.84% a month ago. Looking into August, residential borrowing costs are projected to fluctuate within the 6.50% to 6.85% range until underlying inflation trends and geopolitical supply bottlenecks show meaningful signs of cooling.
Here is a look at the one-year chart of the 15- and 30-year mortgage rates from Freddie Mac.
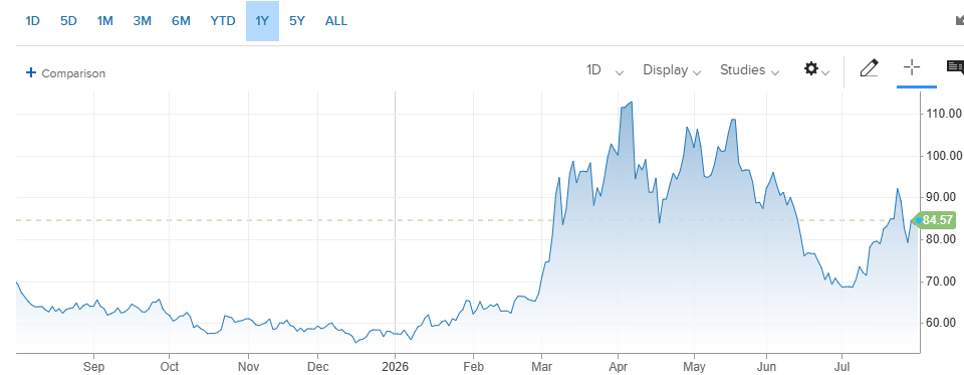
Oil prices continued to be heavily influenced by geopolitical developments in the Middle East and ongoing supply bottlenecks throughout July. With commercial maritime transit through the Strait of Hormuz remaining severely restricted and war-risk insurance premiums elevated, a persistent risk premium remains embedded in every barrel.
WTI Crude Settlement: West Texas Intermediate (WTI) crude settled July at $84.57 per barrel (compared to $70.10 at the end of June).
Year-to-Date Performance: WTI is currently up 23.67% for 2026.
Here’s a look at the one-year chart for U.S. oil:
While short-term technical fluctuations provide temporary volatility, underlying supply constraints continue to feed cost-push inflation across corporate supply chains. Strategic reserves remain low, and until maritime channels safely reopen with guaranteed commercial security, energy overhead will continue to pressure corporate profit margins and complicate the Federal Reserve’s inflation fight.
Retail gasoline prices continued to reflect the broader volatility of crude markets throughout July. While fluctuating international oil benchmarks offered occasional temporary relief at the pump, structural supply pressures stemming from ongoing transit restrictions through the Strait of Hormuz continue to maintain a firm floor under fuel costs. Elevated pump prices remain a direct headwind for consumer budgets and small business logistics overhead heading into the final stretch of the peak summer driving season.
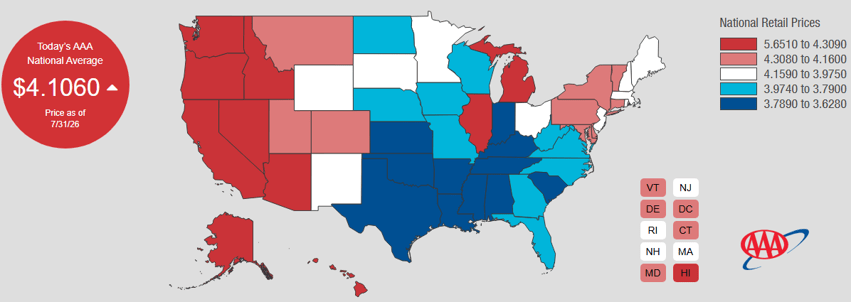
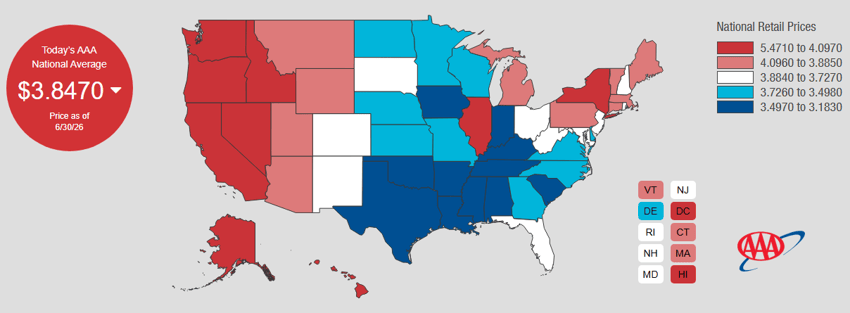
The national average for a gallon of regular unleaded closed out July at $4.11, compared to the $3.85 average seen at the end of June. Indiana currently has the cheapest gasoline in the nation at $3.63 per gallon, while California now has the most expensive at $5.65 per gallon. As a point of comparison, drivers were paying an average of $3.15 per gallon one year ago. Barring a verifiable diplomatic breakthrough to restore secure commercial transit in the Middle East, pump prices are expected to remain range-bound and elevated through late summer.
Check out the prices at the pump in your area: AAA Gas Prices.
Outlook
Events on the horizon that could move the markets in the near term:
Fed, Rates, & Inflation: The Federal Open Market Committee (FOMC) concluded its July meeting on Wednesday by maintaining the target range for the federal funds rate at 3.50% to 3.75%. As a refresher, this is the interest rate range set by the Federal Reserve at which commercial banks borrow and lend their extra money to each other overnight. In its statement, the Fed noted that while economic activity continues to expand at a solid pace, inflation remains elevated relative to its 2% goal, largely driven by energy supply shocks stemming from the conflict in the Middle East. During his press conference, Chairman Kevin Warsh reiterated his firm stance against persistently high inflation. Three FOMC members notably dissented, preferring an immediate rate hike, signaling that a defensive increase later this year remains a distinct possibility if inflation pressures do not subside. In fact, the combination of tariff-driven goods inflation and war-driven energy costs completely eliminates the possibility of 2026 rate cuts. This combo is a headwind for stocks and bonds but can be remedied quickly since they are both self-inflicted.
Trump Administration Policies: Tariffs are back. In July, the administration implemented sweeping new Section 301 global tariffs of 10% to 12.5% on 60 trading partners, targeted 50% duties on specific Canadian goods, and a 25% levy on select Brazilian imports. The newly implemented tariffs, combined with the volatile Strait of Hormuz shipping disruptions create an inflationary quadruple whammy: both the tariffs and the shipping blockades deal a distinct two-pronged blow—one hitting the supply side (raising costs) and one hitting the demand side (slowing down growth). This severely complicates the Federal Open Market Committee’s (FOMC) ability to steer inflation down to its 2% target. Once again, these will increase costs for our importers and ultimately, lighten the wallets of U.S. consumers through higher prices, i.e., inflation. Not good for the economy or the markets.
Iran Conflict: Now stretching into its sixth month, the geopolitical crisis in the Middle East remains a central macro headwind capping equity upside. The core economic bottleneck continues to center on the Strait of Hormuz, where restricted maritime transit affects roughly 20% of global petroleum and vital raw materials. Here is a detailed breakdown:
Logistics & Cost-Push Inflation: Beyond crude oil benchmarks, global shipping routes are absorbing elevated war-risk insurance premiums and costly maritime detours around the Cape of Good Hope. These added transit fees filter directly into intermediate wholesale goods and retail shelf prices, creating persistent cost-push inflation across the real economy.
Monetary Policy Constraints: This geopolitical energy shock directly restricts the Federal Reserve’s flexibility. Because monetary policy cannot physically clear maritime chokepoints, Chairman Warsh and the FOMC are forced to keep interest rates elevated to suppress demand, eliminating near-term rate cuts and maintaining defensive rate hike risks.
The Asymmetric Upside: Despite these persistent drag factors, underlying corporate earnings and AI-driven growth have kept markets resilient. Because this supply constraint is geopolitical rather than structural, a resolution presents a powerful positive trigger. A verified diplomatic breakthrough or safe restoration of commercial shipping lanes would immediately dismantle the geopolitical risk premium, slashing transport and energy overhead while providing a massive tailwind for global equities.
In the near term, expect stock prices to remain largely range-bound with elevated, headline-sensitive volatility as markets continue to balance solid corporate fundamentals against persistent geopolitical drag.
Please comment or send an email if you have any questions.
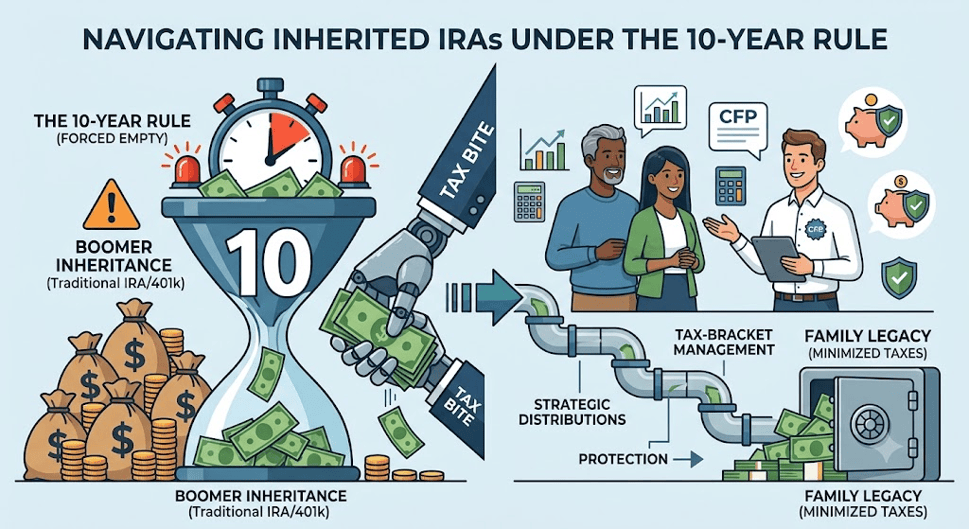
The Great Wealth Transfer is officially underway. Over the next two decades, Baby Boomers are projected to pass down tens of trillions of dollars to Gen X and Millennial heirs. A significant portion of this wealth is sitting inside tax-deferred retirement accounts—specifically Traditional IRAs and 401(k)s.
While receiving an inheritance can be life-changing, inheriting a retirement account comes with a maze of tax laws. Following the SECURE Act and finalized IRS regulations, the rules governing inherited IRAs have fundamentally changed. If you expect to leave or receive an inherited IRA, understanding these rules is critical to avoiding a massive tax bite.
The Death of the “Stretch IRA”
For decades, non-spouse beneficiaries (such as adult children or grandchildren) enjoyed a tax perk known as the Stretch IRA. Heirs could take small, required minimum distributions (RMDs) calculated over their own life expectancies. This allowed the remaining account balance to grow tax-deferred for 30, 40, or even 50 years.
Congress effectively eliminated the Stretch IRA for most non-spouse beneficiaries. Instead, most heirs are now subject to the 10-Year Rule, which requires the entire account balance to be depleted by December 31st of the 10th year following the original owner’s death.
How the 10-Year Rule Works (And the “RMD Catch”)
How you manage an inherited Traditional IRA over that 10-year window depends heavily on whether the original account owner had reached their Required Beginning Date for RMDs (currently age 73) before passing away:
Owner’s Status at Passing
Distribution Requirement for Non-Spouse Beneficiary
Tax Impact
Died BEFORE Age 73
Flexible 10-Year Window: No mandatory annual withdrawals are required in years 1–9. The entire account must simply be emptied by the end of Year 10.
Income tax is owed on withdrawals in the year they are taken.
Died ON or AFTER Age 73
Mandatory Annual RMDs: You must take annual RMDs in years 1–9 based on your life expectancy and fully empty the account by Year 10.
Income tax is owed on each annual distribution.
Inherited Roth IRA
10-Year Draining Rule: Account must be emptied by Year 10, but no annual RMDs are required during years 1–9 regardless of the owner’s age.
100% Tax-Free distributions (assuming the Roth account met the 5-year holding rule).
Note on Exceptions:Surviving spouses, minor children of the account owner, disabled or chronically ill individuals, and beneficiaries not more than 10 years younger than the deceased qualify as “Eligible Designated Beneficiaries” and may still use lifetime distribution rules under specific conditions.
The “Tax Bomb” Risk for Heirs
The biggest trap of the 10-Year Rule is the unexpected tax bump.
Gen Xers and Millennials inheriting IRAs are often in their peak earning years (ages 40 to 60). Adding $50,000 to $100,000+ per year in taxable IRA distributions on top of a high salary can push heirs into significantly higher federal and state tax brackets. Furthermore, waiting until Year 10 to withdraw a lump sum can result in a massive single-year tax liability.
Don’t Forget the State Tax Twist
While federal rules dictate when you must take distributions, state laws determine how much extra cut the government takes. State income taxes vary drastically across the country, making location a critical factor in your withdrawal strategy. For instance, heirs living in Texas pay 0% state income tax on inherited IRA distributions, leaving only federal tax to manage. In contrast, beneficiaries in California face steep top income tax rates (up to 13.3%), which can severely compound the tax hit on forced 10-year withdrawals. States like South Carolina (top rate around 6.2%) and New York fall in between—neither state charges a separate inheritance tax, but both tax traditional IRA distributions as ordinary state income (though both offer specific state tax exemptions for seniors that may apply under certain conditions). If you or your heirs reside in a high-tax state, tax-bracket management becomes doubly important.
Smart Strategies to Minimize the Tax Hit
Stagger Withdrawals Intentionally: Rather than taking nothing for nine years and triggering a massive tax bill in Year 10, spread distributions evenly over the decade to keep yourself within lower tax brackets.
Utilize Low-Income or Gap Years: If you plan to retire, take a sabbatical, or experience a lower-income year during the 10-year window, schedule larger inherited IRA withdrawals during those specific years.
Proactive Planning for Account Owners (Lifetime Roth Conversions): If you are currently planning your estate, consider executing systematic Roth conversions during your lifetime. Paying the tax now at your current tax bracket allows your heirs to inherit tax-free growth and tax-free withdrawals.
The Bottom Line
Inheriting an IRA can provide a significant boost to your long-term financial security, but without a coordinated strategy, income taxes can erode a substantial portion of your family’s legacy.
Whether you are looking to update your current estate plan or have recently inherited an account, consulting with a financial advisor can help ensure you keep as much of that wealth as possible.
Please comment or send an email if you have any questions.
If you created a trust years ago to pass your IRA to children or grandchildren, the ground beneath your estate plan has fundamentally shifted.
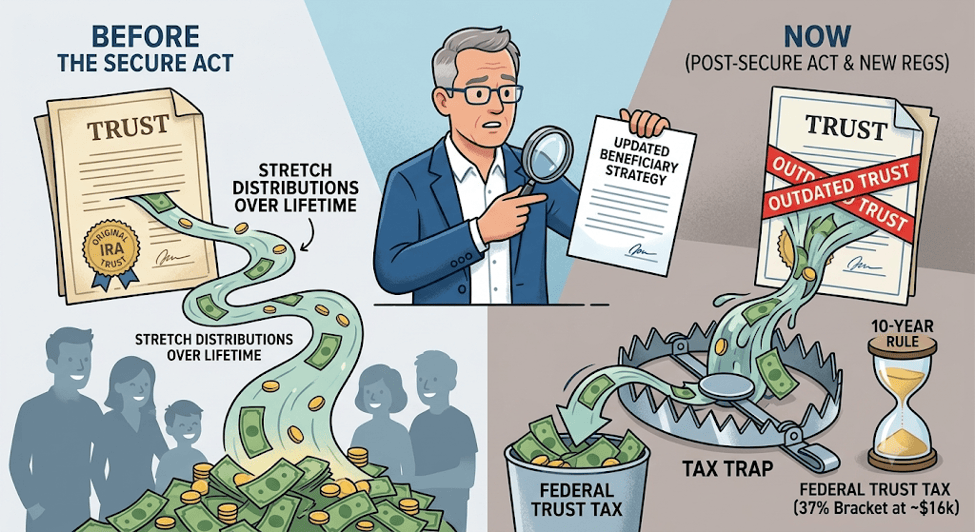
Under older tax law, naming a trust as your IRA beneficiary allowed your heirs to “stretch” distributions—and the tax burden—gradually over their lifetimes. Today, under the post-SECURE Act framework, those rules have been replaced with strict deadlines that could trigger unexpected tax bills if left unchecked.
The Problem: Compressed Trust Tax Brackets
Many older trusts were drafted as “accumulation trusts,” which allow the trustee to hold IRA distributions inside the trust for asset protection. While protection remains valuable, the tax cost has skyrocketed:
Individual Tax Brackets: An individual doesn’t reach the top 37% federal marginal tax bracket until their income exceeds $600,000 (or over $750,000 for married couples filing jointly).
Trust Tax Brackets: A trust hits the top 37% tax bracket at just over $16,000 of retained income.
If your inherited traditional IRA pushes hundreds of thousands of dollars into a trust over a short period, the IRS takes a significantly larger bite than if the funds were distributed directly or managed through an updated structure.
The 10-Year Rule Factor
Most non-spouse beneficiaries must now fully deplete an inherited IRA by December 31 of the 10th year following the owner’s death. Furthermore, if you pass away after reaching your Required Beginning Date (RBD), your beneficiaries are required to take annual distributions in years 1 through 9 before liquidating the balance in year 10.
Without proactive coordination, forcing large distributions into an outdated trust structure can needlessly drain family wealth.
Strategic Solutions to Consider
Review Conduit vs. Accumulation Language: Ensure trust provisions match current legal definitions for “see-through” status while balancing creditor protection against tax drag.
Lifetime Roth Conversions: Converting traditional IRA assets to a Roth IRA during your lifetime allows the account to pass tax-free to heirs. Inherited Roth IRAs are still subject to the 10-year rule, but distributions come out completely tax-free.
Re-evaluate Direct Beneficiary Designations: For mature heirs who do not require legal protection, direct designations may be far more tax efficient.
If you haven’t reviewed your estate plan and beneficiary designations recently, now is the time to align them with current tax law and your overall financial goals.
Please comment or send an email if you have any questions.
If you’ve been keeping an eye on the financial news lately, you’ve probably heard a massive amount of buzz about Trump Accounts (officially known as Section 530A accounts). Authorized under federal legislation, the platform officially went live for funding on July 4, 2026!
If you are looking to build long-term wealth for the next generation, this new vehicle is shaking things up. But like any new government financial program, it comes with a mountain of fine print. Is it a golden opportunity to jumpstart your kid’s financial future, or is it a tax headache waiting to happen?
Let’s break down exactly what Trump Accounts are, how they operate, where you can open one today, and whether they deserve a spot in your family’s financial toolkit.
What is a Trump Account?
Think of a Trump Account as a traditional IRA designed specifically for minors, but with a game-changing twist: your child does not need earned income for contributions to be made. The core goal of the program is to get kids invested in the stock market early to harness the massive power of long-term compounding.
From the day you open the account until December 31st of the year before your child turns 18, the account enters its “growth period.” During this time, the rules are highly specific:
100% Equities: By law, the funds must be invested in low-cost, broad-market U.S. equity index funds or ETFs.
Fee Caps: To protect families, fund expense ratios are legally capped at a razor-thin 0.10%.
No Glide Path: Unlike typical target-date college funds, a Trump Account won’t automatically shift into safer bonds as your child gets closer to adulthood. It rides the stock market wave all the way through childhood.
Contribution Limits & Free Government Money
One of the best perks of a Trump Account is that there are no income limits to open one. Anyone can participate. Here is how the funding breaks down:
Annual Contribution Cap: Total individual and employer contributions are capped at $5,000 per year per child (adjusted for inflation starting in 2028).
Free $1,000 Government Seed: If your child is a U.S. citizen born between January 1, 2025, and December 31, 2028, the U.S. Treasury will drop a one-time $1,000 deposit into their account to kick things off. Note: You must manually claim this via the registration process; it isn’t automatic!
Employer Matches: Employers can chip in up to $2,500 per year to an employee’s child’s account. This counts toward the $5,000 annual limit but is entirely excluded from the employee’s taxable wages.
Charitable Boosts: Eligible children (such as those 10 or younger in qualifying ZIP codes) may also receive private grants, like a $250 deposit from participating philanthropic organizations like the Michael & Susan Dell Foundation.
Quick Tip: Government seed money and qualifying charitable grants do not count against your $5,000 annual individual contribution limit.
What Are the Investment Options & How Do You Buy Them?
Because the law forces a strict “hands-off, low-fee” approach during childhood, you won’t be using these accounts to day-trade tech stocks or crypto.
As of the platform launch, there is currently only one investment option. All cash deposited into a Trump Account is automatically swept into:
SPYM (State Street SPDR Portfolio S&P 500 ETF): Selected by the Treasury because it features one of the absolute lowest-cost S&P 500 tracking fees on the market.
Over the coming months, the Treasury plans to phase in four other broad-market ETFs: Vanguard’s VTI, iShares’ IVV and ITOT, and SPDR’s SPTM. Regardless of which fund is active, the 0.10% fee cap remains legally locked in.
How to Purchase
The purchase process is completely automated. You don’t have to log in and manually click “buy.”
Linked Bank Transfers (ACH): Link your checking account through the app or portal for one-time or automated monthly recurring transfers.
Payroll Deductions: If your employer offers a Trump Account match, the funds flow straight from your paycheck into the account.
The “Gifting” Code: The platform allows you to generate a personalized contribution code. You can text or email this to grandparents, aunts, or uncles, letting them deposit cash directly for birthdays or holidays without you acting as the middleman.
The moment any funds hit the account, the platform instantly and automatically buys shares of the designated index fund at the next available market price.
Taxability & Distributions: The Sticky Part
Here is where you need to pay close attention, because Trump Accounts do not work like a tax-free Roth IRA.
Tax-Deferred Growth: Money grows tax-deferred, meaning you won’t pay annual taxes on capital gains or dividends while it sits in the account.
The Withdrawal Tax: When money is eventually taken out, all earnings and pre-tax contributions (like government seed money and employer matches) are taxed as ordinary income. * Tracking Your Basis: Family contributions are made with after-tax dollars. Because you already paid taxes on that money, it creates a “basis.” Your child won’t be taxed on the return of your original contributions, but they will be taxed on the growth.
What Happens at Age 18?: On January 1 of the calendar year your child turns 18, the account converts into a traditional IRA under their full control. They gain the freedom to change investments as they see fit.
The Penalty Rule: Because it transforms into a traditional IRA, taking money out before age 59½ subjects the taxable portion to ordinary income tax plus a 10% early withdrawal penalty. Fortunately, standard IRA exceptions apply—meaning they can pull money out penalty-free (though still taxed) for higher education, a first-time home down payment, or starting a business.
Where Can You Set One Up Right Now?
Because Trump Accounts are tightly tied to federal infrastructure, you cannot open one directly from scratch on a private brokerage site like Fidelity or Vanguard just yet. The U.S. Treasury acts as the default initial custodian.
To open an account right now, you have three primary paths:
The Official Portal: Head over to TrumpAccounts.gov to register your child and verify eligibility.
The Mobile App: Download the official Trump Accounts mobile app (built in partnership with Robinhood and BNY Mellon) on the Apple App Store or Google Play to handle registration and link your bank.
IRS Form 4547: This is the official “Trump Account Election” form. You can file it electronically through your secure IRS Online Account, e-file it alongside your federal tax return, or submit it digitally via the Trump Accounts portal.
The Private Brokerage Route: Major firms like Fidelity, Vanguard, and Charles Schwab are actively building systems to support these accounts. However, you must use the Treasury portal or Form 4547 to initiate the account and claim the $1,000 government seed money first. Once active, you can request a trustee-to-trustee rollover to your preferred private broker.
Trump Account vs. 529 Plan: Head-to-Head
If you’re wondering whether to prioritize a Trump Account or a traditional 529 plan, remember that they serve entirely different primary purposes:
No earned income required (unlike a custodial Roth IRA).
Locked-in ultra-low fees (0.10% cap).
Tax-free employer matching up to $2,500.
The Cons:
Heavy tax drag later (paying ordinary income tax on decades of stock market growth).
Zero investment flexibility until age 18.
Complete loss of parental control at age 18.
Highly complex record-keeping to track after-tax vs. pre-tax bases over 18 years.
The Verdict: Which should you choose?
If your number one goal is funding college or trade school, the 529 plan remains the undisputed champ due to its completely tax-free withdrawals and permanent parental control.
However, if you have a child born between 2025 and 2028, grabbing that free $1,000 government seed money is a complete no-brainer. Think of them as complementary financial tools: use the 529 to cover school and use the Trump Account to hand your child a massive head start on retirement wealth—especially since savvy financial advisors are already plotting out strategies to convert these into Roth IRAs once your child reaches adulthood!
Please comment or send an email if you have any questions.
July 3rd, Friday – Independence Day observed. Stock market is closed.
Stocks experienced a volatile tug-of-war throughout June as unstoppable AI momentum squared off against a hawkish Federal Reserve. While corporate earnings and massive capital deployments into tech infrastructure continue to provide a solid floor for equities, macroeconomic headwinds kept a tight lid on runaway gains. Investors spent most of the month parsing every headline coming out of the Middle East peace talks and digesting the policy tone from our first FOMC meeting under new Fed Chairman Kevin Warsh.
For the month of June, the S&P 500 finished down 1.10%, a performance that fell short of its historical 30-year June average of +0.70%. Year-to-date, the index is now up 9.50%. This resilience remains highly impressive given the structural inflation pressures the economy is navigating as well as weathering the geopolitical fallout from the war with Iran. Tech leaders continue to drive the train, but we are starting to see minor cracks in broader market participation as the realization sets in that interest rates are going to remain “higher-for-longer” due to persistent inflation, mainly due to tariffs and the ongoing closure of the Strait of Hormuz.
The biggest news of the month was the June FOMC meeting. As expected, Chairman Warsh kept interest rates unchanged, but his post-meeting commentary leaned hawkish. He made it clear that until the geopolitical chaos subsides and supply chains normalize, the Fed’s primary mandate is to suppress the accelerating inflation caused by spiked shipping and energy costs. The market is completely erasing any remaining hopes for a rate cut in 2026, and a defensive rate hike later this year remains a distinct possibility if oil spikes again.
On the policy front, corporate earnings are starting to absorb the positive windfall from the tariff refund process for U.S. companies. Major logistics providers returning passed-through costs to small businesses has added clean liquidity to corporate balance sheets, which helped offset some of the anxiety surrounding the administration’s strict USCIS green card mandate. While the tech sector still feels a bit like 1999 with its rampant FOMO, the underlying corporate revenues are vastly superior today. I am keeping a close eye on historical valuations, but the AI structural thesis remains the core driver of stock market gains for the foreseeable future.
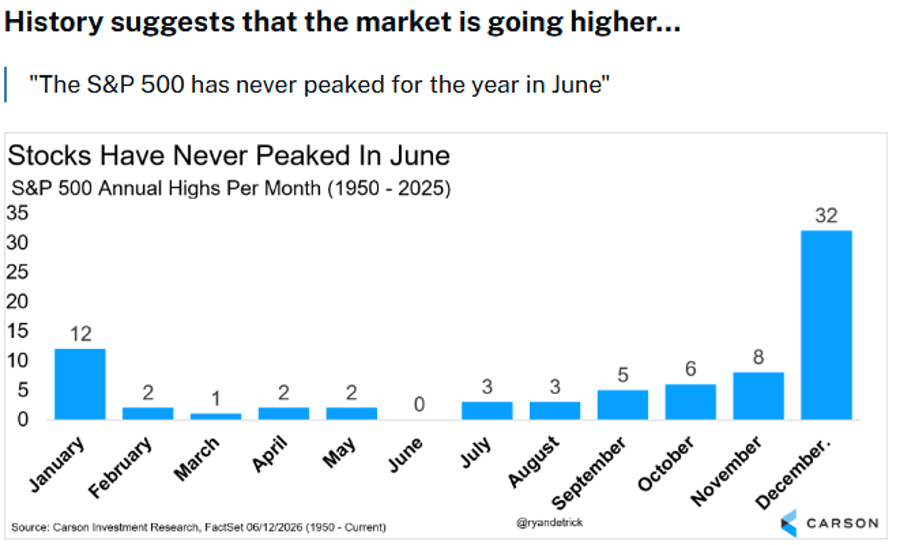
Historically, the performance of the S&P 500 index in July has been one of the strongest seasonal windows of the year. Over the last thirty years, it has delivered an average monthly return of approximately +1.40%. Once again, if we can find a definitive exit from this war and get the shipping lanes safely reopened, stocks should have a fantastic tailwind to beat that historical average. Finally, here’s an interesting historical tidbit that looks promising for more stock gains this year:
Take a look at the Outlook section below to see what events could move the markets over the short term.
Bond prices spent most of June adjusting to the reality of a hawkish Federal Reserve. Following the June FOMC meeting, where new Fed Chairman Kevin Warsh signaled a “higher-for-longer” interest rate environment to combat war-driven inflation, bond yields experienced renewed upward pressure. The divergence between sectors persisted, with safe-haven government bonds feeling the brunt of the Fed’s tone, while corporate credit held relatively steady on the back of stable corporate balance sheets.
The 10-year US Treasury note yield finished the month of June at 4.45%, about the same as the 4.44% yield we tracked at the end of May. Meanwhile, the 30-year Treasury bond yield closed out June at 4.94%, again, about the same as May’s close of 4.97%.
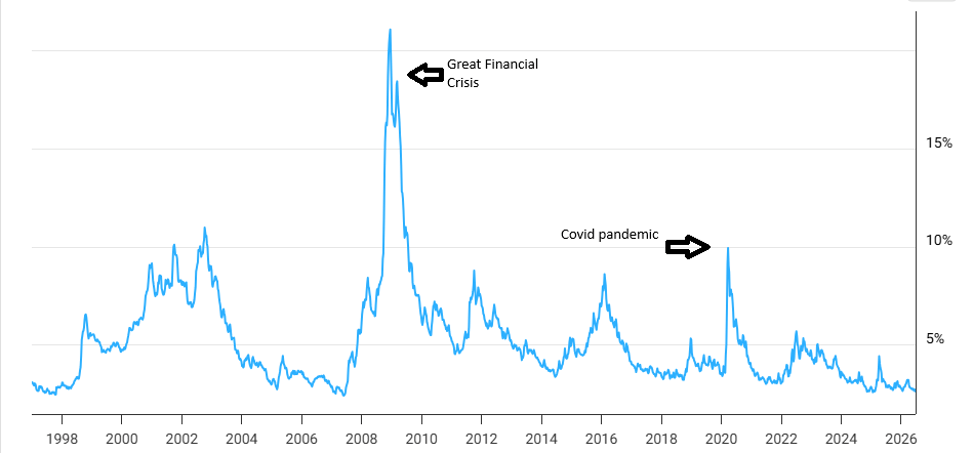
I continue to monitor the high-yield credit spread (HYCS), which finished June at 2.78%. After compressing to an ultra-tight 2.71% in May—a level completely unseen since 2007 right before the Great Financial Crisis—the metric continues to flash a massive warning sign for long-term asset valuations. Although the spread widened slightly this month, the broader message remains unchanged: the credit market is still pricing in near perfection. In a world with an active conflict in the Middle East and structural inflation, pricing in absolute perfection demands extreme caution. I would avoid taking unnecessary risks in the high-yield “junk” bond space right now. For reference, here is HYCS chart since 1997:
With the first FOMC meeting under Chairman Warsh now behind us, the path forward for fixed income is clear. Rate cuts are off the table for the foreseeable future, and short-term yields will remain highly attractive. I continue to favor high-quality bonds and CDs with short-term maturities up to two years. This can lock in yields in the 4% range without being exposed to the heavy price volatility affecting longer-term bonds—provided they are held until maturity.
Savings rates remained highly attractive throughout June, driven entirely by the Federal Reserve’s confirmed stance to hold the federal funds rate steady at 3.50%–3.75%. As you can see from the updated table below, the massive disparity between traditional brick-and-mortar institutions and specialized online platforms persists. Savers who take a few minutes to optimize their cash placement are earning roughly 10 times more yield than those leaving cash in standard retail accounts. Make the time to do the research so you can find the best rates.
Account Type
Average Rate (APY)
Highest Rate (APY)
Money Market Account
0.45%
3.90%
High-Yield Savings Account
0.38%
4.21%
1-Year CD
1.98%
4.11%
3-Year CD
1.66%
4.25%
5-Year CD
1.71%
4.20%
Total assets sitting on the sidelines in U.S. money market funds continue to hover near historic highs, holding strong in the $7.90 trillion range. This massive cash hoard is unlikely to rotate back into equities or longer-duration bonds until short-term yields face down a meaningful Fed cut, which Chairman Warsh has effectively ruled out for the remainder of 2026. For now, CDs and liquid High-Yield Savings Accounts (HYSAs) remain excellent tools for emergency reserves and short-term cash needs. As a reminder, ensure all liquid cash holdings remain under the $250,000 per-person threshold at any single banking institution to remain fully covered by FDIC insurance.
Mortgage rates hovered tightly within the mid-6% range throughout June, tracking the broader stability of the 10-year U.S. Treasury note. While the slight relief from the 7% highs of previous cycles is welcome, the persistent “higher-for-longer” macroeconomic environment continues to suppress the home refinancing market and challenge first-time buyers. A silver lining remains with an expanding inventory of new construction homes, which is gradually giving active buyers slightly more negotiating leverage than they held last year.
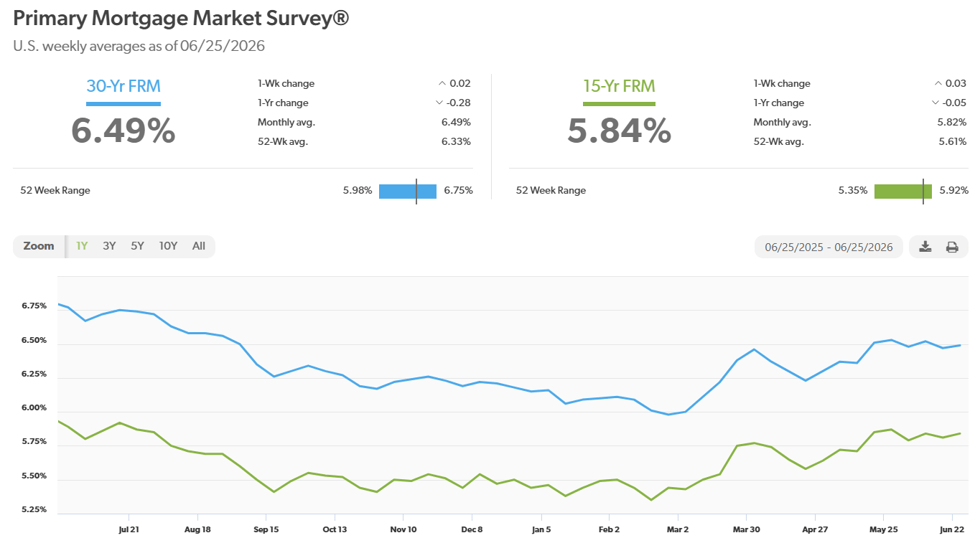
According to Freddie Mac, the 30-year fixed-rate mortgage closed out the final full week of June averaging 6.49%, a minor dip from the 6.53% seen at the end of May. The 15-year fixed-rate mortgage averaged 5.84% over the same period. Looking forward to July, expect residential borrowing costs to remain locked between 6.25% and 6.75% until a structural resolution to the Middle East supply chain crisis begins to cool underlying inflation data.
Here is a look at the one-year chart of the 15- and 30-year mortgage rates from Freddie Mac.
Oil prices continued to be heavily influenced by geopolitical developments in the Middle East throughout June. While the market experienced brief periods of optimism surrounding localized cease-fire discussions, the underlying reality remains a heavily choked supply chain. Global energy infrastructure repairs remain stalled due to active conflict risks, and the fear of ship owners transiting the Strait of Hormuz keeps a heavy risk premium embedded in every barrel.
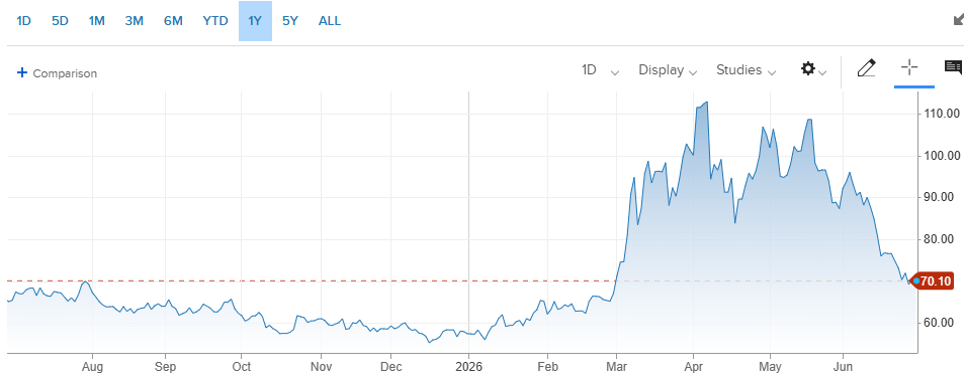
For the month of June, West Texas Intermediate (WTI) crude settled at $70.10 per barrel, down significantly from the $87.36 price at the end of May. For the year, it is still up $13 a barrel, or just over 22%. While global strategic reserves remain low, this near-term technical drop offers breathing room. However, until shipping channels safely reopen and long-term production restarts without fear of military intervention, underlying energy volatility will continue to affect corporate profit margins.
Here’s a look at the one-year chart for U.S. oil:
Drivers found welcome relief at the pump in June as retail gasoline prices experienced a significant drop, mostly due to geopolitical tensions easing in the Middle East. This sharp decline mirrors the recent cooling in international crude costs and provides a much-needed break for consumer wallets and small business logistics overhead. While structural pressures from the ongoing closure of the Strait of Hormuz still linger in the background, this notable pullback provides a great cushion as we enter the peak summer driving season.
The national average for a gallon of regular unleaded closed out June at $3.85, compared to the $4.39 average at May’s conclusion, a welcomed drop. Indiana has the cheapest gas currently, checking in at $3.18 a gallon. Hawaii has the most expensive gasoline at $5.47 per gallon. FYI, a year ago, we were paying $3.19. Barring a swift breakthrough in Middle East international relations to normalize global crude delivery, pump prices are expected to remain elevated throughout the peak summer driving season.
Check out the prices at the pump in your area: AAA Gas Prices.
Outlook
Events on the horizon that could move the markets in the near term:
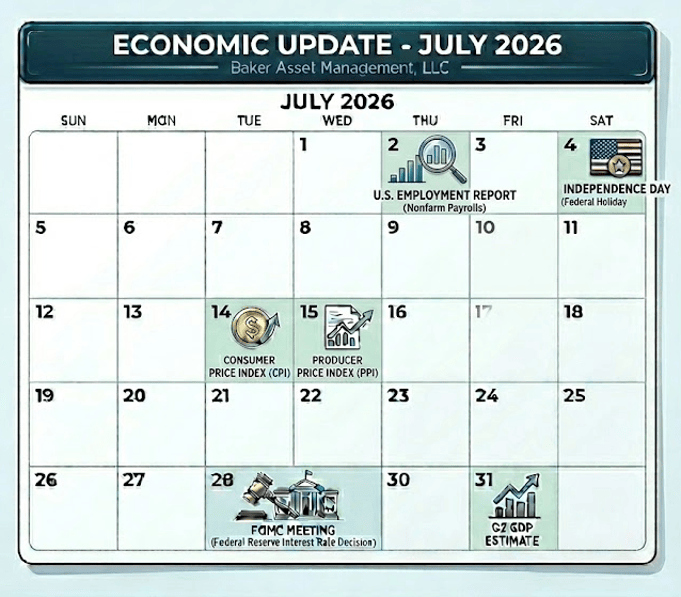
Fed, Rates, & Inflation: The battle between a resilient economy and sticky inflation will take center stage in July. We will get critical snapshots of economic health this Thursday with the U.S. Employment Report and July 30th with the first Q2 GDP estimate. These reports will reveal if corporate America is successfully weathering restrictive monetary policy or if economic growth is beginning to cool.
More importantly, the mid-July CPI and PPI reports will show whether supply chain choke points are continuing to accelerate consumer and raw material costs. With any remaining hopes for a 2026 rate cut completely erased, the market is bracing for a “higher-for-longer” environment. All eyes will be on New Fed Chairman Kevin Warsh during the next FOMC meeting at the end of July. While rates are expected to hold steady, Wall Street will parse every word of his press conference to gauge just how close the committee is to pulling the trigger on a defensive rate hike if inflation prints remain hot.
Trump Administration Policies: On the domestic policy front, we are monitoring two separate issues impacting corporate balance sheets and labor markets. First is the ongoing tariff refund process for roughly 330,000 U.S. companies reclaiming illegal duties. We are starting to see major logistics providers pass these refunds down to small businesses, injecting clean liquidity back onto corporate balance sheets and helping to buffer profit margins against higher energy overhead. Second, the corporate world remains highly anxious over the strict USCIS mandate forcing foreign workers to leave the U.S. to process their green cards. District courts have ruled this mandate illegal but is being appealed by the Trump administration. If the courts ultimately fail to rule this mandate illegal, companies face the threat of sudden and disruptive employment losses. I am watching the ongoing legal challenges closely, as a negative ruling could create structural headwinds for industries reliant on high-skilled foreign talent.
Iran Conflict: The war with Iran is entering its fifth month, and its economic ripple effects continue to act as the primary headwind against runaway stock market gains. The structural deficit created by the ongoing restriction of roughly 20% of the world’s oil supply and other raw materials is keeping a stubborn risk premium embedded in energy and shipping costs, filtering directly down to higher prices for consumers.
Despite the near-term drag, the silver lining remains that this economic damage was self-inflicted and is entirely reversible. The moment we see a definitive breakthrough or peace deal that safely reopens the Strait of Hormuz, global supply chains will normalize, and energy-driven inflation should cool rapidly. Resolving this conflict remains the single greatest potential catalyst to remove the market’s defensive posture and provide a fantastic tailwind for stocks to beat their historical averages.
Please comment or send an email if you have any questions.
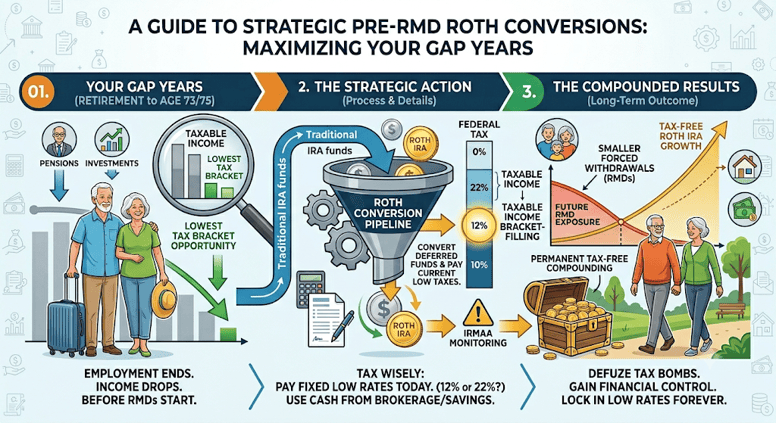
The Bottom Line: Waiting until age 73 or 75 to let the government dictate your retirement withdrawals is a costly tax mistake. By executing strategic Roth IRA conversions during your early retirement “gap years,” you can systematically minimize your Traditional IRA balance, shrink future Required Minimum Distributions (RMDs), and lock in historically low tax rates.
The Hidden Tax Trap of Retirement
Many retirees believe that once they stop working, their tax planning is finished. Unfortunately, a major tax trap awaits in your 70s: Required Minimum Distributions (RMDs). If you have spent decades building a substantial nest egg in a tax-deferred Traditional IRA or 401(k), the IRS will eventually force you to withdraw specific percentages annually, regardless of whether you need the cash. These forced distributions are taxed as ordinary income and can easily push you into a significantly higher marginal tax bracket, trigger higher Medicare premiums (IRMAA), and increase the taxation of your Social Security benefits.
The Window of Opportunity: Your “Gap Years”
The optimal time to defuse this tax bomb is during your “gap years”, the golden window after you retire but before your forced RMDs begin. During this period, your earned income drops off, frequently dropping you into the lowest tax brackets you will see for the rest of your life.
The core strategy is simple: Bracket Filling. You intentionally withdraw money from your Traditional IRA, convert it into a Roth IRA, and pay ordinary income tax on that amount today. The goal is to maximize the amount converted at the lowest current marginal rates (the 10% and 12% brackets, or up to the 22% bracket depending on your wealth targets), ensuring that the converted funds grow tax-free and can be withdrawn completely tax-free later in life.
2026 Federal Income Tax Brackets (Marginal Rates)
To implement this effectively, we must evaluate the current federal tax structure. Below are the key ordinary income brackets for the 2026 tax year:
10% Bracket: Single: $0 to $12,400 | Married Filing Jointly: $0 to $24,800
12% Bracket: Single: $12,401 to $50,400 | Married Filing Jointly: $24,801 to $100,800
22% Bracket: Single: $50,401 to $105,700 | Married Filing Jointly: $100,801 to $211,400
24% Bracket: Single: $105,701 to $201,775 | Married Filing Jointly: $211,401 to $403,550
Here’s a few examples to illustrate this strategy.
Scenario A: The Single Filer
Consider a retired single filer with a guaranteed taxable income of $35,000 from a pension and dividends. This lands them squarely within the 12% bracket ($12,401 to $50,400).
The Opportunity: The top of the 12% bracket is $50,400.
The Calculation: $50,400 − $35,000 = $15,400 of available “headroom.”
The Action: Convert exactly $15,400 from their Traditional IRA to a Roth IRA.
The Result: The entire $15,400 is taxed at a modest 12%. This fund is now insulated from future tax increases, and the Traditional IRA balance is reduced by $15,400, shrinking future RMD exposure.
Scenario B: Married Filing Jointly
Consider a retired couple filing jointly with a combined base taxable income of $70,000 from investments and social security. They are currently in the 12% bracket ($24,801 to $100,800).
The Opportunity: The top of the 12% bracket is $100,800.
The Calculation: $100,800 − $70,000 = $30,800 of available headroom.
The Action: Convert exactly $30,800 from their Traditional IRA to their Roth IRA.
The Result: They lock in a 12% federal tax rate on $30,800. If they waited until RMDs kicked in alongside Social Security, their forced distributions could easily push their taxable income past $100,800, forcing those same dollars to be taxed at 22% or higher.
Critical Guardrails
While the numbers are highly compelling, Roth conversions require precise execution. To ensure compliance and optimize the financial impact, keep these rules in mind:
Pay Taxes from Cash, Not the IRA: To maximize the mathematics of a conversion, the income tax generated by the conversion should be paid using cash from non-retirement checking or brokerage accounts. Using IRA assets to pay the tax reduces the compounding power of your tax-free bucket.
Watch the IRMAA Thresholds: Roth conversions increase your Adjusted Gross Income (AGI). If your AGI crosses specific thresholds, it can trigger Medicare Part B and Part D premium surcharges (IRMAA) two years later. Always analyze this boundary before converting assets.
The 5-Year Rule: Converted earnings and principal must remain in the Roth IRA for at least five years (or until you reach age 59½) to be withdrawn tax-free. Because this strategy targets pre-RMD retirees, the time horizon aligns perfectly, but meticulous record-keeping is vital.
Summary & Next Steps
Roth conversions are not a one-time event; they are a multi-year, proactive tactical strategy. By intentionally paying tax at a known, lower rate today, you seize control of your lifetime tax liability and build a flexible, tax-free financial legacy. Every individual situation requires custom financial projection modeling to guarantee that a conversion does not inadvertently push you into an unfavorable tax cliff.
Please comment or send an email if you have any questions.
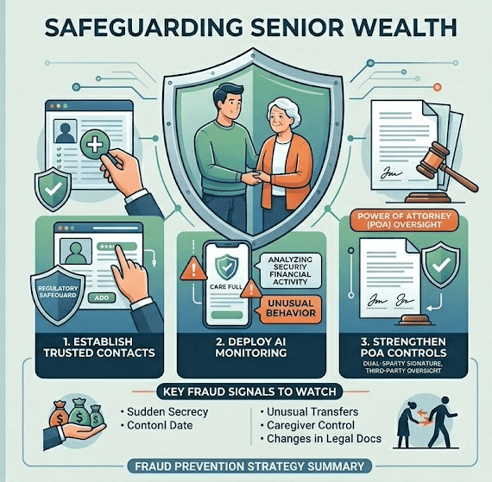
The scale of modern elder financial exploitation is staggering. According to the FBI’s latest tracking, older Americans lose over $7.7 billion annually to fraudsters, with individual victims losing an average of $120,000. While sophisticated digital and artificial intelligence (AI) voice-cloning scams are rapidly escalating, data reveals that roughly 70% of financial abuse is actually committed by individuals known to the senior, such as predatory caregivers or dishonest family acquaintances.
As a fiduciary, I assess risk objectively. Protecting your family’s generational wealth means moving beyond reactive concern and implementing proactive, data-informed safeguards.
Step-by-Step Defense Protocol
Implementing structural guardrails across your family’s accounts creates an immediate barrier against bad actors. Follow this order of operations to establish maximum protection:
1.Establish Trusted Contacts: Immediate Priority.
Contact major financial custodians—such as Fidelity or Charles Schwab—to formally add a “Trusted Contact” to your family member’s accounts. Under FINRA Rule 2165, this provides institutions with a compliant regulatory framework to halt suspicious transactions and contact you directly without violating privacy laws.
Do not rely on standard bank alerts, which often miss specialized elder fraud patterns. Integrate a dedicated safety platform like Carefull. This AI-driven service links existing bank accounts to continuously analyze transactional data, flagging unusual cash-draining habits, missed bills, or home title changes.
Seniors with multiple accounts scattered across different institutions face significantly higher exposure. Consolidate these assets into a single primary custodian. This vastly simplifies oversight, limits data exposure, and allows you to establish unified security alerts.
4.Restructure Power of Attorney (POA) Controls: Legal Guardrails.
Review existing estate planning documents. A standard POA can inadvertently act as a license to steal if left unmonitored. Ensure your family’s legal documents include accountability provisions, such as requiring dual signatures or independent third-party CPA oversight for large asset liquidations.
Identifying the Behavioral Red Flags
Preventing loss requires recognizing changes in behavior before assets leave an account. Watch closely for these primary indicators:
Financial Anomalies: Uncharacteristic out-of-state wire requests, sudden ATM withdrawals by a companion, or sudden attempts to purchase untraditional retail assets like gift cards or cryptocurrency.
Social Isolation: A new “friend” or caregiver who insists on managing the senior’s schedule, acts as an intermediary during financial conversations, or encourages secrecy regarding financial decisions.
The Bottom Line: Fraudsters rely entirely on isolation and administrative complexity. By centralizing accounts at major custodians, adding verified trusted contacts, and utilizing automated tools like Carefull, you build a structural defense system that protects your family’s long-term financial health. Take the time to review these accounts with your loved ones and put these administrative blockades in place.
Please comment or send an email if you have any questions.
Just ran some numbers on historical initial public offerings (IPOs) to provide a data-driven perspective on what the future might hold for highly anticipated market debuts like SpaceX, OpenAI, and Anthropic. While the media buzz surrounding mega-tech listings often generates massive retail excitement, the historical data over the last 25 years tells a much more cautious story for the 12 months following a company’s public debut.
Data-Driven Insights: The 12-Month Post-IPO Track Record
When evaluating historical IPO performance over the past two and a half decades, the data consistently refutes the myth of guaranteed first-year gains. Financial studies reveal several critical trends regarding how companies perform in the 365 days after hitting the public markets:
The “First-Day Pop” vs. Long-Term Reality: Historically, IPOs are known for significant first-day underpricing, giving early institutional investors an average initial “pop” of roughly 15% (Lowry et al., 2017). However, for everyday investors buying shares on the open market after day one, the subsequent 12 months frequently see a reversal of fortune.
Systemic Underperformance: Extensive long-run historical data indicates that, on average, IPOs tend to underperform broad market benchmarks—such as the S&P 500 or industry-specific indices—during their first one to three years (Ang et al., 2006).
The Size and Age Factors: Performance varies wildly based on a company’s maturity at the time of the listing. Smaller, younger startups exhibit severe average underperformance, with cumulative average abnormal returns dropping significantly in the first year (Siev & Qadan, 2022). Conversely, large, heavily capitalized, and older firms tend to manage the transition to public markets with far less volatility, though they still frequently lag behind established market peers in the short term (Siev & Qadan, 2022).
The “Star Performer” Statistical Outliers: The broader average of IPO performance is heavily weighed down by a high failure rate. Statistically, the vast majority of IPOs underperform, while the overall asset class is propped up by a tiny minority (roughly 2%) of “star performers” that achieve monumental returns (Ang et al., 2006).
What This Means for upcoming IPOs such as SpaceX, OpenAI, and Anthropic:
Applying this decision-making framework to the dominant tech private giants of today yields specific strategic takeaways:
Risk & Valuation Variable
Strategic Application to Upcoming Mega-Tech IPOs
Institutional Maturity
Unlike the speculative tech listings of the 1999–2000 dot-com bubble, firms like SpaceX, OpenAI, and Anthropic will enter the public markets as massive, heavily capitalized enterprises with massive global footprints. According to historical trends, their large size and operational age should structurally protect them from the extreme 40%+ drop-offs seen in smaller, speculative IPOs (Siev & Qadan, 2022).
The Hype Premium
Because these brands carry unprecedented cultural and technological visibility, their IPOs will likely face intense public demand. This historically leads to severe initial underpricing (to benefit institutional insiders) followed by a retail-driven valuation peak on day one, which frequently leads to a cooling-off period and negative market-adjusted returns over the subsequent 12 months.
The “Long Shot” Bet
Investors backing OpenAI or Anthropic are implicitly betting that these firms will become the absolute “star outliers” of the decade (Ang et al., 2006). While the historical probability of any random IPO becoming a permanent market leader is low, companies with profound structural moats stand the best statistical chance of breaking the traditional 12-month underperformance trend.
The historical data over the last 25 years sends a clear warning to investors: buying into the immediate 12-month aftermath of a high-profile tech IPO is statistically a losing proposition compared to holding a broad-market index. While mega-cap innovators like SpaceX or OpenAI possess the scale to avoid the catastrophic first-year collapses of smaller startups, history dictates that the safest, most optimized administrative path for retail capital is often patience—waiting for the initial regulatory, insider lockup, and hype cycles to clear before establishing a long-term position.
Please comment or send an email if you have any questions.
Joe Baker, CFP®
Baker Asset Management, LLC
joebaker@bakerassetmanagement.com
References
Ang, A., Gu, L., & Hochberg, Y. V. (2006). Is IPO underperformance a peso problem? National Bureau of Economic Research. https://doi.org/10.3386/w12203
Cited by: 81
Lowry, M., Michaely, R., & Volkova, E. (2017). Initial Public Offerings: A synthesis of the literature and directions for future research. Foundations and Trends® in Finance, 11(3-4), 154-320. https://doi.org/10.1561/0500000050
Cited by: 334
Siev, S., & Qadan, M. (2022). Call me when you grow up: Firms’ age, size, and IPO performance across sectors. Journal of Risk and Financial Management, 15(12), 586. https://doi.org/10.3390/jrfm15120586