Monthly Update – November 2026

Calendar Notes

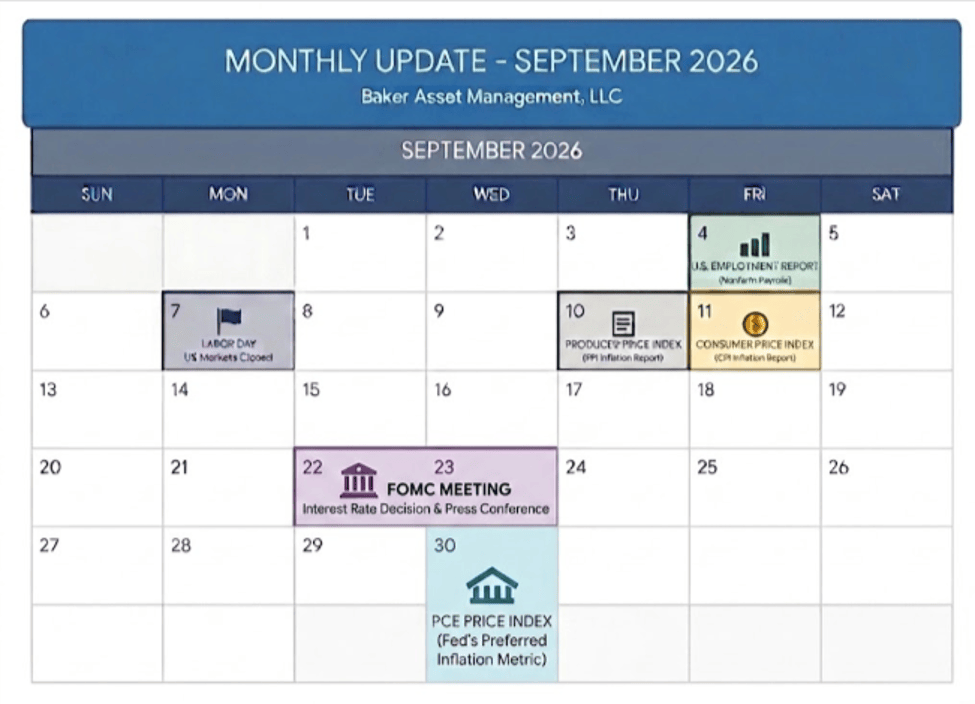
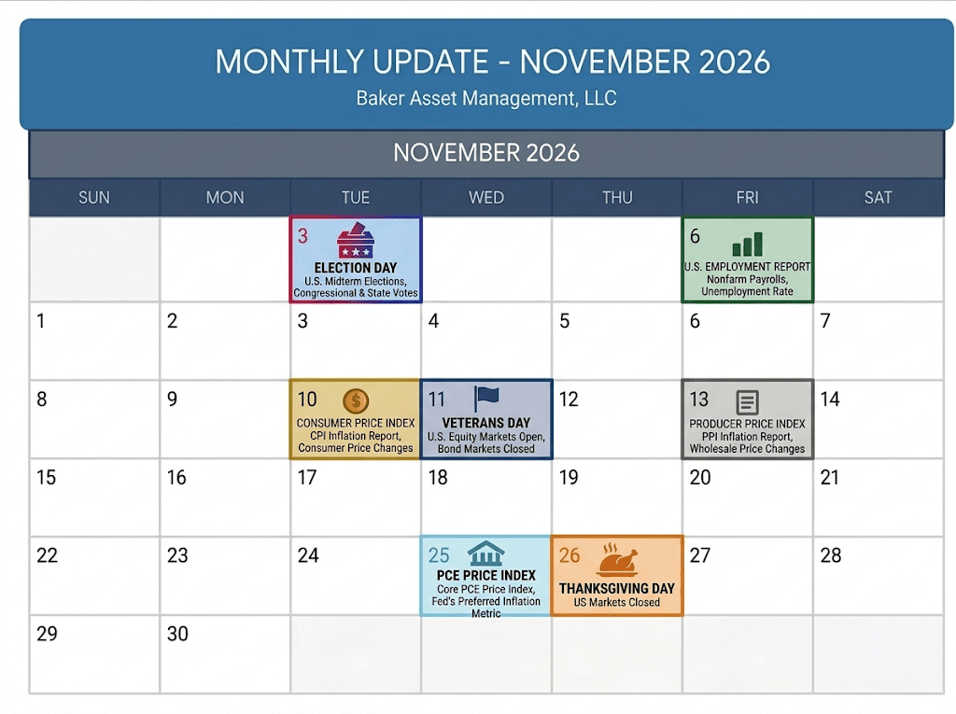
  • Tuesday, November 3: Election Day (U.S. Midterm Elections, Congressional & State Votes)
  • Thursday, November 26: Thanksgiving Day (U.S. Markets Closed)
  • Friday, November 27: Day After Thanksgiving (Black Friday) Markets close at 1pm ET.

Market Overview: Stocks

Stocks were looking to finish positive for the month of October but uncertainty took over and slammed the S&P 500 down in October’s final week to end the month in the red. Rising inflation, a costly war, more tariffs, AI build out spending, and the upcoming elections were too much to overcome for the index this past month. The biggest drag on stocks recently has been the ongoing Iran war, which continues to hurt the U.S. and world economies. This geopolitical conflict is persistently raising prices across the globe for nearly everything that transits the Strait of Hormuz and anything that relies heavily on fossil fuels to move those products.

For the month of October, the S&P 500 finished down 0.93%, below its historical 30-year average of about 2%. Year-to-date, the index is up 10.04%, still on track for a fourth straight year of double-digit gains.

Third-quarter earnings have been a mixed bag. Energy and health care have outperformed but uncertainty in the AI trade is growing and has sparked a selloff. The central debate is how AI infrastructure spending is being funded and whether it is paying off. Many investors are opting to sell now and ask questions later.

Near-Term Outlook: Over the last 30 years, November has been the best performing month out of the year for the S&P 500 index, averaging about 2.60%. Also, this November opens with the Nov. 3rd midterm elections. It just so happens that the S&P 500 was higher 12 months after Election Day in every midterm cycle since 1990, including all seven since 1998. So, it looks like investors have history on their side in the near term. Past performance aside, expect sensitivity to oil prices, inflation data, remaining earnings guidance, AI-spending scrutiny, and election results to steer stock prices in November.

Take a look at the Outlook section below for more details on what events could move the markets over the short term.

Fixed Income Markets

Bond markets spent October digesting the FOMC’s hawkish pause and persistent inflationary pressures stemming from the Middle East. With energy and shipping costs acting as a headwind, Treasury yields remained elevated as investors absorbed the reality that interest rates will likely remain higher through the end of the year.

  • 10-Year U.S. Treasury Note Yield: Finished October at 4.93% (compared to 5.23% in September).
  • 30-Year U.S. Treasury Bond Yield: Closed October at 5.31% (compared to 5.63% in September).
  • High-Yield Credit Spread (HYCS): Finished October at 3.14% (compared to 3.02% in September).

While credit markets continue to price in minimal systemic distress, the recent widening of the High-Yield Credit Spread—which measures the premium investors demand to hold junk bonds over “risk-free” Treasuries—signals expanding risk premiums as markets absorb sticky inflation, elevated fuel costs, and hawkish Fed policy. As this spread widens, it generally puts downward pressure on bond prices (as higher yields are required to attract buyers) and can act as a headwind for stock valuations, signaling cautious investor sentiment and higher borrowing costs for corporations.

FOMC Update

Following the Federal Open Market Committee meeting last week, the committee decided to hold the target range for the federal funds rate steady at 3.75% to 4.00%. The central bank noted that economic activity and consumer spending remain robust, and job gains have kept pace with the workforce. However, inflation remains stubbornly elevated due to geopolitical developments, energy costs, tariffs, and AI industry demand. Given these conditions, the trajectory for interest rates through the end of the year leans firmly toward “higher for longer,” with the Fed leaving the door open for a potential hike if price pressures do not subside.

Fixed Income Strategy

Given elevated short-term interest rates, investors should maintain a disciplined focus on short-duration assets. Consider allocating maturing capital toward high-grade, short-term Treasuries and FDIC-insured bank CDs with maturities under three years, securing yields in the 4.35% to 4.95% range while shielding portfolios from duration-driven price volatility. Recommend holding until maturity to ensure full return of principal.

Tax Efficiency Note: Short-term U.S. Treasuries carry a distinct structural advantage over traditional bank CDs and money market accounts. Interest earned on U.S. Treasury securities is completely exempt from state and local income taxes across all states, delivering a superior net after-tax yield for clients in tax-paying states compared to standard bank products.

Savings Rates

Following recent Fed actions, yields on short-term liquid reserves remain highly attractive. A substantial yield gap still persists between traditional brick-and-mortar institutions and competitive online banking platforms.

Account TypeAverage Rate (APY)Highest Rate (APY)
Money Market Account0.63%5.00%
High-Yield Savings Account1.62%5.00%
1-Year CD1.76%4.60%
3-Year CD1.39%4.85%
5-Year CD1.41%5.09%

Total assets in U.S. money market funds continue to remain high. Please ensure total deposits at any single banking institution stay within the $250,000 per-person threshold for full FDIC protection.

Mortgage & Housing Market

Mortgage rates trended upward once again in October as bond markets reacted to rising inflation and persistent long-term yield pressures.

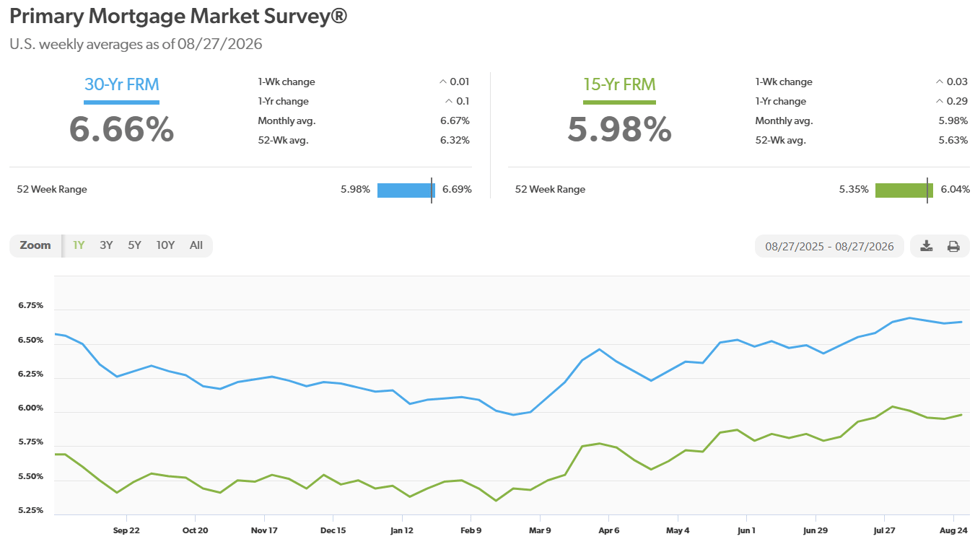
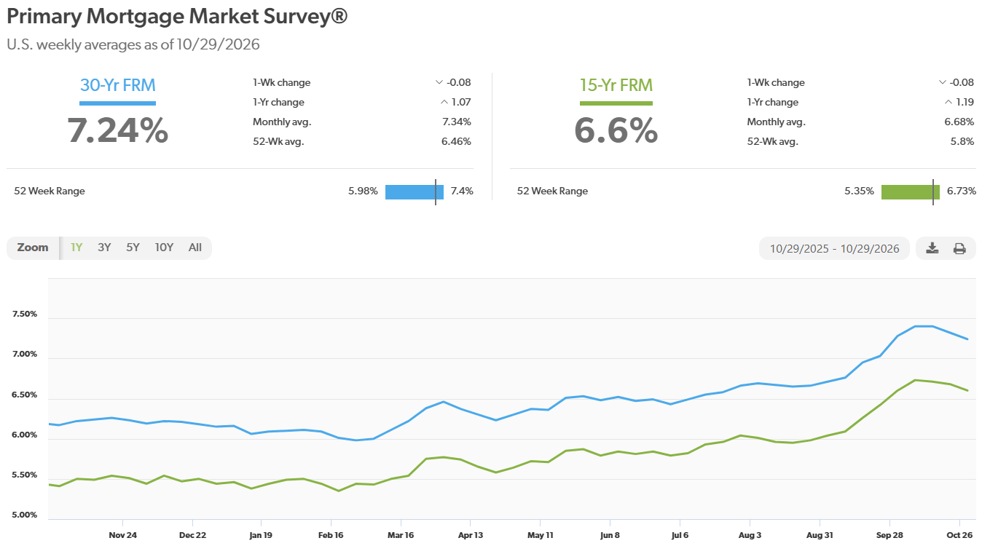
According to Freddie Mac, the 30-year fixed-rate mortgage averaged 7.24% in late October, up from 7.03% recorded at the end of September. The 15-year fixed-rate mortgage averaged 6.60%, up from 6.42% last month. Moving into November, residential borrowing rates are anticipated to fluctuate within this elevated mid-to-upper 6% or 7% range, with actual mortgage pricing sensitive to the Federal Reserve’s “higher for longer” stance. Structural affordability challenges continue to constrain overall transaction volume, and meaningful improvement in rates for the remainder of the year would require a substantial cooling in inflation and a decline in longer-term Treasury yields.

Here is a look at the one-year chart of the 15- and 30-year mortgage rates from Freddie Mac.
Energy Markets

Crude oil benchmarks experienced continued pressure in October as the ongoing Iran war persists. The conflict has severely restricted commercial shipping through the Strait of Hormuz, driving up war-risk transit surcharges. These constraints raise prices across the globe for nearly everything that transits this vital chokepoint and utilizes fossil fuels for transport.

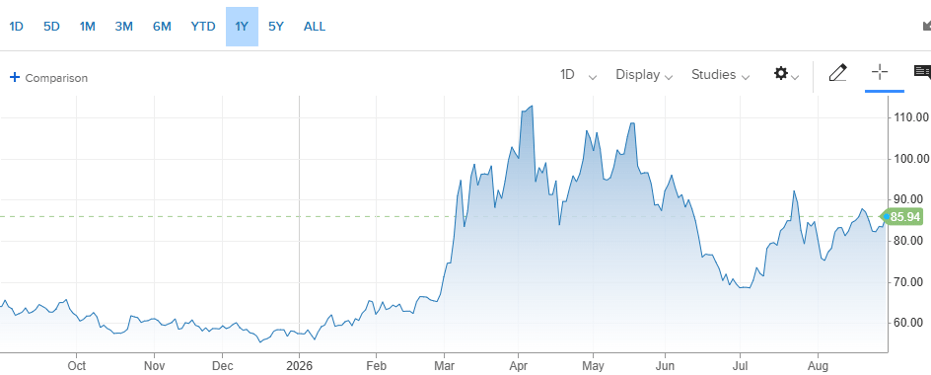
  • WTI Crude Settlement: West Texas Intermediate (WTI) crude settled September at $102.90 per barrel (compared to $90.55 in September).
  • Year-to-Date Performance: WTI is now up 82% for 2026.

Here is a look at the one-year chart for U.S. oil:
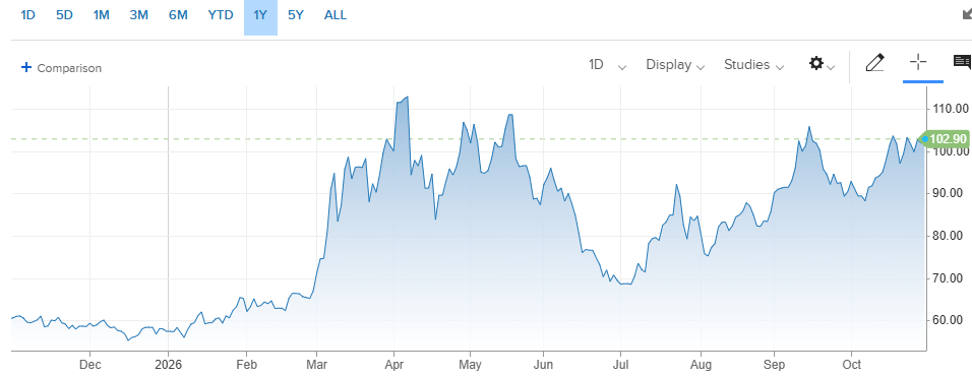
Retail gasoline provided some modest relief in October. This decrease was primarily driven by the seasonal transition to cheaper winter-blend gasoline and a slight dip in driving demand. However, further declines will be sharply limited in the short term. With crude oil prices persistently hovering near or above $100 a barrel due to geopolitical bottlenecks, and winter heating oil demand about to compete heavily with gasoline and diesel for refinery output, expect fuel costs to remain elevated as we close out the year.

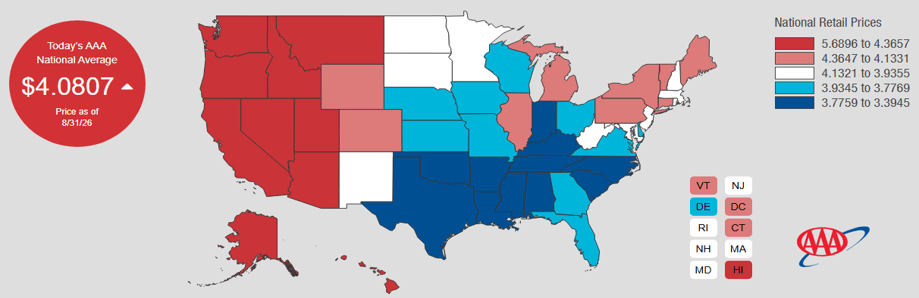
The national average for a gallon of regular unleaded closed out October at $4.20, compared to the $4.43 average recorded at the end of September. Also, diesel has come down about $0.20 per gallon from its record high. North Carolina currently holds the lowest gasoline average in the nation at $3.41 per gallon, while California remains the most expensive at $5.93 per gallon. For comparison, drivers were paying an average of $3.04 per gallon one year ago.
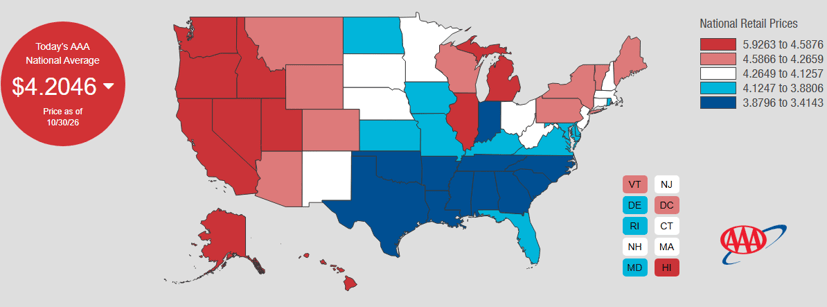
Check out the prices at the pump in your area: AAA Gas Prices.

Outlook

Events on the horizon that could move the markets in the near term:

  • Upcoming Election Consequences & Seasonal Trends: Financial markets have navigated pre-election policy uncertainty throughout October. With the midterms just days away, expect short-term volatility. History still favors the months after midterms: the S&P 500 was higher 12 months after Election Day in every cycle since 1990, including all seven since 1998. Regardless, expect some wild fluctuations in the markets until the dust settles on election results.
  • FOMC Policy, Inflation & Interest Rates: Following the Fed’s October 27-28 decision to hold rates at 3.75%-4.00%, the trajectory for interest rates remains higher for longer. Recent CPI data (headline inflation at 3.6%, core at 2.5%) proved sticky. With the 10-year Treasury yield still near 5%, we are reaching a threshold where elevated yields actively compete with equities for capital flows – short term negative catalyst for stocks.
  • Geopolitics, Tariffs & Supply Chains: The ongoing Iran war and restricted transit through the Strait of Hormuz continue to embed a heavy risk premium into global energy pricing. Furthermore, rising global tensions and expanding tariffs are spurring a shift toward economic fragmentation. Policymakers worldwide are prioritizing domestic production over global integration, causing supply chain pressures to spike once again. To summarize, the war and tariffs will continue to be a dark cloud hanging over the markets.

Please comment or send an email if you have any questions.

Joe Baker, CFP®

Baker Asset Management, LLC

joebaker@bakerassetmanagement.com
Navigating Election Volatility: Keeping Politics Out of Your Investments

Dovetailing from my most recent blog post, The Post-Midterm Rally: 19 for 19, But This Time Has Real Headwinds, I want to explore the psychological side of the political cycle. In that post, we looked at the incredible historical streak of market rebounds after midterm elections, alongside the unique economic challenges we are facing today. But while history is on our side, getting through the election season itself is often easier said than done, especially with the 2026 midterm elections fast approaching. The news cycle is becoming increasingly loud, polarized, and—for many people—a bit stressful. Every day brings a new round of polls, debates, and dramatic predictions about what the future holds depending on which party gains control.

When the political temperature rises, it is entirely natural to feel a sense of urgency. However, as an investor, one of the most critical challenges you will face over the coming months is a simple one: keeping your political beliefs separate from your investment strategy.

To help you keep a steady hand through this election cycle, let’s explore why elections cause so much noise, what history actually tells us about markets and politics, and some practical strategies for staying on track.

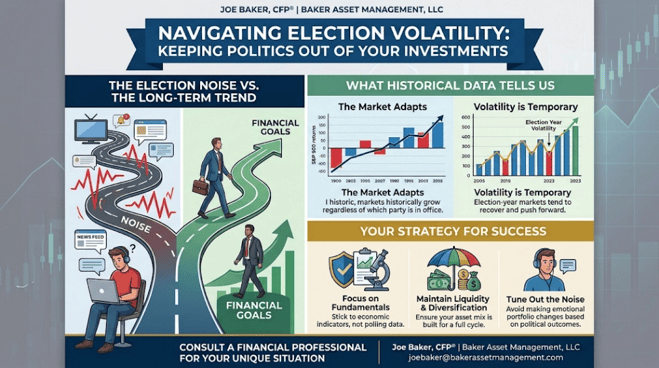
1. The Election Noise vs. The Long-Term Trend

It is easy to fall into the trap of thinking that a specific election outcome will either “save” or “ruining” the economy. The media often amplifies this narrative, framing every legislative shift as a make-or-break moment for your portfolio.

But there is a vast difference between the chaotic “noise” of an election season and the long-term trend of the stock market.

While elections can introduce short-term volatility as the market tries to predict future policies, the long-term trajectory of the S&P 500 is driven by far more powerful forces:

  • Corporate Earnings: The profitability and innovation of American businesses.
  • Economic Fundamentals: Interest rates, consumer spending, inflation, and employment data.
  • Global Progress: Advancements in technology and productivity.

A political party winning or losing an election doesn’t rewrite the fundamental rules of the global economy. Good businesses continue to find ways to generate profit, innovate, and provide value to their shareholders regardless of who holds the gavel in Washington.

2. What Historical Data Tells Us

When we look back at decades of market history, several clear patterns emerge that should reassure anxious investors:

The Market Adapts (Regardless of the Party in Power)

A common misconception is that the stock market only performs well when one specific party is in office. But history tells a very different story.

The S&P 500 has historically grown under all combinations of government—whether we have a Democratic president, a Republican president, a divided Congress, or single-party control. Since World War II, the market’s long-term upward trend has remained remarkably consistent, adapting to different administrations and regulatory environments.

Volatility Is Temporary

Midterm election years (like 2026) are historically known for higher-than-average market volatility, particularly in the months leading up to November. The uncertainty of who will hold power can cause the market to fluctuate.

However, once the results are in—regardless of which party wins—the uncertainty resolves itself. Historically, the market tends to experience a post-election “certainty bounce,” often rallying in the months following a midterm election as businesses and investors adjust to the known landscape.

3. Your Strategy for Success

How do you navigate this polarized environment without letting it affect your hard-earned savings? Here are three strategies to focus on:

Focus on Fundamentals

When evaluating your portfolio, rely on economic indicators, corporate earnings, and interest rates—not polling data. Let the math, not your political opinions, guide your asset allocation.

Maintain Liquidity and Diversification

If you know you will need cash in the near term, ensure you have an adequate liquidity buffer (such as high-yield savings or short-term CDs) so you are never forced to sell stocks during a temporary, election-induced dip. Make sure your portfolio is diversified across different asset classes to smooth out any bumps.

Tune Out the Noise

The single best thing you can do for your portfolio (and your peace of mind) during an election year is to limit your consumption of sensationalized news. Avoid making emotional, impulse changes to your investment plan based on political headlines or debate outcomes.

The Bottom Line

An election is a major event for our country, but it is just one of many events that the stock market encounters and adapts to over time. Your investment plan should be built to withstand a full market cycle—which includes several election cycles.

Please comment or send an email if you have any questions.

Joe Baker, CFP®

Baker Asset Management, LLC

joebaker@bakerassetmanagement.com
The Post-Midterm Rally: 19 for 19, But This Time Has Real Headwinds

With the November 3 midterm elections weeks away, the usual noise is building: attack ads, cable news panels, and a steady drip of “this changes everything” headlines. If you’re an investor, history says the smartest move may be to look past all of it.

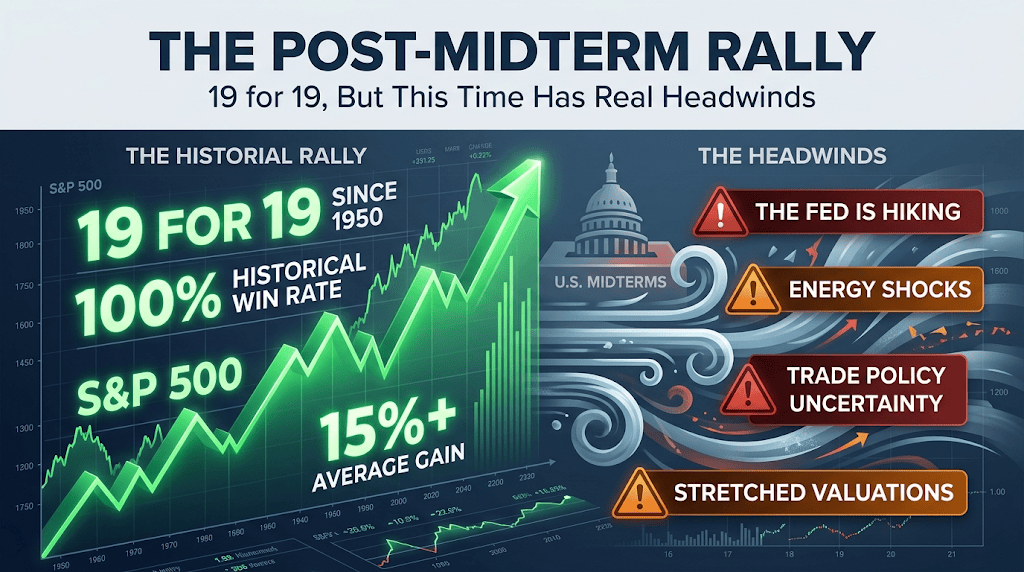
Since 1950, the S&P 500 has not posted a single negative return in the 12 months following a midterm election. That is 19 midterms and 19 positive years—a streak that has endured through recessions, oil shocks, foreign conflicts, and a global financial crisis.

But this cycle arrives with a unique set of obstacles: a rate-hiking Federal Reserve, an energy shock that has already materialized, unresolved trade policy, and near-record valuations. Does the streak survive?

The Streak, in Numbers

The consistency is remarkable. According to research compiled by LPL Research Market Analysis, the S&P 500 has been solidly higher 12 months after every midterm election since 1954. The average gain in the 12 months following a midterm is roughly 15% to 18% depending on the historical window and dataset used. The exact figure varies by methodology, but the direction has never flipped.

However, two caveats are worth keeping in mind:

  • The 12-Month Window Isn’t Calendar 2027: The statistic measures performance across the 12 months following Election Day—roughly November 2026 through November 2027—rather than the standard calendar year.
  • A Weak Starting Point Flatters the Return: Midterm election years themselves are historically sluggish. Data from LPL Research Market Analysis shows that midterm years average lower returns than any other point in the four-year presidential cycle. A bounce off a pre-election slump naturally flatters the subsequent 12-month figure.

Why It Tends to Happen

The primary explanation is simple: markets hate uncertainty, and midterms resolve a tremendous amount of it. Once the results are in, investors can refocus on corporate earnings, fundamental growth, and monetary policy.

What about government gridlock? While often cited as the primary catalyst, the historical evidence is mixed. Some market studies indicate that unified governments have occasionally delivered stronger excess returns than divided ones, and the post-midterm rally has occurred regardless of party alignment.

Keep in mind that 19 data points represent a relatively small sample size that overlaps directly with the broader four-year presidential cycle. A 100% win rate is a compelling base rate, but it is not a law of nature.

Headwind #1: The Fed Is Hiking, Not Easing

It is tempting to assume the historical pattern relied on low-interest-rate environments, but that narrative does not hold up to scrutiny. Only the 2010 midterm coincided with zero interest rates; both the 2018 and 2022 midterms occurred during Fed tightening cycles, and the streak held firm.

What makes today different is the current policy trajectory. As documented in the Federal Reserve Monetary Policy Statement, the central bank raised the benchmark federal funds rate by 25 basis points to a 3.75%–4.00% target range. Detailed analysis in the Raisin FOMC Minutes Breakdown underscores that policymakers remain watchful of sticky inflation.

Higher interest rates pressure valuation multiples—particularly for long-duration technology and AI growth stocks. Consequently, any post-election rally in 2027 will need to be earned through organic corporate earnings growth rather than central-bank liquidity.

Headwind #2: The Energy Shock Already Happened

Geopolitical risk in this cycle is not a hypothetical tail risk. As documented in the Wikipedia Strait of Hormuz Crisis Overview, military conflict disrupted energy transit through the Strait of Hormuz, temporarily bottlenecking global crude supplies and driving Brent crude toward $120 per barrel.

While shipping flows have partially recovered and crude prices have retreated from their peaks, energy markets remain volatile. For investors, the question is no longer “what if energy supplies are disrupted?” but rather how much economic damage corporate margins have already absorbed, and how sticky energy-driven inflation will remain.

Headwind #3: Trade Policy Isn’t Resolved

Election Day will not bring immediate clarity on foreign trade policy. Following the Supreme Court’s February ruling invalidating IEEPA-based tariffs, as detailed in the Levy Economics Institute Tariff Analysis, the administration shifted to broad Section 301 duties across dozens of economies.

As noted in the Coppersmith Section 301 Duty Breakdown, these replacement tariffs face active legal challenges, creating an environment where trade rules remain fluid. This persistent policy shift directly counters the traditional “post-election fading of uncertainty” that markets typically enjoy.

Headwind #4: Valuations Leave Little Margin for Error

While the 19-for-19 streak has survived recessions and wars, starting valuations pose a distinct risk. According to the YCharts S&P 500 Shiller CAPE Ratio Tracker, the Cyclically Adjusted Price-to-Earnings (CAPE) ratio sits near historical highs around 40.7.

Reporting from TheStreet Market Valuation Report highlights that CAPE levels above 40 have historically been associated with lower long-term forward returns. Rich valuation multiples leave the S&P 500 vulnerable to earnings disappointments, especially in a higher-rate regime.

So, Will History Repeat?

The historical baseline remains powerful: a perfect 19-for-19 record is difficult to bet against, and political clarity following Election Day typically frees up sidelined capital.

However, this cycle features a rate-hiking Fed, energy markets recovering from a supply shock, unresolved trade litigation, and stretched valuations. The odds favor a positive 12-month return, but the margin for error is notably thinner than historical averages suggest. High-quality companies with strong balance sheets, pricing power, and resilient cash flows remain best positioned to navigate the terrain ahead.

Please comment or send an email if you have any questions.

Joe Baker, CFP®

Baker Asset Management, LLC

joebaker@bakerassetmanagement.com

A Comprehensive Guide: Are Your Social Security Benefits Taxable?

You may have paid Social Security taxes throughout your working years, so it is natural to wonder whether those benefits can be taxed again in retirement. The answer is that, for many people, some portion of Social Security benefits can be subject to federal income tax.

It is one of the most common questions pre-retirees and new retirees ask. The rules are not always intuitive, and misunderstanding them can lead to an unexpected tax bill that affects your retirement income plan.

That is why this guide is designed to help you understand when Social Security benefits may be taxable, how the calculation works, and what it can mean for your broader financial strategy.

The Key Concept: “Combined Income”

The IRS uses a specific formula to calculate your income for Social Security tax purposes. Your Social Security number (SSN) does not determine your taxability; rather, it’s about your total financial picture.

To understand if your benefits are taxable, you must first determine your Combined Income, also known as Modified Adjusted Gross Income (MAGI).

The Combined Income Formula:

Combined Income = Adjusted Gross Income (AGI) + Nontaxable Interest + 50% of Your Social Security Benefits

Think of it as adding all your taxable income (like wages, pensions, and capital gains) plus your tax-exempt interest income (e.g., from municipal bonds), and then adding exactly half of your total Social Security benefits.

Navigating Federal Income Brackets

Once you have your Combined Income, the IRS uses three income thresholds to calculate the percentage of your benefits that are taxable at the federal level. The limits are different for individuals and married couples filing jointly:

If You File as “Single,” “Head of Household,” or “Qualifying Widow(er)”:

  • Under $25,000: 0% of your benefits are taxable. (Congratulations, you might get all your Social Security tax-free!)
  • $25,000 to $34,000: Up to 50% of your benefits may be subject to tax.
  • Over $34,000: Up to 85% of your benefits may be taxable.

If You File as “Married Filing Jointly”:

  • Under $32,000: 0% of your benefits are taxable.
  • $32,000 to $44,000: Up to 50% of your benefits may be subject to tax.
  • Over $44,000: Up to 85% of your benefits may be taxable.

Note on “Up to”: The 50% and 85% are maximums. The calculation is dynamic. For illustrative examples of precise tax situations, you would need to run detailed scenarios, but these brackets give you the essential ranges.

Don’t Forget About State Taxes

While federal rules apply across the entire country, state-level rules vary significantly.

  • Across the United States: The vast majority of states (42 states plus Washington, D.C.) exempt Social Security benefits from state income taxes entirely. However, a small handful of states—including Colorado, Connecticut, Minnesota, Montana, New Mexico, Rhode Island, Utah, and Vermont—still tax a portion of Social Security income based on state-specific thresholds.

If you are considering moving or splitting time between states in retirement, factoring state-level taxation into your plan is just as vital as federal planning.

What This Means for Your Financial Strategy

Understanding these rules is about more than just a tax form. It affects everything from your monthly cash flow to your overall retirement strategy.

1. Unexpected Taxes

A larger-than-expected tax bill can reduce the cash flow you thought you had available for spending.

2. Withdrawal Strategy

Where you draw income from matters. Pulling too much from taxable accounts or traditional retirement accounts can increase your provisional income and make more of your Social Security benefits taxable.

3. RMDs

Required minimum distributions can create a ripple effect. If RMDs raise your income enough, they can increase the taxable portion of your Social Security benefits as well.

4. Coordination Matters

Planning withdrawals from Traditional IRAs, Roth IRAs, brokerage accounts, and other sources together can help create a more tax-efficient retirement plan.

Taking the Next Step

These rules are manageable once you understand the framework, but they can still be complicated when you apply them to your own numbers. Your situation may also change over time as income, investment returns, tax law, and retirement needs change.

If you are making retirement income decisions, it is wise to consult a qualified financial professional or tax professional. They can help you run scenarios using your actual figures and build a withdrawal strategy that fits your goals.

The bottom line: Social Security benefits are not always tax-free in retirement, and the amount subject to tax depends on your overall income picture. With the right planning, you can better understand the rules and make smarter decisions about your retirement cash flow.

Please comment or send an email if you have any questions.

Joe Baker, CFP®

Baker Asset Management, LLC

joebaker@bakerassetmanagement.com
Monthly Update – October 2026

Calendar Notes

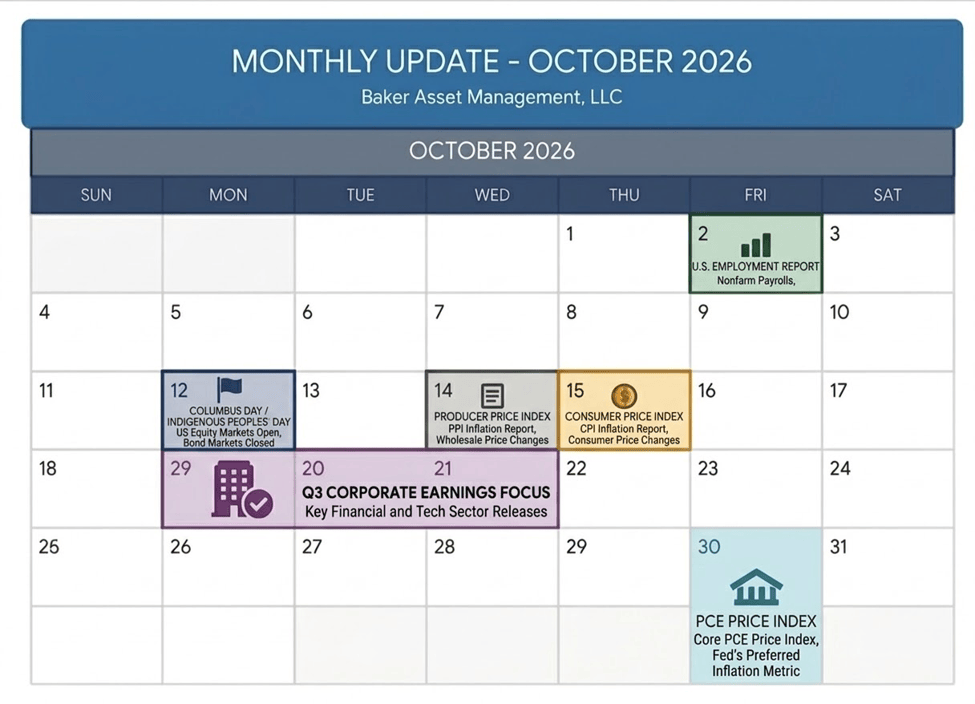
  • U.S. stock exchanges (NYSE and Nasdaq) will operate under normal trading hours on Monday, October 12, 2026 (Columbus Day / Indigenous Peoples’ Day). However, U.S. bond markets and banking institutions will be closed.

Market Overview: Stocks

Stocks navigated a volatile September, balancing persistent momentum in artificial intelligence infrastructure against hawkish monetary signals, a recent Fed rate hike, and surging energy costs from ongoing Middle East conflicts. The ongoing combination of expanding import tariffs and the war involving Iran is creating a dual squeeze—dragging down corporate profit margins while simultaneously eroding consumer purchasing power, particularly for small businesses and lower-income households. While corporate balance sheets remain fundamentally sound, macroeconomic headwinds and 25%–50% administrative tariffs continue to keep equity indices within a broader consolidated trading range.

For the month of September, the S&P 500 finished down just slightly, -0.45%, edging out its historical September average of -0.70%. Year-to-date, the index is up 11.08%, still on track to hit 4 years in a row of positive double digit returns for the index. Tech sector leaders remain the core engine of market earnings, while broader index participation is being held back by rising interest rates, surging input costs and increasing tariffs.

On the fundamental side, mega-cap tech leaders continue to fund heavy capital expenditures directly out of robust free cash flow rather than short-term debt. Additionally, while Supreme Court-mandated tariff refunds provide a liquidity windfall for specific importers, broader corporate bottom lines are continuing to absorb persistent input and transport cost pressures heading into third-quarter earnings.

Historically, the S&P 500 has averaged a monthly return of approximately 2% in October over the past 30 years. From a seasonal perspective, October carries a reputation for heightened stock market volatility (frequently referred to as the “October Effect”). However, long-term market data also highlights October as a reliable inflection point—a “bear killer” month that frequently establishes the structural floor for a fourth-quarter rally as earnings and political clarity emerge. Additionally, count on an erratic month for stocks as the country prepares for the mid-term elections.

Near-Term Outlook: Expect increased volatility through October with heightened sensitivity to Q3 earnings guidance, energy prices, Fed policy communications, and upcoming election developments.

Take a look at the Outlook section below for more details on what events could move the markets over the short term.

Fixed Income Markets

Bond markets spent September parsing two contrasting forces: the Federal Reserve’s restrictive monetary stance following its recent interest rate hike, and Treasury Secretary Scott Bessent’s ongoing debt-management initiatives.

Fed Chairman Kevin Warsh reiterated that the FOMC will maintain a firm policy stance as long as supply-driven inflation and tariff friction persist. In contrast, Treasury Secretary Scott Bessent has continued targeted adjustments to Treasury issuance—shifting a larger proportion of government borrowing into short-term bills while conducting bond buybacks to suppress long-duration yields. However, against expanding federal deficits and sticky inflation, this strategy acts more like a temporary patch than a structural fix, keeping 10-year yields firmly above 5.0% and mortgage rates elevated.

  • 10-Year U.S. Treasury Note Yield: Finished September at 5.23% (compared to 4.76% in August).
  • 30-Year U.S. Treasury Bond Yield: Closed September at 5.63% (compared to 5.25% in August).
  • High-Yield Credit Spread (HYCS): Finished September at 3.02% (compared to 2.91% in August).

While credit spreads remain historically tight, indicating credit markets continue to price in minimal systemic corporate distress, the recent upward tick demonstrates expanding risk premiums as markets absorb sticky tariff inflation, elevated fuel costs, and hawkish Fed policy communications heading into Q3 earnings. Something to keep an eye on.

FOMC October Preview

The Federal Open Market Committee will convene for its next policy meeting on October 27–28, 2026. With Chairman Warsh prioritizing inflation control over short-term growth, monetary policy is expected to remain firm, with the possibility of another rate hike still on the table.

Fixed Income Strategy

Given elevated short-term interest rates, investors should maintain a disciplined focus on short-duration assets. Consider allocating maturing capital toward high-grade, short-term Treasuries and FDIC-insured bank CDs with maturities under two years, securing yields in the 4.35% to 4.85% range while shielding portfolios from duration-driven price volatility. Recommend holding until maturity to ensure full return of principal.

Tax Efficiency Note: Short-term U.S. Treasuries yielding near 4.50% carry a distinct structural advantage over traditional bank CDs and money market accounts. Interest earned on U.S. Treasury securities is completely exempt from state and local income taxes across all states, delivering a superior net after-tax yield for clients in tax-paying states compared to standard bank products.

Savings Rates

Following the Fed’s recent rate increase, yields on short-term liquid reserves remain highly attractive. A substantial yield gap still persists between traditional brick-and-mortar institutions and competitive online banking platforms.

Account TypeAverage Rate (APY)Highest Rate (APY)
Money Market Account0.63%4.10%
High-Yield Savings Account0.65%4.35%
1-Year CD2.09%4.55%
3-Year CD1.72%4.95%
5-Year CD1.78%5.10%

Total assets in U.S. money market funds continue to climb, currently at $7.94 trillion. Cash reserves are expected to stay elevated until short-term yields undergo a sustained decline. Certificates of deposit (CDs) and High-Yield Savings Accounts (HYSAs) remain practical instruments for maintaining liquid emergency funds. Please ensure total deposits at any single banking institution stay within the $250,000 per-person threshold for full FDIC protection.

Mortgage & Housing Market

Mortgage rates trended upward in September as bond markets reacted to the recent Federal Reserve interest rate hike and persistent long-term yield pressures. While Treasury Secretary Scott Bessent’s debt management initiatives continue, aimed at lowering long-term yields, elevated borrowing costs continue to keep homebuying activity constrained by structural affordability challenges.

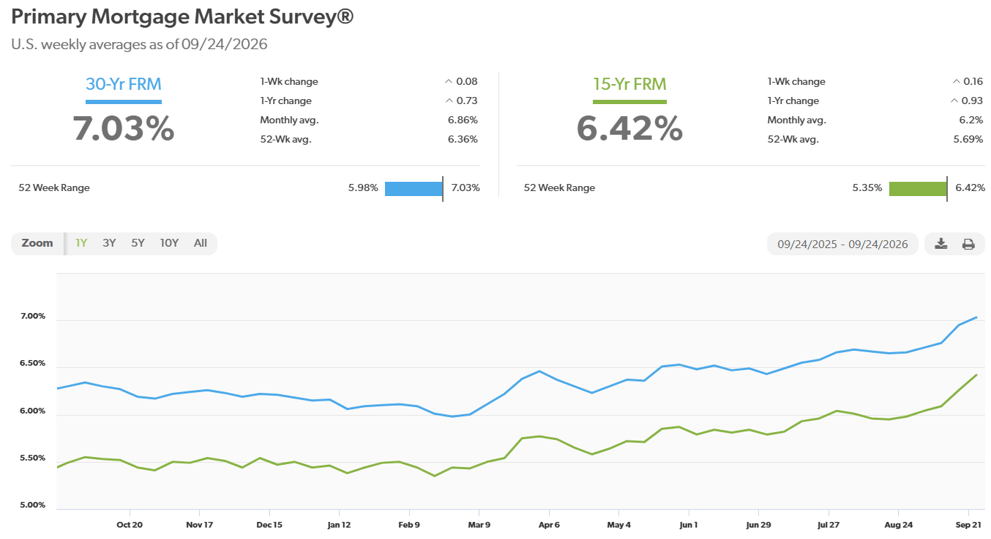
According to Freddie Mac, the 30-year fixed-rate mortgage averaged 7.03% in late September, up from 6.66% recorded at the end of August. The 15-year fixed-rate mortgage averaged 6.42%, up from 5.98% last month. Moving into October, residential borrowing rates are anticipated to fluctuate between 6.85% and 7.20%, with expanding seasonal housing inventory offering buyers relatively more selection than in prior seasons, even as high monthly carrying costs suppress overall transaction volume.

Here is a look at the one-year chart of the 15- and 30-year mortgage rates from Freddie Mac.

Energy Markets

Crude oil benchmarks experienced continued volatility in September as geopolitical bottlenecks remained unmitigated in the Middle East. With commercial shipping through the Strait of Hormuz remaining severely restricted and war-risk transit surcharges elevated, structural supply constraints continue to embed a persistent geopolitical premium into global energy pricing.

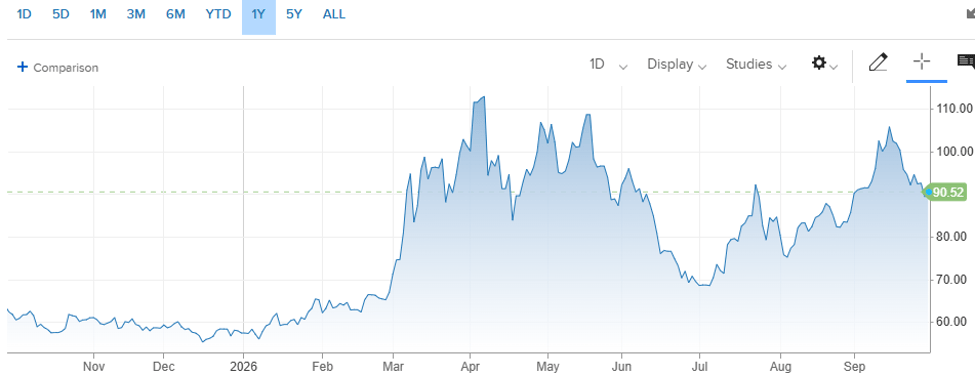
  • WTI Crude Settlement: West Texas Intermediate (WTI) crude settled September at $90.55 per barrel (compared to $85.94 in August).
  • Year-to-Date Performance: WTI is currently up 58% for 2026.

Here is a look at the one-year chart for U.S. oil:

Retail gasoline prices remained elevated throughout September as persistent transit restrictions through the Strait of Hormuz and high refining surcharges offset standard shoulder-season relief. Sustained fuel costs continue to act as a regressive tax on consumers, hitting lower-income households the hardest and eroding discretionary budgets, while keeping shipping, delivery, and fleet overhead elevated for small business owners heading into the fourth quarter.

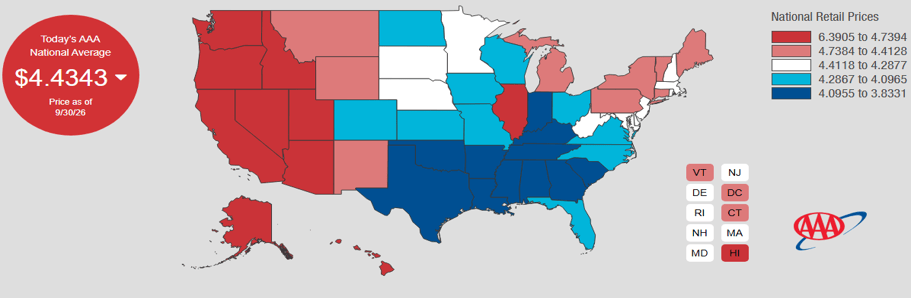
The national average for a gallon of regular unleaded closed out September at $4.43, compared to the $4.08 average recorded at the end of August. Also, diesel just hit its highest average price on record at $6.53 a gallon last week. Indiana currently holds the lowest gasoline average in the nation at $3.83 per gallon, while California remains the most expensive, by far, at $6.39 per gallon. For comparison, drivers were paying an average of $3.15 per gallon one year ago. While seasonal driving demand typically tapers into autumn, ongoing geopolitical chokepoints and elevated war-risk insurance premiums will maintain a firm floor under retail fuel costs.

Check out the prices at the pump in your area: AAA Gas Prices.

Outlook

Events on the horizon that could move the markets in the near term:

  • FOMC Policy & Interest Rate Hikes: The Federal Reserve continues to maintain a firm monetary stance under Chairman Kevin Warsh to prevent supply-side inflation from becoming embedded in long-term economic expectations, reinforcing the recent rate increase. This persistent hawkish monetary stance puts downward pressure on stock valuations while driving benchmark bond yields higher and bond prices lower.
  • Trade Tariffs & Goods Inflation: Administrative tariff measures continue to create trade friction across key partners, with Section 338 tariffs on certain Canadian imports reaching 50%, a 25% Section 301 tariff applying to many Brazilian imports, and a range of product-specific tariffs remaining on Chinese imports. Tariffs continue to pressure the margins of businesses that rely on imported inputs and contribute to inflationary pressure, typically hurting stock and bond prices. Conversely, removing tariffs would immediately relieve profit margin pressure on small businesses, lower living expenses for lower-income Americans, and provide a strong fundamental tailwind for another leg up in stock prices.
  • Middle East Conflict & Energy Supply: The ongoing war involving Iran and restricted commercial transit through the Strait of Hormuz continue to embed a heavy risk premium into global energy pricing and shipping freight, disproportionately penalizing small businesses and lower-income households. Further military escalation will push crude costs higher, driving stock prices down and bond prices lower. Conversely, ending the war with Iran and reopening the Strait of Hormuz would eliminate energy surcharges, deliver direct economic relief to small businesses and lower-income Americans, and act as a powerful tailwind for another major leg up for stocks while pushing bond prices higher as inflation risks recede.
  • Upcoming Election Consequences & Seasonal Trends: Financial markets dislike political policy uncertainty leading into the November midterms, though historical seasonal trends show October frequently acts as a “bear killer” that sets up strong Q4 rallies once election results clear. Pre-election policy uncertainty temporarily pushes stock prices down and increases bond yield volatility, but post-election clarity historically pushes stock prices up and stabilizes bond prices. Markets will no doubt be volatile for the next few months as elections get finalized but expect the dust to settle before the end of the year.

Please comment or send an email if you have any questions.

Joe Baker, CFP®

Baker Asset Management, LLC

joebaker@bakerassetmanagement.com
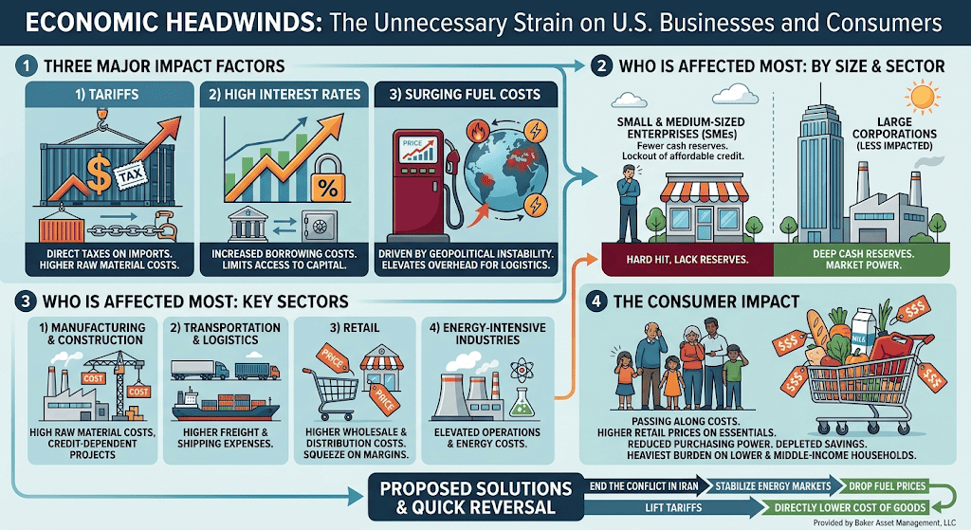
Economic Headwinds: The Unnecessary Strain on U.S. Businesses and Consumers

The U.S. economy has shown remarkable resilience, largely buoyed by a historic surge in productivity and investment driven by the artificial intelligence revolution. However, that underlying momentum is now in serious jeopardy due to three major self-inflicted pressures: high interest rates, trade tariffs, and surging inflation driven by skyrocketing fuel costs. These conditions create an unnecessary drag on economic expansion, but they could be reversed quickly by ending the conflict in Iran to stabilize global energy markets and removing trade tariffs.

Here is a breakdown of how these factors are impacting the market and who is bearing the brunt of the burden:

The Core Economic Pressures

  • Tariffs: Tariffs act as a direct tax on imported goods, raising the cost of raw materials and inventory. Businesses are forced to either absorb these losses or pass them on to consumers, driving inflation higher.
  • Surging Fuel Costs: Geopolitical conflict—specifically the war in Iran—has pushed fuel and energy prices up rapidly. This disproportionately increases overhead for any business reliant on physical operations, shipping, or manufacturing.
  • High Interest Rates: Elevated borrowing costs mean that securing capital for business expansion, equipment upgrades, or day-to-day cash flow management is now prohibitively expensive.

Who is Affected the Most?

  • By Business Size: Small and medium-sized enterprises (SMEs) bear the heaviest load. Unlike massive multinational corporations, SMEs lack the deep cash reserves and market power to absorb sustained cost increases, while high interest rates restrict their access to affordable working capital.

  • By Sector:
  • Manufacturing & Construction: Heavily reliant on raw materials subject to tariffs and credit-dependent for project financing.
  • Transportation & Logistics: Surging fuel costs act as an immediate hit to margins for any firm moving physical goods.
  • Retail: Retailers are squeezed on both ends—paying higher wholesale and transport costs while selling to consumers whose discretionary budgets are pinched by inflation.

  • By Consumer (Lower and Middle-Income Households): Ultimately, these corporate cost pressures spill over onto everyday households. As businesses pass along tariff taxes, elevated freight charges, and higher borrowing expenses, retail prices rise on essential goods like food, energy, and household staples. Lower and middle-income families—who spend a significantly larger portion of their take-home pay on basic necessities—bear the heaviest burden, facing reduced purchasing power and depleted savings as living costs climb.

The Solution

The clearest, most efficient path to economic relief requires straightforward policy changes. Ending the conflict in Iran would immediately ease energy market volatility and lower fuel prices at the pump, while lifting tariffs would directly reduce input costs for businesses and bring relief to consumer budgets across the board. By eliminating these primary drivers of inflation, the Federal Open Market Committee (FOMC) would have the leeway needed to lower interest rates without the risk of runaway prices, providing immediate relief to borrowing businesses and the broader economy.

Please comment or send an email if you have any questions.

Joe Baker, CFP®

Baker Asset Management, LLC

joebaker@bakerassetmanagement.com
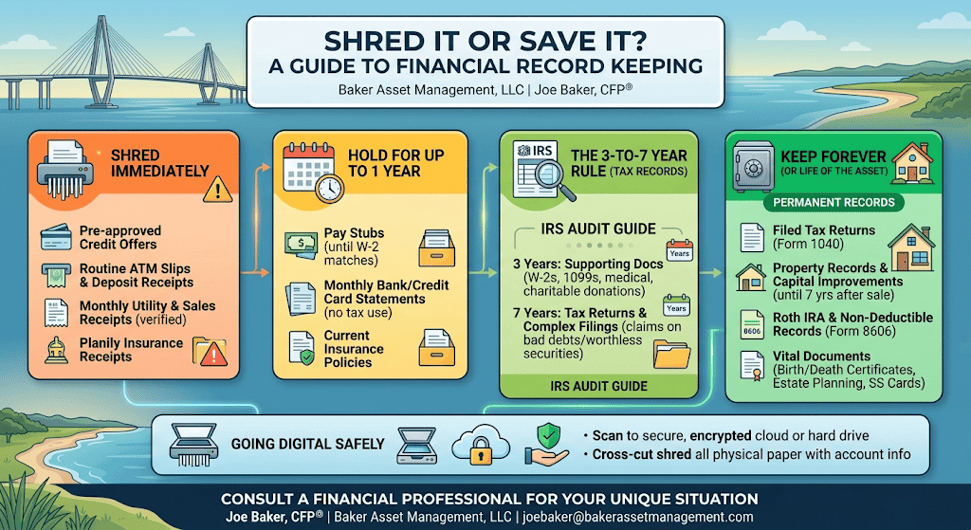
To Keep or Shred? A Guide to Financial Record Keeping

Between physical filing cabinets and sprawling digital downloads, managing financial paperwork can quickly become overwhelming. Holding onto every piece of paper creates unnecessary clutter, while tossing the wrong document can lead to headaches at tax time—or worse, identity theft if improperly discarded.

Knowing what to keep, what to digitize, and what to run through the shredder keeps your financial life secure and organized.

Shred Immediately

  • Pre-approved credit card offers and loan solicitations: Primary targets for identity thieves if left in the trash.
  • Routine ATM slips and deposit receipts: Shred as soon as you verify the transaction on your online bank statement.
  • Monthly utility and sales receipts: Toss after verifying payment, unless you need the receipt for a product warranty, insurance, or a home-office tax deduction.

Hold for Up to 1 Year

  • Pay stubs: Hold until you receive your annual W-2 to verify that earnings and withholdings match.
  • Monthly bank and credit card statements: Keep for up to a year to review annual spending patterns, unless they contain transactions needed for tax deductions.
  • Current insurance policies: Retain current declarations pages; shred expired policies once new coverage is active.

The 3-to-7 Year Rule (Tax Records)

  • Supporting tax documentation (3 Years): The IRS standard period of limitations for an audit is generally three years from the date you filed. Keep 1099s, W-2s, medical bills, and charitable donation receipts for at least this timeframe.
  • Tax returns and complex filings (7 Years): To be safe, retain supporting tax files for seven years. The IRS audit window extends to six years if income is underreported by more than 25%, and seven years for claims on bad debts or worthless securities.

Keep Forever (or Life of the Asset)

  • Filed tax returns (Form 1040): Keep actual tax returns permanently—either as PDFs or physical copies—for personal reference and Social Security verification.
  • Property records & capital improvements: Retain home closing documents, title deeds, and major renovation receipts until at least seven years after you sell the property to substantiate your tax cost basis.
  • Roth IRA & non-deductible IRA records: Keep Form 8606 and contribution records indefinitely to prove tax-free basis upon future withdrawals.
  • Vital personal documents: Birth/death certificates, marriage licenses, military discharge papers, estate planning documents (wills, trusts, powers of attorney), and Social Security cards should remain locked in a fireproof safe.

Going Digital Safely

When clearing out physical files, scanning documents to a secure, encrypted cloud storage service or encrypted hard drive is an effective way to stay organized. However, always use a cross-cut shredder for any physical paper containing account numbers, Social Security numbers, or personal identifying information.

Please comment or send an email if you have any questions.

Joe Baker, CFP®

Baker Asset Management, LLC

joebaker@bakerassetmanagement.com
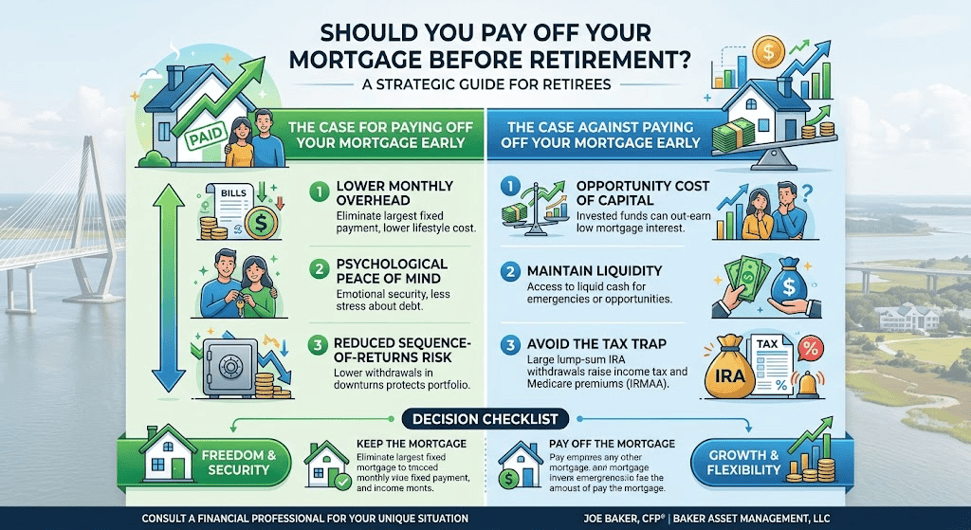
Should You Pay Off Your Mortgage Before You Retire?

For generations, the ultimate retirement milestone was the “mortgage-burning party”—that moment you paid off your final home loan statement and officially owned your piece of property free and clear.

Entering retirement completely debt-free sounds like a no-brainer. But as with most things in financial planning, the actual answer to “Should I pay off my mortgage before I retire?” isn’t always a simple yes or no.

While eliminating a monthly mortgage payment provides undeniable psychological comfort, writing a massive check to clear your home loan can sometimes work against your overall financial flexibility.

If you’re approaching retirement and weighing this decision, here are the core trade-offs to consider before making a move.

The Case FOR Paying Off Your Mortgage

1. Lower Monthly Overhead

Your mortgage is likely your single largest recurring monthly expense. Eliminating principal and interest payments drastically lowers the baseline income you need each month to maintain your lifestyle. Lower required income means smaller withdrawals from your portfolio.

2. Protection Against “Sequence-of-Returns” Risk

One of the biggest risks in early retirement is a major market downturn right after you stop working. If the market drops and you still have high fixed expenses (like a mortgage), you are forced to sell depreciated investments to pay your bills. By eliminating the mortgage, you lower your mandatory distributions, allowing your investment accounts more room to recover during lean market years.

3. Unbeatable Peace of Mind

The emotional benefit of owning your home outright cannot be overstated. For many retirees, knowing that their housing is secure—regardless of what happens to the stock market or the economy—is worth more than any theoretical mathematical gain.

The Case AGAINST Paying Off Your Mortgage

1. The Opportunity Cost of Capital

If you secured a low fixed mortgage rate in past years, the math may favor keeping the loan. If your mortgage rate is sitting at 3% or 4%, but your diversified investment portfolio or high-yield cash vehicles are earning a higher return, your money may work harder for you staying invested rather than locked up in home equity.

2. Illiquidity: You Can’t Eat Real Estate

Home equity is illiquid wealth. Money used to pay down a mortgage is tied up in bricks and mortar. If an unexpected medical emergency, home repair, or family need arises, accessing that home equity quickly isn’t easy—especially once you no longer have a earned income to qualify for a traditional home equity loan. Having liquid cash or accessible taxable investments provides a safety cushion that a paid-off house cannot.

3. The Tax Trap of Large Lump-Sum Withdrawals

If you don’t have enough liquid cash sitting in a bank account and need to withdraw funds from a Traditional IRA or 401(k) to pay off the mortgage balance, be extremely careful. That withdrawal counts as ordinary income. A single large distribution can instantly push you into a significantly higher tax bracket, trigger higher Medicare premium surcharges (IRMAA), and create a hefty tax bill that wipes out any savings on mortgage interest.

A Quick Checklist: Which Side Are You On?

It may make sense to KEEP your mortgage if:

  • You hold a very low fixed interest rate.
  • Paying it off would drain your liquid emergency reserves.
  • Clearing the balance requires pulling a large lump sum out of a taxable retirement account.

It may make sense to PAY OFF your mortgage if:

  • You have excess idle cash sitting in low-interest savings accounts that can cover the balance without tax consequences.
  • Carrying debt causes you significant stress or anxiety.
  • Eliminating the payment is essential for your retirement cash flow to balance out.

The Bottom Line

There is no one-size-fits-all answer. The choice between mathematical optimization and emotional peace of mind comes down to your personal risk tolerance, tax profile, and retirement cash flow goals.

Before making a large lump-sum payment on your mortgage, it’s always wise to run the numbers to see how it impacts your long-term retirement projections and tax liability.

Please comment or send an email if you have any questions.

Joe Baker, CFP®

Baker Asset Management, LLC

joebaker@bakerassetmanagement.com
Monthly Update – September 2026

Calendar Notes

Market Overview: Stocks

Stocks navigated a volatile August, balancing persistent momentum in artificial intelligence infrastructure against hawkish monetary signals and elevated long-term borrowing costs. While corporate balance sheets remain fundamentally sound, macroeconomic headwinds continue to keep equity indices within a broader consolidated trading range.

For the month of August, the S&P 500 finished up 2.6%, easily besting its historical average of -0.01%. Year-to-date, the index is 12.3%. Tech sector leaders remain the core engine of market earnings, while broader index participation continues to adjust to delayed rate-cut expectations reinforced by Fed Chairman Kevin Warsh’s recent remarks at the Jackson Hole Economic Symposium.

On the fundamental side, mega-cap tech leaders continue to fund heavy capital expenditures directly out of robust free cash flow rather than short-term debt. Additionally, corporate bottom lines are continuing to absorb the liquidity windfall from cleared tariff refunds, providing a buffer against persistent input cost pressures.

From a seasonal perspective, September has historically been the most challenging month of the year for equities. Over the past 30 years, the S&P 500 has averaged a monthly return of approximately -0.70% in September, frequently characterized by increased institutional volume, portfolio rebalancing, and corporate guidance updates ahead of the fourth quarter. While seasonal trends suggest potential near-term choppy trading, long-term fundamentals remain intact. Count on an erratic month for stocks as traders and investors get back to work.

Near-Term Outlook: Expect increased volatility through September with heightened sensitivity to inflation prints, Fed policy communications, and ongoing geopolitical developments.

Take a look at the Outlook section below to see what events could move the markets over the short term.

Fixed Income & Bond Markets

Bond markets spent August parsing two contrasting forces: hawkish messaging from the Federal Reserve and strategic debt-management initiatives from the U.S. Treasury.

During his speech at the Jackson Hole Economic Symposium, Fed Chairman Kevin Warsh reiterated that the FOMC will maintain a restrictive policy stance as long as supply-driven inflation risks persist. In contrast, Treasury Secretary Scott Bessent outlined targeted adjustments to Treasury issuance—shifting a larger proportion of government borrowing into short-term bills to curb the supply of long-duration bonds. This strategy aims to suppress upward pressure on 10-year and 30-year yields, easing borrowing costs across the broader economy.

10-Year U.S. Treasury Note Yield: Finished August at 4.76% (compared to 4.75% in July).

30-Year U.S. Treasury Bond Yield: Closed August at 5.25% (compared to 5.28% in July).

I continue to monitor the High-Yield Credit Spread (HYCS), which finished August at 2.91%. With spreads hovering near extreme lows, credit markets continue to price in minimal economic distress. Given structural cost pressures and geopolitical risks, maintaining high credit quality in fixed-income allocations remains essential.

FOMC September Preview

The Federal Open Market Committee will convene for its next policy meeting on September 15–16, 2026, which will include an updated Summary of Economic Projections (SEP) and “Dot Plot.” The Fed is widely expected to maintain the target federal funds rate at 3.50%–3.75%. However, with hawkish dissents present at the July meeting and Chairman Warsh emphasizing inflation risks at Jackson Hole, policy rate cuts remain off the table for the remainder of 2026.

Fixed Income Strategy

Given elevated short-term interest rates, investors should continue to have a disciplined focus on short-duration assets. Continue to allocate capital toward high-grade, short-term Treasuries and FDIC-insured bank CDs with maturities under two years, capturing yields in the 4%+ range while shielding portfolios from duration-driven price volatility.

Savings Rates

Yields on liquid cash holdings remained strong throughout August, supported by the Federal Reserve’s steady federal funds rate. A substantial yield gap persists between traditional brick-and-mortar institutions and competitive online banking platforms.

Account TypeAverage Rate (APY)Highest Rate (APY)
Money Market Account0.45%3.90%
High-Yield Savings Account0.62%4.15%
1-Year CD2.03%4.30%
3-Year CD1.69%4.35%
5-Year CD1.74%4.35%

Total assets in U.S. money market funds remain near historic levels in the $7.85 trillion range. Cash reserves are expected to stay elevated until short-term yields undergo a sustained decline. Certificates of deposit (CDs) and High-Yield Savings Accounts (HYSAs) remain practical instruments for maintaining liquid emergency funds. Please ensure total deposits at any single banking institution stay within the $250,000 per-person threshold for full FDIC protection.

Mortgage & Housing Market

Mortgage rates showed signs of stabilization in August as markets evaluated Treasury Secretary Scott Bessent’s efforts to moderate long-term benchmark yields. While lower long-term yields help cap mortgage rate spikes, homebuying activity remains constrained by structural affordability challenges.

According to Freddie Mac, the 30-year fixed-rate mortgage averaged 6.66% in late August, same as July. The 15-year fixed-rate mortgage averaged 5.98%, down slightly from 6.04% last month. Moving into September, residential borrowing rates are anticipated to fluctuate between 6.40% and 6.75%, with expanding housing inventory offering buyers relatively more selection than in prior seasons.

Here is a look at the one-year chart of the 15- and 30-year mortgage rates from Freddie Mac.

Energy Markets

Crude oil benchmarks experienced continued volatility in August as geopolitical bottlenecks remained unmitigated in the Middle East. With commercial shipping through the Strait of Hormuz remaining severely restricted and war-risk transit surcharges elevated, structural supply constraints continue to embed a persistent geopolitical premium into global energy pricing.

  • WTI Crude Settlement: West Texas Intermediate (WTI) crude settled August at $85.94 per barrel (compared to $84.81 in July).
  • Year-to-Date Performance: WTI is currently up 50% for 2026.

A key development in energy markets this month was the announcement of a strategic Venezuelan oil deal, paving the way for incremental crude exports to re-enter global distribution channels. However, it is not expected to have any impact on oil prices for several years due to the extensive infrastructure upgrades required to extract and refine these oil reserves. Regardless, overall energy overhead remains elevated due to geopolitical risk premiums and war-risk shipping insurance.

Here’s a look at the one-year chart for U.S. oil:

Retail gasoline prices experienced modest fluctuations throughout August as the peak summer driving season drew to a close. While news of additional heavy crude exports from the newly announced Venezuelan oil deal provided brief sentiment relief, underlying fuel costs remained underpinned by persistent transit restrictions through the Strait of Hormuz and elevated refining surcharges. High pump prices continue to act as a direct drag on consumer discretionary budgets while keeping logistics and delivery overhead elevated for small business owners heading into autumn.

The national average for a gallon of regular unleaded closed out August at $4.08, compared to the $4.11 average recorded at the end of July. Indiana currently holds the lowest gasoline average in the nation at $3.39 per gallon, while California remains the most expensive at $5.69 per gallon. By comparison, drivers were paying an average of $3.19 per gallon one year ago. As driving demand seasonally tapers into the fall shoulder season, retail prices may see incremental relief, though ongoing geopolitical chokepoints will likely maintain an elevated floor under fuel costs.

Check out the prices at the pump in your area: AAA Gas Prices.

Outlook

Events on the horizon that could move the markets in the near term:

  • Fed Policy & Jackson Hole Insights: At the Jackson Hole Economic Symposium, Chairman Kevin Warsh emphasized that monetary policy must remain firm to prevent supply-side inflation from becoming embedded in long-term expectations. The Fed’s policy stance remains firmly focused on inflation control, keeping rate-cut expectations sidelined. This hawkish monetary stance puts near-term downward pressure on stock valuations while driving benchmark bond yields higher and bond prices lower.
  • Treasury Yield Curve Management: Treasury Secretary Scott Bessent’s initiative to shorten average Treasury issuance maturities aims to lower long-term interest rates by reducing long-bond supply. If effective, this strategy could help stabilize mortgage rates and corporate debt financing costs even while the Fed maintains high short-term policy rates. Capping long-term yield spikes provides a supportive tailwind for stock valuations and supports long-duration bond prices.
  • Trade Tariffs & Goods Inflation: Administrative tariff measures continue to escalate trade friction across key trade partners. Section 338 tariffs on targeted Canadian imports have reached up to 50% across key product categories, while combined Section 301 tariffs on Brazil have reached 37.5%. Cumulative Section 301 tariffs on Chinese imports remain heavy at 25% to 50% across industrial sectors. While Supreme Court-mandated duty refunds provide balance sheet relief for specific U.S. importers, these broad trade barriers continue to filter into consumer prices, adding an estimated 3.1% to core goods PCE inflation. Elevated tariff surcharges hurt corporate profits and eventually stock prices while feeding inflation that hurts consumer demand and drags bond prices lower.
  • Middle East Conflict & Energy Supply: The ongoing war involving Iran and restricted commercial transit through the Strait of Hormuz continue to embed a heavy risk premium into global energy pricing and freight surcharges. Near-term equity performance remains exceptionally sensitive to geopolitical developments in the region. Further military escalation or expanded shipping disruptions will push crude costs higher and drive stock prices lower, whereas a diplomatic breakthrough or guaranteed safe maritime transit would dismantle the energy risk premium and drive stock prices higher. Right now, it looks like escalation is the path of least resistance.

Please comment or send an email if you have any questions.

Joe Baker, CFP®

Baker Asset Management, LLC

joebaker@bakerassetmanagement.com
The Best Way to Fund College….and Beyond

For years, one of the biggest hesitations I’ve heard from parents and grandparents about funding a 529 college savings plan was the fear of overfunding it. “What if they get a scholarship?” or “What if they don’t go to college? We’ll get hit with taxes and a 10% penalty if we pull the money out.”

Thanks to the SECURE 2.0 Act, that fear is largely gone.

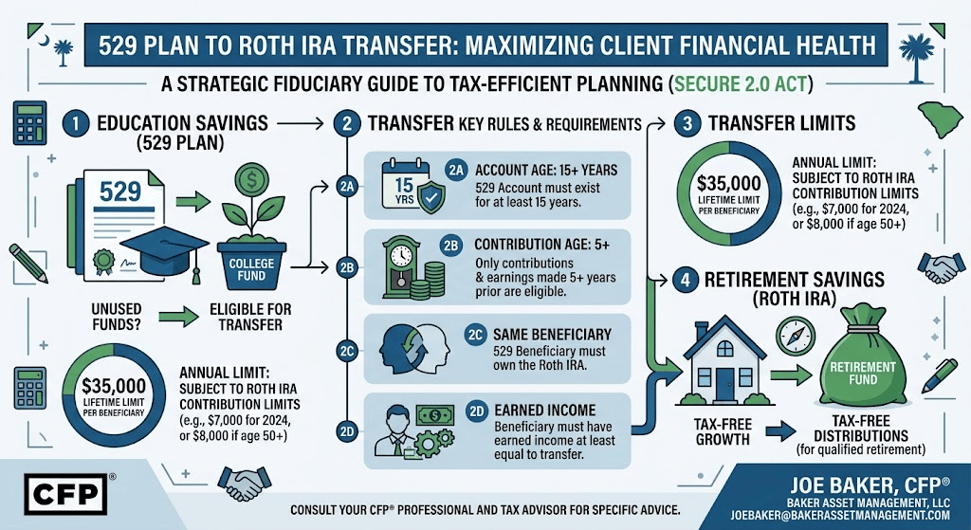
We now have a powerful new financial planning tool: the ability to roll over unused 529 plan funds directly into a Roth IRA for the beneficiary. This effectively turns an education savings account into a tax-free retirement springboard.

Here’s how it works and what you need to know.

The Mechanics of the 529-to-Roth Rollover

If your child or grandchild finishes their education and still has money left in their 529 plan, you can transfer those funds into a Roth IRA in their name. The money moves from a tax-free education account to a tax-free retirement account without incurring taxes or penalties.

This is massive. A young adult starting their career with a jump-started Roth IRA has decades of tax-free compounding ahead of them.

The Rules of the Game (And There Are Several)

As with anything tax-related, the IRS has strict rules you must follow to execute this strategy cleanly:

  1. The $35,000 Lifetime Limit: You can only transfer a maximum of $35,000 during the beneficiary’s lifetime. This isn’t an unlimited backdoor.
  2. Annual IRA Contribution Limits Apply: You cannot move the entire $35,000 at once. The transfers are subject to the annual IRA contribution limits. For 2026, that limit is $7,500. It will take nearly five years to transfer the full $35,000.
  3. Earned Income Requirement: The beneficiary must have earned income (W-2 wages or self-employment income) in the year of the transfer, and the transfer amount cannot exceed their earned income for that year.
  4. The 15-Year Rule: The 529 plan must have been open for at least 15 years.
  5. The 5-Year Rule: Contributions (and the earnings on those contributions) made to the 529 plan in the five years prior to the rollover cannot be transferred.
  6. Direct Transfer: The rollover must be moved directly from the 529 plan to the Roth IRA (a trustee-to-trustee transfer). Do not cash out the 529 and try to deposit it into the Roth yourself.

Why This is a Game Changer

This legislation effectively removes the risk of “over-saving” for college.

  • Bypassing High-Income Limits: Even if your young adult child earns too much to contribute directly to a Roth IRA, they can still receive these 529-to-Roth transfers.
  • Decades of Tax-Free Growth: If you fund a Roth IRA with $7,500 a year from ages 22 to 26 (using leftover 529 funds) and never add another dime, that $35,000 could grow to several hundred thousand dollars of tax-free money by the time they reach retirement age.

What You Should Do Now

If you have an existing 529 plan, track its age. If you’ve been putting off opening a 529 because of overfunding fears, start one now to get the 15-year clock ticking.

Before executing a transfer, you should run the numbers and ensure all IRS criteria are met to avoid unexpected tax hits or state-level recapture rules (some states may treat the rollover as a non-qualified withdrawal).

Please comment or send an email if you have any questions.

Joe Baker, CFP®

Baker Asset Management, LLC

joebaker@bakerassetmanagement.com