
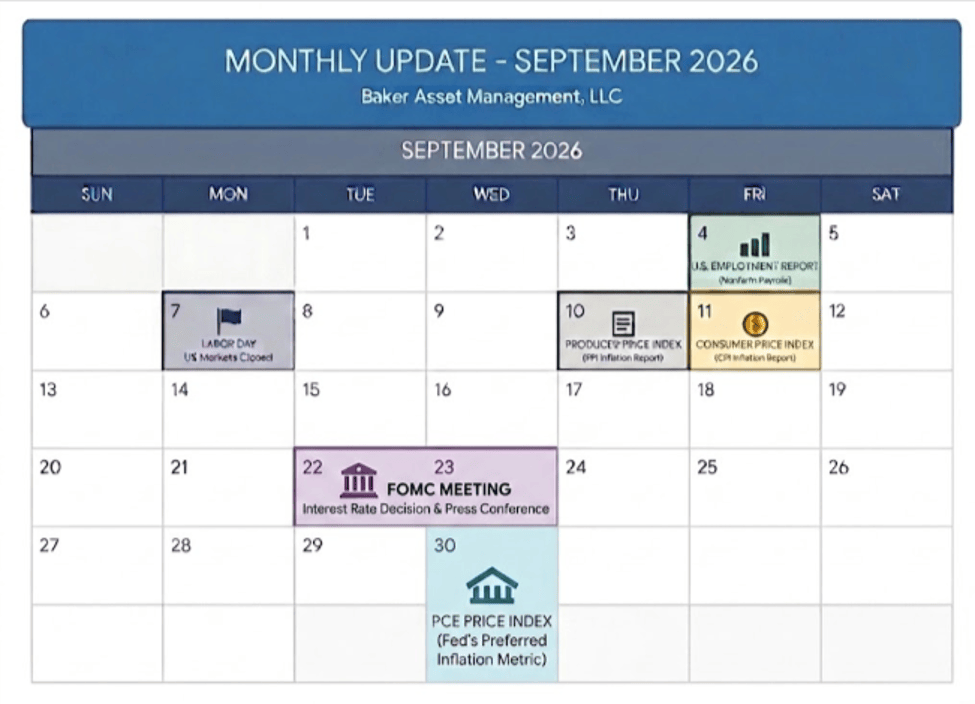
Calendar Notes
Market Overview: Stocks
Stocks navigated a volatile August, balancing persistent momentum in artificial intelligence infrastructure against hawkish monetary signals and elevated long-term borrowing costs. While corporate balance sheets remain fundamentally sound, macroeconomic headwinds continue to keep equity indices within a broader consolidated trading range.
For the month of August, the S&P 500 finished up 2.6%, easily besting its historical average of -0.01%. Year-to-date, the index is 12.3%. Tech sector leaders remain the core engine of market earnings, while broader index participation continues to adjust to delayed rate-cut expectations reinforced by Fed Chairman Kevin Warsh’s recent remarks at the Jackson Hole Economic Symposium.
On the fundamental side, mega-cap tech leaders continue to fund heavy capital expenditures directly out of robust free cash flow rather than short-term debt. Additionally, corporate bottom lines are continuing to absorb the liquidity windfall from cleared tariff refunds, providing a buffer against persistent input cost pressures.
From a seasonal perspective, September has historically been the most challenging month of the year for equities. Over the past 30 years, the S&P 500 has averaged a monthly return of approximately -0.70% in September, frequently characterized by increased institutional volume, portfolio rebalancing, and corporate guidance updates ahead of the fourth quarter. While seasonal trends suggest potential near-term choppy trading, long-term fundamentals remain intact. Count on an erratic month for stocks as traders and investors get back to work.
Near-Term Outlook: Expect increased volatility through September with heightened sensitivity to inflation prints, Fed policy communications, and ongoing geopolitical developments.
Take a look at the Outlook section below to see what events could move the markets over the short term.
Fixed Income & Bond Markets
Bond markets spent August parsing two contrasting forces: hawkish messaging from the Federal Reserve and strategic debt-management initiatives from the U.S. Treasury.
During his speech at the Jackson Hole Economic Symposium, Fed Chairman Kevin Warsh reiterated that the FOMC will maintain a restrictive policy stance as long as supply-driven inflation risks persist. In contrast, Treasury Secretary Scott Bessent outlined targeted adjustments to Treasury issuance—shifting a larger proportion of government borrowing into short-term bills to curb the supply of long-duration bonds. This strategy aims to suppress upward pressure on 10-year and 30-year yields, easing borrowing costs across the broader economy.
10-Year U.S. Treasury Note Yield: Finished August at 4.76% (compared to 4.75% in July).
30-Year U.S. Treasury Bond Yield: Closed August at 5.25% (compared to 5.28% in July).
I continue to monitor the High-Yield Credit Spread (HYCS), which finished August at 2.91%. With spreads hovering near extreme lows, credit markets continue to price in minimal economic distress. Given structural cost pressures and geopolitical risks, maintaining high credit quality in fixed-income allocations remains essential.
FOMC September Preview
The Federal Open Market Committee will convene for its next policy meeting on September 15–16, 2026, which will include an updated Summary of Economic Projections (SEP) and “Dot Plot.” The Fed is widely expected to maintain the target federal funds rate at 3.50%–3.75%. However, with hawkish dissents present at the July meeting and Chairman Warsh emphasizing inflation risks at Jackson Hole, policy rate cuts remain off the table for the remainder of 2026.
Fixed Income Strategy
Given elevated short-term interest rates, investors should continue to have a disciplined focus on short-duration assets. Continue to allocate capital toward high-grade, short-term Treasuries and FDIC-insured bank CDs with maturities under two years, capturing yields in the 4%+ range while shielding portfolios from duration-driven price volatility.
Savings Rates
Yields on liquid cash holdings remained strong throughout August, supported by the Federal Reserve’s steady federal funds rate. A substantial yield gap persists between traditional brick-and-mortar institutions and competitive online banking platforms.
| Account Type | Average Rate (APY) | Highest Rate (APY) |
| Money Market Account | 0.45% | 3.90% |
| High-Yield Savings Account | 0.62% | 4.15% |
| 1-Year CD | 2.03% | 4.30% |
| 3-Year CD | 1.69% | 4.35% |
| 5-Year CD | 1.74% | 4.35% |
Total assets in U.S. money market funds remain near historic levels in the $7.85 trillion range. Cash reserves are expected to stay elevated until short-term yields undergo a sustained decline. Certificates of deposit (CDs) and High-Yield Savings Accounts (HYSAs) remain practical instruments for maintaining liquid emergency funds. Please ensure total deposits at any single banking institution stay within the $250,000 per-person threshold for full FDIC protection.
Mortgage & Housing Market
Mortgage rates showed signs of stabilization in August as markets evaluated Treasury Secretary Scott Bessent’s efforts to moderate long-term benchmark yields. While lower long-term yields help cap mortgage rate spikes, homebuying activity remains constrained by structural affordability challenges.
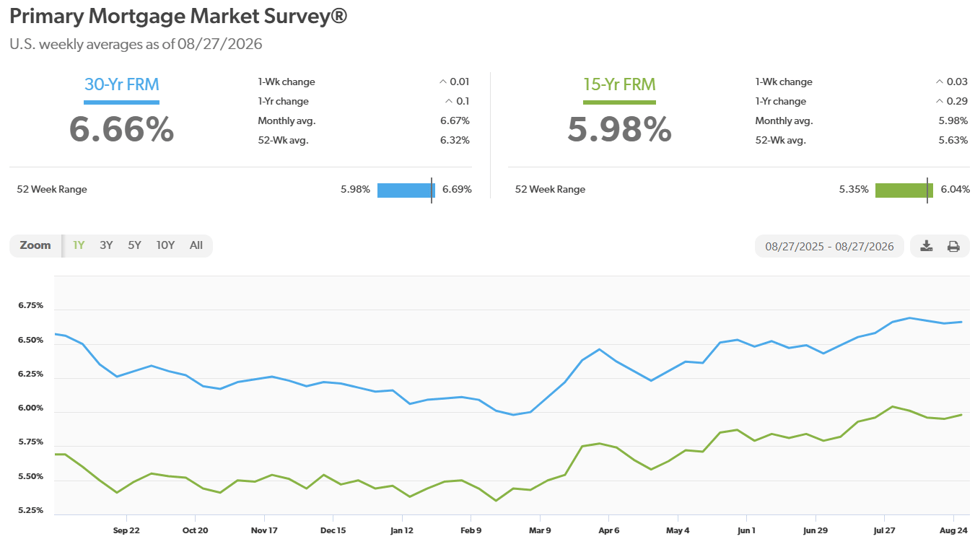
According to Freddie Mac, the 30-year fixed-rate mortgage averaged 6.66% in late August, same as July. The 15-year fixed-rate mortgage averaged 5.98%, down slightly from 6.04% last month. Moving into September, residential borrowing rates are anticipated to fluctuate between 6.40% and 6.75%, with expanding housing inventory offering buyers relatively more selection than in prior seasons.
Here is a look at the one-year chart of the 15- and 30-year mortgage rates from Freddie Mac.
Energy Markets
Crude oil benchmarks experienced continued volatility in August as geopolitical bottlenecks remained unmitigated in the Middle East. With commercial shipping through the Strait of Hormuz remaining severely restricted and war-risk transit surcharges elevated, structural supply constraints continue to embed a persistent geopolitical premium into global energy pricing.
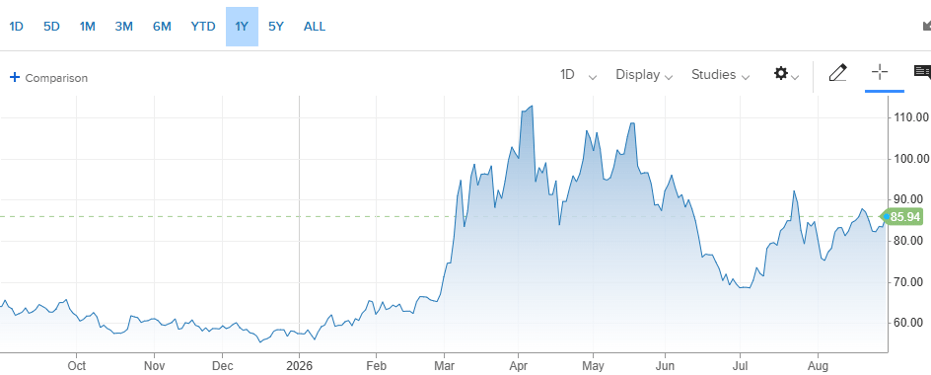
- WTI Crude Settlement: West Texas Intermediate (WTI) crude settled August at $85.94 per barrel (compared to $84.81 in July).
- Year-to-Date Performance: WTI is currently up 50% for 2026.
A key development in energy markets this month was the announcement of a strategic Venezuelan oil deal, paving the way for incremental crude exports to re-enter global distribution channels. However, it is not expected to have any impact on oil prices for several years due to the extensive infrastructure upgrades required to extract and refine these oil reserves. Regardless, overall energy overhead remains elevated due to geopolitical risk premiums and war-risk shipping insurance.
Here’s a look at the one-year chart for U.S. oil:
Retail gasoline prices experienced modest fluctuations throughout August as the peak summer driving season drew to a close. While news of additional heavy crude exports from the newly announced Venezuelan oil deal provided brief sentiment relief, underlying fuel costs remained underpinned by persistent transit restrictions through the Strait of Hormuz and elevated refining surcharges. High pump prices continue to act as a direct drag on consumer discretionary budgets while keeping logistics and delivery overhead elevated for small business owners heading into autumn.
The national average for a gallon of regular unleaded closed out August at $4.08, compared to the $4.11 average recorded at the end of July. Indiana currently holds the lowest gasoline average in the nation at $3.39 per gallon, while California remains the most expensive at $5.69 per gallon. By comparison, drivers were paying an average of $3.19 per gallon one year ago. As driving demand seasonally tapers into the fall shoulder season, retail prices may see incremental relief, though ongoing geopolitical chokepoints will likely maintain an elevated floor under fuel costs.
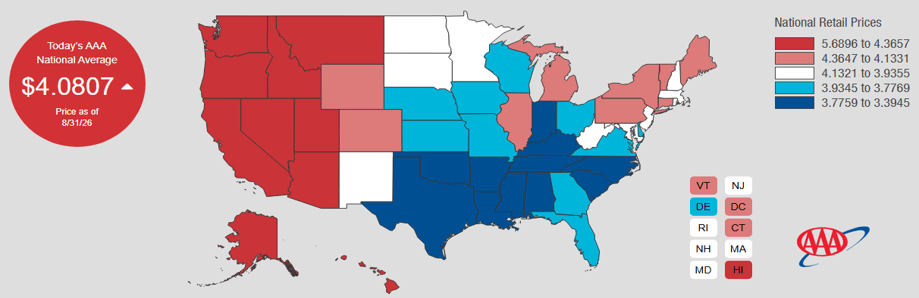
Check out the prices at the pump in your area: AAA Gas Prices.
Outlook
Events on the horizon that could move the markets in the near term:
- Fed Policy & Jackson Hole Insights: At the Jackson Hole Economic Symposium, Chairman Kevin Warsh emphasized that monetary policy must remain firm to prevent supply-side inflation from becoming embedded in long-term expectations. The Fed’s policy stance remains firmly focused on inflation control, keeping rate-cut expectations sidelined. This hawkish monetary stance puts near-term downward pressure on stock valuations while driving benchmark bond yields higher and bond prices lower.
- Treasury Yield Curve Management: Treasury Secretary Scott Bessent’s initiative to shorten average Treasury issuance maturities aims to lower long-term interest rates by reducing long-bond supply. If effective, this strategy could help stabilize mortgage rates and corporate debt financing costs even while the Fed maintains high short-term policy rates. Capping long-term yield spikes provides a supportive tailwind for stock valuations and supports long-duration bond prices.
- Trade Tariffs & Goods Inflation: Administrative tariff measures continue to escalate trade friction across key trade partners. Section 338 tariffs on targeted Canadian imports have reached up to 50% across key product categories, while combined Section 301 tariffs on Brazil have reached 37.5%. Cumulative Section 301 tariffs on Chinese imports remain heavy at 25% to 50% across industrial sectors. While Supreme Court-mandated duty refunds provide balance sheet relief for specific U.S. importers, these broad trade barriers continue to filter into consumer prices, adding an estimated 3.1% to core goods PCE inflation. Elevated tariff surcharges hurt corporate profits and eventually stock prices while feeding inflation that hurts consumer demand and drags bond prices lower.
- Middle East Conflict & Energy Supply: The ongoing war involving Iran and restricted commercial transit through the Strait of Hormuz continue to embed a heavy risk premium into global energy pricing and freight surcharges. Near-term equity performance remains exceptionally sensitive to geopolitical developments in the region. Further military escalation or expanded shipping disruptions will push crude costs higher and drive stock prices lower, whereas a diplomatic breakthrough or guaranteed safe maritime transit would dismantle the energy risk premium and drive stock prices higher. Right now, it looks like escalation is the path of least resistance.
Please comment or send an email if you have any questions.
Joe Baker, CFP®
Baker Asset Management, LLC
joebaker@bakerassetmanagement.com

