
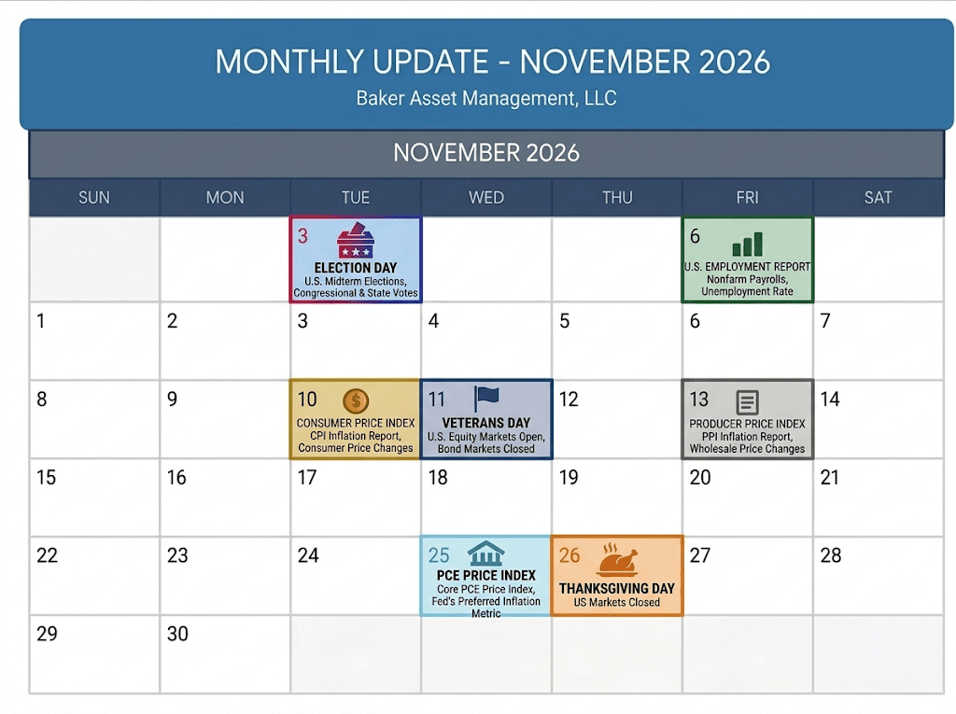
Calendar Notes
- Tuesday, November 3: Election Day (U.S. Midterm Elections, Congressional & State Votes)
- Thursday, November 26: Thanksgiving Day (U.S. Markets Closed)
- Friday, November 27: Day After Thanksgiving (Black Friday) Markets close at 1pm ET.
Market Overview: Stocks
Stocks were looking to finish positive for the month of October but uncertainty took over and slammed the S&P 500 down in October’s final week to end the month in the red. Rising inflation, a costly war, more tariffs, AI build out spending, and the upcoming elections were too much to overcome for the index this past month. The biggest drag on stocks recently has been the ongoing Iran war, which continues to hurt the U.S. and world economies. This geopolitical conflict is persistently raising prices across the globe for nearly everything that transits the Strait of Hormuz and anything that relies heavily on fossil fuels to move those products.
For the month of October, the S&P 500 finished down 0.93%, below its historical 30-year average of about 2%. Year-to-date, the index is up 10.04%, still on track for a fourth straight year of double-digit gains.
Third-quarter earnings have been a mixed bag. Energy and health care have outperformed but uncertainty in the AI trade is growing and has sparked a selloff. The central debate is how AI infrastructure spending is being funded and whether it is paying off. Many investors are opting to sell now and ask questions later.
Near-Term Outlook: Over the last 30 years, November has been the best performing month out of the year for the S&P 500 index, averaging about 2.60%. Also, this November opens with the Nov. 3rd midterm elections. It just so happens that the S&P 500 was higher 12 months after Election Day in every midterm cycle since 1990, including all seven since 1998. So, it looks like investors have history on their side in the near term. Past performance aside, expect sensitivity to oil prices, inflation data, remaining earnings guidance, AI-spending scrutiny, and election results to steer stock prices in November.
Take a look at the Outlook section below for more details on what events could move the markets over the short term.
Fixed Income Markets
Bond markets spent October digesting the FOMC’s hawkish pause and persistent inflationary pressures stemming from the Middle East. With energy and shipping costs acting as a headwind, Treasury yields remained elevated as investors absorbed the reality that interest rates will likely remain higher through the end of the year.
- 10-Year U.S. Treasury Note Yield: Finished October at 4.93% (compared to 5.23% in September).
- 30-Year U.S. Treasury Bond Yield: Closed October at 5.31% (compared to 5.63% in September).
- High-Yield Credit Spread (HYCS): Finished October at 3.14% (compared to 3.02% in September).
While credit markets continue to price in minimal systemic distress, the recent widening of the High-Yield Credit Spread—which measures the premium investors demand to hold junk bonds over “risk-free” Treasuries—signals expanding risk premiums as markets absorb sticky inflation, elevated fuel costs, and hawkish Fed policy. As this spread widens, it generally puts downward pressure on bond prices (as higher yields are required to attract buyers) and can act as a headwind for stock valuations, signaling cautious investor sentiment and higher borrowing costs for corporations.
FOMC Update
Following the Federal Open Market Committee meeting last week, the committee decided to hold the target range for the federal funds rate steady at 3.75% to 4.00%. The central bank noted that economic activity and consumer spending remain robust, and job gains have kept pace with the workforce. However, inflation remains stubbornly elevated due to geopolitical developments, energy costs, tariffs, and AI industry demand. Given these conditions, the trajectory for interest rates through the end of the year leans firmly toward “higher for longer,” with the Fed leaving the door open for a potential hike if price pressures do not subside.
Fixed Income Strategy
Given elevated short-term interest rates, investors should maintain a disciplined focus on short-duration assets. Consider allocating maturing capital toward high-grade, short-term Treasuries and FDIC-insured bank CDs with maturities under three years, securing yields in the 4.35% to 4.95% range while shielding portfolios from duration-driven price volatility. Recommend holding until maturity to ensure full return of principal.
Tax Efficiency Note: Short-term U.S. Treasuries carry a distinct structural advantage over traditional bank CDs and money market accounts. Interest earned on U.S. Treasury securities is completely exempt from state and local income taxes across all states, delivering a superior net after-tax yield for clients in tax-paying states compared to standard bank products.
Savings Rates
Following recent Fed actions, yields on short-term liquid reserves remain highly attractive. A substantial yield gap still persists between traditional brick-and-mortar institutions and competitive online banking platforms.
| Account Type | Average Rate (APY) | Highest Rate (APY) |
| Money Market Account | 0.63% | 5.00% |
| High-Yield Savings Account | 1.62% | 5.00% |
| 1-Year CD | 1.76% | 4.60% |
| 3-Year CD | 1.39% | 4.85% |
| 5-Year CD | 1.41% | 5.09% |
Total assets in U.S. money market funds continue to remain high. Please ensure total deposits at any single banking institution stay within the $250,000 per-person threshold for full FDIC protection.
Mortgage & Housing Market
Mortgage rates trended upward once again in October as bond markets reacted to rising inflation and persistent long-term yield pressures.
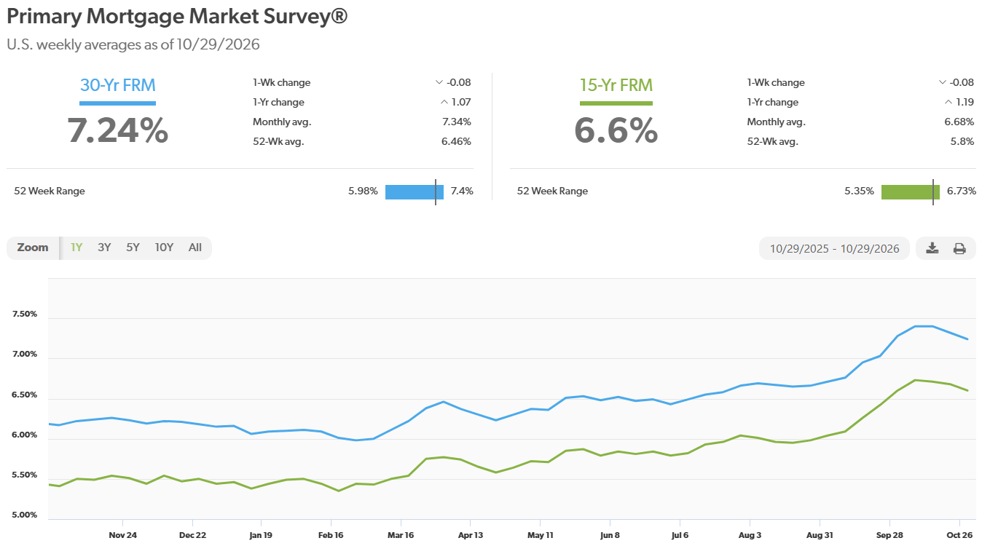
According to Freddie Mac, the 30-year fixed-rate mortgage averaged 7.24% in late October, up from 7.03% recorded at the end of September. The 15-year fixed-rate mortgage averaged 6.60%, up from 6.42% last month. Moving into November, residential borrowing rates are anticipated to fluctuate within this elevated mid-to-upper 6% or 7% range, with actual mortgage pricing sensitive to the Federal Reserve’s “higher for longer” stance. Structural affordability challenges continue to constrain overall transaction volume, and meaningful improvement in rates for the remainder of the year would require a substantial cooling in inflation and a decline in longer-term Treasury yields.
Here is a look at the one-year chart of the 15- and 30-year mortgage rates from Freddie Mac.
Energy Markets
Crude oil benchmarks experienced continued pressure in October as the ongoing Iran war persists. The conflict has severely restricted commercial shipping through the Strait of Hormuz, driving up war-risk transit surcharges. These constraints raise prices across the globe for nearly everything that transits this vital chokepoint and utilizes fossil fuels for transport.
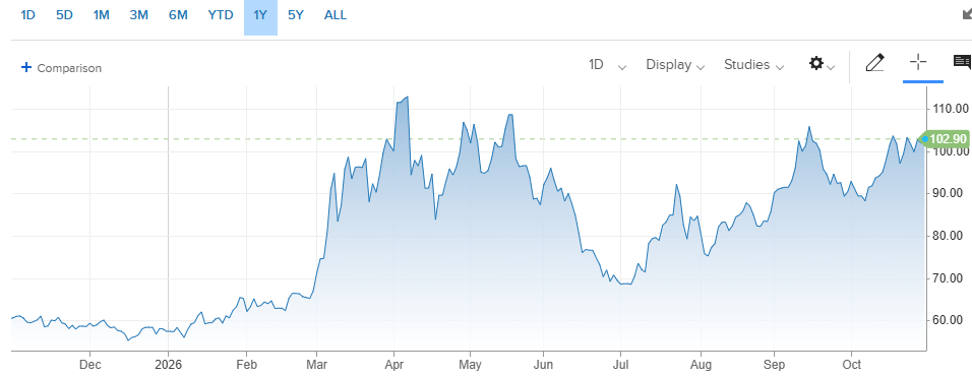
- WTI Crude Settlement: West Texas Intermediate (WTI) crude settled September at $102.90 per barrel (compared to $90.55 in September).
- Year-to-Date Performance: WTI is now up 82% for 2026.
Here is a look at the one-year chart for U.S. oil:
Retail gasoline provided some modest relief in October. This decrease was primarily driven by the seasonal transition to cheaper winter-blend gasoline and a slight dip in driving demand. However, further declines will be sharply limited in the short term. With crude oil prices persistently hovering near or above $100 a barrel due to geopolitical bottlenecks, and winter heating oil demand about to compete heavily with gasoline and diesel for refinery output, expect fuel costs to remain elevated as we close out the year.
The national average for a gallon of regular unleaded closed out October at $4.20, compared to the $4.43 average recorded at the end of September. Also, diesel has come down about $0.20 per gallon from its record high. North Carolina currently holds the lowest gasoline average in the nation at $3.41 per gallon, while California remains the most expensive at $5.93 per gallon. For comparison, drivers were paying an average of $3.04 per gallon one year ago.
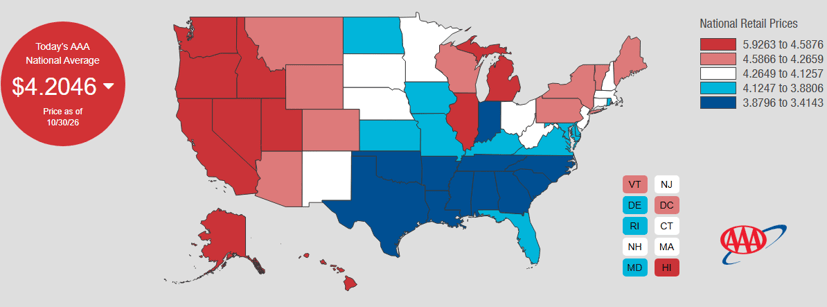
Check out the prices at the pump in your area: AAA Gas Prices.
Outlook
Events on the horizon that could move the markets in the near term:
- Upcoming Election Consequences & Seasonal Trends: Financial markets have navigated pre-election policy uncertainty throughout October. With the midterms just days away, expect short-term volatility. History still favors the months after midterms: the S&P 500 was higher 12 months after Election Day in every cycle since 1990, including all seven since 1998. Regardless, expect some wild fluctuations in the markets until the dust settles on election results.
- FOMC Policy, Inflation & Interest Rates: Following the Fed’s October 27-28 decision to hold rates at 3.75%-4.00%, the trajectory for interest rates remains higher for longer. Recent CPI data (headline inflation at 3.6%, core at 2.5%) proved sticky. With the 10-year Treasury yield still near 5%, we are reaching a threshold where elevated yields actively compete with equities for capital flows – short term negative catalyst for stocks.
- Geopolitics, Tariffs & Supply Chains: The ongoing Iran war and restricted transit through the Strait of Hormuz continue to embed a heavy risk premium into global energy pricing. Furthermore, rising global tensions and expanding tariffs are spurring a shift toward economic fragmentation. Policymakers worldwide are prioritizing domestic production over global integration, causing supply chain pressures to spike once again. To summarize, the war and tariffs will continue to be a dark cloud hanging over the markets.
Please comment or send an email if you have any questions.
Joe Baker, CFP®
Baker Asset Management, LLC
joebaker@bakerassetmanagement.com

