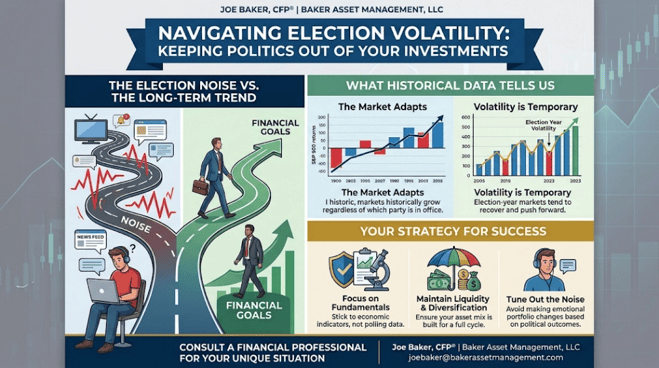
Navigating Election Volatility: Keeping Politics Out of Your Investments

Dovetailing from my most recent blog post, The Post-Midterm Rally: 19 for 19, But This Time Has Real Headwinds, I want to explore the psychological side of the political cycle. In that post, we looked at the incredible historical streak of market rebounds after midterm elections, alongside the unique economic challenges we are facing today. But while history is on our side, getting through the election season itself is often easier said than done, especially with the 2026 midterm elections fast approaching. The news cycle is becoming increasingly loud, polarized, and—for many people—a bit stressful. Every day brings a new round of polls, debates, and dramatic predictions about what the future holds depending on which party gains control.

When the political temperature rises, it is entirely natural to feel a sense of urgency. However, as an investor, one of the most critical challenges you will face over the coming months is a simple one: keeping your political beliefs separate from your investment strategy.

To help you keep a steady hand through this election cycle, let’s explore why elections cause so much noise, what history actually tells us about markets and politics, and some practical strategies for staying on track.

1. The Election Noise vs. The Long-Term Trend

It is easy to fall into the trap of thinking that a specific election outcome will either “save” or “ruining” the economy. The media often amplifies this narrative, framing every legislative shift as a make-or-break moment for your portfolio.

But there is a vast difference between the chaotic “noise” of an election season and the long-term trend of the stock market.

While elections can introduce short-term volatility as the market tries to predict future policies, the long-term trajectory of the S&P 500 is driven by far more powerful forces:

  • Corporate Earnings: The profitability and innovation of American businesses.
  • Economic Fundamentals: Interest rates, consumer spending, inflation, and employment data.
  • Global Progress: Advancements in technology and productivity.

A political party winning or losing an election doesn’t rewrite the fundamental rules of the global economy. Good businesses continue to find ways to generate profit, innovate, and provide value to their shareholders regardless of who holds the gavel in Washington.

2. What Historical Data Tells Us

When we look back at decades of market history, several clear patterns emerge that should reassure anxious investors:

The Market Adapts (Regardless of the Party in Power)

A common misconception is that the stock market only performs well when one specific party is in office. But history tells a very different story.

The S&P 500 has historically grown under all combinations of government—whether we have a Democratic president, a Republican president, a divided Congress, or single-party control. Since World War II, the market’s long-term upward trend has remained remarkably consistent, adapting to different administrations and regulatory environments.

Volatility Is Temporary

Midterm election years (like 2026) are historically known for higher-than-average market volatility, particularly in the months leading up to November. The uncertainty of who will hold power can cause the market to fluctuate.

However, once the results are in—regardless of which party wins—the uncertainty resolves itself. Historically, the market tends to experience a post-election “certainty bounce,” often rallying in the months following a midterm election as businesses and investors adjust to the known landscape.

3. Your Strategy for Success

How do you navigate this polarized environment without letting it affect your hard-earned savings? Here are three strategies to focus on:

Focus on Fundamentals

When evaluating your portfolio, rely on economic indicators, corporate earnings, and interest rates—not polling data. Let the math, not your political opinions, guide your asset allocation.

Maintain Liquidity and Diversification

If you know you will need cash in the near term, ensure you have an adequate liquidity buffer (such as high-yield savings or short-term CDs) so you are never forced to sell stocks during a temporary, election-induced dip. Make sure your portfolio is diversified across different asset classes to smooth out any bumps.

Tune Out the Noise

The single best thing you can do for your portfolio (and your peace of mind) during an election year is to limit your consumption of sensationalized news. Avoid making emotional, impulse changes to your investment plan based on political headlines or debate outcomes.

The Bottom Line

An election is a major event for our country, but it is just one of many events that the stock market encounters and adapts to over time. Your investment plan should be built to withstand a full market cycle—which includes several election cycles.

Please comment or send an email if you have any questions.

Joe Baker, CFP®

Baker Asset Management, LLC

joebaker@bakerassetmanagement.com

The IPO Reality Check: What History Tells Us About Post-Debut Performance

Just ran some numbers on historical initial public offerings (IPOs) to provide a data-driven perspective on what the future might hold for highly anticipated market debuts like SpaceX, OpenAI, and Anthropic. While the media buzz surrounding mega-tech listings often generates massive retail excitement, the historical data over the last 25 years tells a much more cautious story for the 12 months following a company’s public debut.

Data-Driven Insights: The 12-Month Post-IPO Track Record

When evaluating historical IPO performance over the past two and a half decades, the data consistently refutes the myth of guaranteed first-year gains. Financial studies reveal several critical trends regarding how companies perform in the 365 days after hitting the public markets:

  • The “First-Day Pop” vs. Long-Term Reality: Historically, IPOs are known for significant first-day underpricing, giving early institutional investors an average initial “pop” of roughly 15% (Lowry et al., 2017). However, for everyday investors buying shares on the open market after day one, the subsequent 12 months frequently see a reversal of fortune.
  • Systemic Underperformance: Extensive long-run historical data indicates that, on average, IPOs tend to underperform broad market benchmarks—such as the S&P 500 or industry-specific indices—during their first one to three years (Ang et al., 2006).
  • The Size and Age Factors: Performance varies wildly based on a company’s maturity at the time of the listing. Smaller, younger startups exhibit severe average underperformance, with cumulative average abnormal returns dropping significantly in the first year (Siev & Qadan, 2022). Conversely, large, heavily capitalized, and older firms tend to manage the transition to public markets with far less volatility, though they still frequently lag behind established market peers in the short term (Siev & Qadan, 2022).
  • The “Star Performer” Statistical Outliers: The broader average of IPO performance is heavily weighed down by a high failure rate. Statistically, the vast majority of IPOs underperform, while the overall asset class is propped up by a tiny minority (roughly 2%) of “star performers” that achieve monumental returns (Ang et al., 2006).

What This Means for upcoming IPOs such as SpaceX, OpenAI, and Anthropic:

Applying this decision-making framework to the dominant tech private giants of today yields specific strategic takeaways:

Risk & Valuation VariableStrategic Application to Upcoming Mega-Tech IPOs
Institutional MaturityUnlike the speculative tech listings of the 1999–2000 dot-com bubble, firms like SpaceX, OpenAI, and Anthropic will enter the public markets as massive, heavily capitalized enterprises with massive global footprints. According to historical trends, their large size and operational age should structurally protect them from the extreme 40%+ drop-offs seen in smaller, speculative IPOs (Siev & Qadan, 2022).
The Hype PremiumBecause these brands carry unprecedented cultural and technological visibility, their IPOs will likely face intense public demand. This historically leads to severe initial underpricing (to benefit institutional insiders) followed by a retail-driven valuation peak on day one, which frequently leads to a cooling-off period and negative market-adjusted returns over the subsequent 12 months.
The “Long Shot” BetInvestors backing OpenAI or Anthropic are implicitly betting that these firms will become the absolute “star outliers” of the decade (Ang et al., 2006). While the historical probability of any random IPO becoming a permanent market leader is low, companies with profound structural moats stand the best statistical chance of breaking the traditional 12-month underperformance trend.

The historical data over the last 25 years sends a clear warning to investors: buying into the immediate 12-month aftermath of a high-profile tech IPO is statistically a losing proposition compared to holding a broad-market index. While mega-cap innovators like SpaceX or OpenAI possess the scale to avoid the catastrophic first-year collapses of smaller startups, history dictates that the safest, most optimized administrative path for retail capital is often patience—waiting for the initial regulatory, insider lockup, and hype cycles to clear before establishing a long-term position.

Please comment or send an email if you have any questions.

Joe Baker, CFP®

Baker Asset Management, LLC

joebaker@bakerassetmanagement.com

References

Ang, A., Gu, L., & Hochberg, Y. V. (2006). Is IPO underperformance a peso problem? National Bureau of Economic Research. https://doi.org/10.3386/w12203

Cited by: 81

Lowry, M., Michaely, R., & Volkova, E. (2017). Initial Public Offerings: A synthesis of the literature and directions for future research. Foundations and Trends® in Finance, 11(3-4), 154-320. https://doi.org/10.1561/0500000050

Cited by: 334

Siev, S., & Qadan, M. (2022). Call me when you grow up: Firms’ age, size, and IPO performance across sectors. Journal of Risk and Financial Management, 15(12), 586. https://doi.org/10.3390/jrfm15120586

Cited by: 19

Beyond the Beach: Why “Sell in May and Go Away” Is a Costly Myth

Beyond the Beach: Why “Sell in May and Go Away” Is a Costly Myth

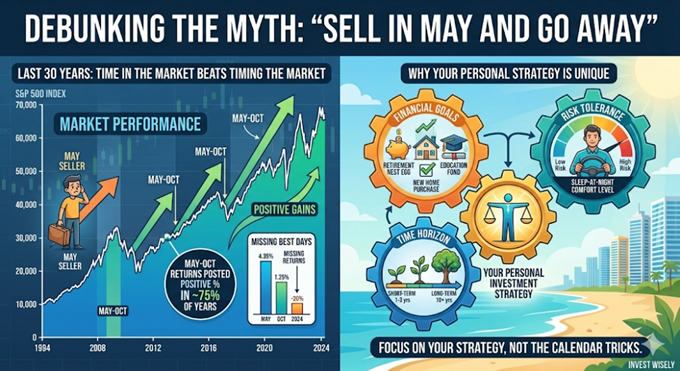
Every spring, Wall Street dusts off one of its oldest and most repeated clichés: “Sell in May and go away.” The theory goes that stock market returns are historically dismal between May and October, so you should cash out, enjoy your summer at the beach, and reinvest in November. It sounds cozy, low-stress, and delightfully simple.

There’s just one glaring problem: Over the last 30 years, following this advice would have cost you a fortune.

Let’s unpack why this old adage has broken down, and why a cookie-cutter calendar trick is no substitute for a personalized investment strategy.

The Reality Check: The Last 30 Years

The idea of the “summer doldrums” used to hold some weight decades ago when trading volume slowed to a crawl during vacation season. But the modern financial world doesn’t take a summer vacation.

If you actually “went away” every May over the last three decades, you would have missed out on massive market gains.

1. Positive Returns Are the Norm, Not the Exception

While it’s true that the winter months (November to April) have historically shown stronger average gains, the May-to-October period has still been overwhelmingly positive. Over the last 30 years, the S&P 500 has posted positive returns during the summer/fall block roughly 70% to 80% of the time. By sitting on the sidelines, you aren’t avoiding a crash; you’re usually just missing a rally.

2. The Cost of Missing the “Best Days”

Market gains are often concentrated in a few explosive days. If you are sitting in cash, missing just a handful of the market’s best days can permanently stunt your portfolio’s compounding growth.

3. Frictional Costs Eat Your Wealth

Every time you sell and buy back in, you trigger a chain reaction of wealth-killers:

  • Taxes: If you operate in a taxable account, selling every May triggers short-term capital gains taxes, which are taxed at a much higher rate than long-term gains.
  • Transaction Costs: Even in an era of zero-commission trades, bid-ask spreads can quietly chip away at your principal.

The Bottom Line: Trying to time the market based on a calendar rhyme is a losing game. As the legendary investor Peter Lynch once said, “Far more money has been lost by investors preparing for corrections, or trying to anticipate corrections, than has been lost in corrections themselves.”

Why “One-Size-Fits-All” Strategies Fail You

The biggest flaw in “Sell in May” isn’t just the math—it’s that it treats every investor like a monolith. Wall Street clichés assume everyone has the exact same bank account, the same nerves, and the same expiration date.

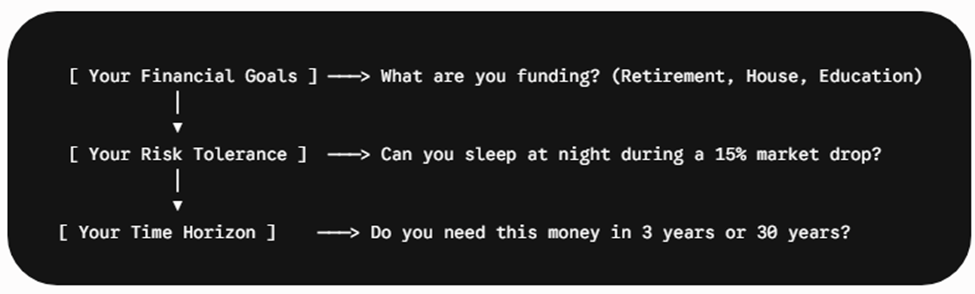
In reality, successful investing requires a strategy tailored uniquely to you across three critical pillars:

1. Your Unique Financial Goals

Are you investing to buy a house in three years, or are you building a nest egg for a retirement that is three decades away? A 25-year-old building long-term wealth shouldn’t care about a minor summer dip. A 63-year-old nearing retirement might need a smoother ride—but they achieve that through a balanced asset allocation (stocks, bonds, cash equivalents), not by completely exiting the stock market every May.

2. Your Personal Risk Tolerance

Risk tolerance isn’t just a math problem; it’s a psychological one. If selling in May makes you feel safe, but causes you to panic-buy back in at higher prices in November, the strategy has failed your psychology. A personalized portfolio is designed to keep you comfortably invested through all seasons, preventing the emotional decisions that derail wealth.

3. Your Time Horizon

Time is the ultimate equalizer in investing. If your time horizon is long, the seasonal squiggles of the stock market become irrelevant background noise. The historical data proves that time in the market beats timing the market every single time.

Focus on Your Blueprint, Not the Calendar

The next time you see a financial news headline warning you to “Sell in May,” turn off the TV and check in on your personal financial plan instead.

Market myths make for great headlines, but personalized strategies build generational wealth. Stick to your goals, respect your time horizon, and leave the calendar tricks behind. Your future self will thank you.

Please comment or send an email if you have any questions.

Joe Baker, CFP®

Baker Asset Management, LLC

joebaker@bakerassetmanagement.com
The Big Three: Which Market Pulse Actually Matters for Your Portfolio?

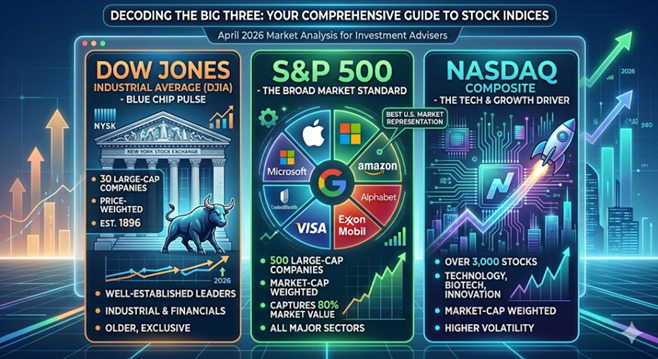
We’ve all seen the tickers scrolling at the bottom of the news screen: the Dow is up 200 points, the NASDAQ is flat, and the S&P 500 is hitting another record high. But for most investors, those numbers are just noise without context. It’s easy to treat “the market” as one giant, monolithic entity, but the truth is that these three indices are built differently, behave differently, and tell very different stories about your money. Today, we’re peeling back the curtain on the “Big Three” to see what’s actually under the hood—and which one you should actually be watching.

1. The Dow Jones Industrial Average (DJIA)

Commonly referred to as “The Dow”, this is the oldest and most “exclusive” of the three.

  • Composition: It consists of just 30 “blue-chip” companies. These are massive, well-established leaders in their respective industries (think Apple, UnitedHealth, and Goldman Sachs). Despite its name, it is no longer just “industrial”; it covers healthcare, tech, and financial services.
  • Calculation: The Dow is price weighted. This means the index is calculated by adding up the share prices of all 30 stocks and dividing by the “Dow Divisor” — a number that adjusts for stock splits and corporate changes.
  • The Quirk: Because it’s price-weighted, a stock with a $500 share price has a much bigger impact on the Dow than a stock with a $50 share price, regardless of the actual size of the company.

2. The S&P 500

The Standard & Poor’s 500 is widely considered the gold standard for institutional investors and professionals.

  • Composition: It tracks 500 of the largest publicly traded companies in the U.S. across 11 major sectors. To be included, companies must meet strict liquidity and profitability requirements.
  • Calculation: It is market-cap weighted (specifically, float-adjusted). The larger the company’s total market value, the more influence it has on the index.
  • The Reality: In 2026, the S&P 500 remains heavily influenced by the “Magnificent Seven” and other mega-cap tech giants, which account for a significant portion of its total movement.

3. The NASDAQ Composite

If the Dow is the “old guard” and the S&P is the “whole market,” the NASDAQ is the “innovator.”

  • Composition: This index includes over 3,000 stocks listed on the Nasdaq exchange. It is heavily concentrated in technology, biotechnology, and growth-oriented sectors. Notably, it excludes financial companies (unlike the S&P 500).
  • Calculation: Like the S&P 500, it is market-cap weighted.
  • The Role: Investors look to the NASDAQ as a barometer for the “risk-on” sentiment. When tech is booming, the NASDAQ leads the way; when interest rates rise and growth slows, it often takes the hardest hit.

Which One Represents the U.S. Market Best?

While the Dow gets the most TV time, the S&P 500 is the most accurate representation of the U.S. stock market.

FeatureDow JonesS&P 500NASDAQ
DiversityLow (30 stocks)High (500 stocks)Specialized (3,000+ stocks)
WeightingStock PriceMarket CapMarket Cap
Industry BiasBalanced/MatureBroad MarketTech / Growth
Who uses it?General PublicFund ManagersTech Investors

Why the S&P wins: The S&P 500 captures approximately 80% of the total available market value in the U.S. Its market-cap weighting ensures that we are looking at the actual economic footprint of these companies rather than just their arbitrary share price.


At the end of the day, these indices are more than just numbers on a screen; they are the tools we use to measure the temperature of the American economy. While the Dow offers a snapshot of blue-chip stability and the NASDAQ captures the high-voltage energy of the tech sector, the S&P 500 remains the most reliable compass for your long-term financial journey. By understanding how these benchmarks are constructed, you can move past the daily headlines and focus on what truly drives wealth: a disciplined, diversified strategy that looks at the big picture rather than just the daily ticker.

Investor Note: Always keep in mind that all three of these indices are comprised of 100% stock. Your portfolio most likely is a mix of stocks, bonds, commodities, and real estate so consider that when comparing your investment accounts to any of these indices.

Please comment or send an email if you have any questions.

Joe Baker, CFP®

Baker Asset Management, LLC

joebaker@bakerassetmanagement.com
Investing in the $630 Billion Race to Power AI

We often think of Artificial Intelligence as something ethereal—code floating in the “cloud.” But the reality of 2026 is grounded in steel, concrete, and energy supply. With Big Tech “hyperscalers” like Microsoft, Amazon, Meta, and Google projected to spend between $600 and $650 billion this year alone on infrastructure, we are witnessing an industrial buildout that economists argue now rivals the railroad expansion of the 1850s. While the first phase of the AI revolution was defined by who could design the smartest chip, the next phase will be defined by who can physically power it. The opportunity for investors is no longer just about the model; it is about the massive machine required to run it.

What is an AI Data Center?

Unlike traditional data centers that store files and run websites, AI data centers are designed for massively parallel computing. This creates unprecedented heat and power density. (Geek alert) While a standard server rack consumes 5–10 kW, a modern rack equipped with NVIDIA Blackwell or H100 GPUs demands 40 kW to over 100 kW. This physical constraint is forcing a complete redesign of the data centers needed in the AI world.

The Builders & Locations

The build-out is led by the “Hyperscalers”—Microsoft, Amazon (AWS), Google, and Meta—who are racing to secure land and power. Because these facilities consume gigawatts of electricity (enough to power small cities), they are moving away from congested hubs like Northern Virginia to regions with available power and land.

  • The Power Belt (Ohio, Indiana, Midwest): Emerging as a prime location due to grid capacity and land availability.
  • Texas: Attracting massive investment due to its independent energy grid and renewable abundance.
  • Nuclear Sites: Data centers are increasingly being built “behind the meter” at nuclear plants (e.g., Pennsylvania) to guarantee 24/7 zero-carbon power.

Investment Opportunities: The “Picks & Shovels”

Investors are looking beyond the chipmakers to the companies building the physical infrastructure. This includes thermal management (cooling), power distribution, and real estate.

TickerCompanyPrimary RoleInvestment Thesis
VRTVertiv HoldingsLiquid CoolingMarket leader in thermal management; essential for cooling NVIDIA’s hot chips.
ETNEaton CorpPower MgmtCritical electrical infrastructure (transformers, switchgear) for grid upgrades.
CEGConstellation EnergyNuclear PowerOwner of largest US nuclear fleet; prime partner for baseload AI power deals.
DLRDigital RealtyData Center REITGlobal landlord for data centers with strong hyperscaler relationships.
MODModine MfgThermal SystemsPivot from automotive cooling to high-growth data center thermal solutions.
ANETArista NetworksAI NetworkingProvides the ultra-fast ethernet switches needed to connect GPU clusters.

Investment Note: This list is for informational purposes only and does not constitute financial advice. Stocks in this sector, particularly pure plays like Vertiv, have seen significant volatility.


As the AI race accelerates, the primary bottleneck has shifted from silicon availability to energy reliability. With modern GPU racks consuming over 100 kW of power—ten times the standard of a decade ago—the digital economy is colliding with the physical limits of the power grid. For the astute investor, this signals a clear pivot: the most durable long-term value may not be found in the volatile software wars, but in the “picks and shovels” of the infrastructure supply chain—the liquid cooling systems, the copper interconnects, and the baseload nuclear power that keep the lights on. The code is written, but the concrete is just beginning to pour.

Please comment or send an email if you have any questions.

Joe Baker, CFP®

Baker Asset Management, LLC

joebaker@bakerassetmanagement.com

The Pros and Cons of a K-Shaped Economy

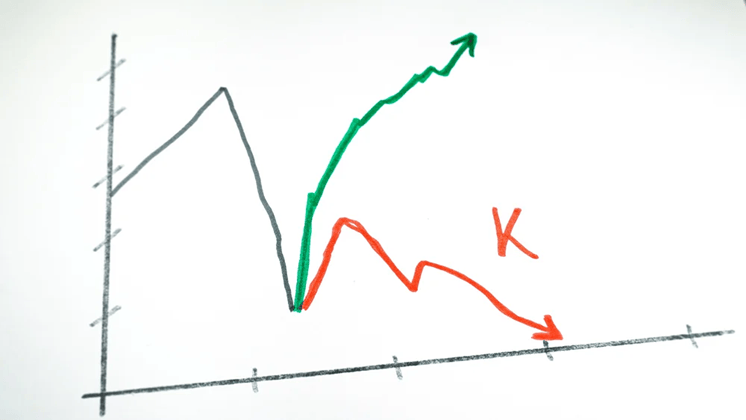
A K-shaped economy describes a situation where, following an economic downturn (pandemic), different parts of the economy recover at vastly different rates, resembling the two legs of the letter “K”. The key characteristic is the widening gap between the wealthy, who see their fortunes rise, and lower-income individuals and some industries, who continue to struggle. Looking back, this started shortly after the pandemic shutdown and the divergence between the upper- and lower-income legs became more evident once the federal government stopped the covid relief payments.

Let’s break it down.

Pros of the K-Shaped Economy (The Upper Leg)

The upper leg of the “K” highlights robust growth in certain areas, which can benefit the overall economy in specific ways:

  • Innovation and Productivity: Sectors that thrive, often driven by technology and large-scale investment, experience rapid innovation and high productivity. This leads to strong corporate profits and stock market performance.
  • Targeted Investment: The success of leading industries attracts significant investment, which further fuels growth in those areas (e.g., AI infrastructure and data centers).
  • Economic Resilience (for some): High-income households benefit from appreciating assets (stocks, real estate) and can maintain high consumer spending, which props up a significant portion of the overall economy.

Examples of the Upper Leg:

  • Technology Companies: Firms involved in software, artificial intelligence, and cloud computing (e.g., the “Magnificent 7” tech stocks) have seen immense revenue and stock price growth.
  • Wealthy Households: Individuals with significant financial investments see their net worth climb due to strong market performance and asset appreciation.
  • Premium Goods/Services: Companies selling high-end products, like luxury cars or premium airline seating, experience strong demand from affluent consumers. 
  • High-skill Professionals: These individuals often maintain job security and can benefit from remote work flexibility and rising wages.

Cons of the K-Shaped Economy (The Lower Leg)

The lower leg reveals significant challenges, primarily centered around growing disparity and economic strain:

  • Widening Inequality: The most significant downside is the exacerbation of the gap between the rich and poor, leading to a less equitable society.
  • Financial Strain: Lower-income individuals face immense pressure from stagnant wages, high inflation, surging debt, and rising costs for essential goods like housing and groceries.
  • Unsustainable Growth: An economy propelled largely by the wealthiest 10% (who account for about half of all spending) may not be sustainable long-term. If the struggling majority cuts back spending significantly due to financial distress, it could pull the entire economy into a recession.
  • Policymaking Challenges: The K-shape makes it difficult for policymakers to implement broad stimulus actions, as measures that help the struggling lower leg (e.g., low interest rates) might overheat the booming upper leg, and vice versa.

Examples of the Downward Leg:

  • Service & Hospitality Industries: Businesses like restaurants and hotels have struggled with recovery, job losses, and revenue drops.
  • Lower-Income Households: This group faces increasing debt, stagnant real wage growth, and higher rates of loan delinquencies.
  • Younger Generations: This group often face greater challenges, grappling with student loans and high costs for necessities like housing and groceries.
  • Small Businesses: Many small, brick-and-mortar retailers and other local firms have been hit hard, lacking the capital and digital infrastructure of larger corporations.

It is also important to note that the current administration’s trade policies, particularly the tariffs, have made this situation so much worse for lower income households and small businesses.


To summarize, the K-shaped economy creates a significant increase in wealth inequality. While overall economic indicators like GDP or the stock market may appear strong, they don’t tell the full story, as many people are left behind. This divergence can create an economy that relies heavily on the spending of a small, wealthy segment of the population, which is not sustainable in the long term.

Please comment or send an email if you have any questions.

Joe Baker, CFP®

Baker Asset Management, LLC

joebaker@bakerassetmanagement.com
Where Do Stocks Go Now That The Fed Just Cut Rates?

The Federal Open Market Committee (FOMC) just cut its benchmark interest rate, known as the federal funds rate, by a quarter-point (0.25%), bringing the target range to between 4.00% and 4.25%.

This can be considered a continuation of an easing cycle (period of lowering interest rates) that started back in September of 2024 but had been paused at the beginning of this year due to the uncertainty of how the new administration’s trade and immigration policies were going to affect prices and unemployment.

Since then, the data has shown that inflation has picked up mainly due to tariffs but not as much as expected. Our businesses are not passing on the full cost of the tariffs to their customers….for now. However, the labor market has weakened significantly in that same time span. Typically, when inflation picks up, raising rates helps cool it down. When unemployment increases, lowering rates is the standard response to help support employment. This dilemma of rising inflation and rising unemployment, aka stagflation, put the FOMC in a quandary for most of 2025.

Ultimately, at their last meeting, the FOMC chose to prioritize the battle against rising unemployment and restarted their easing cycle by cutting rates.

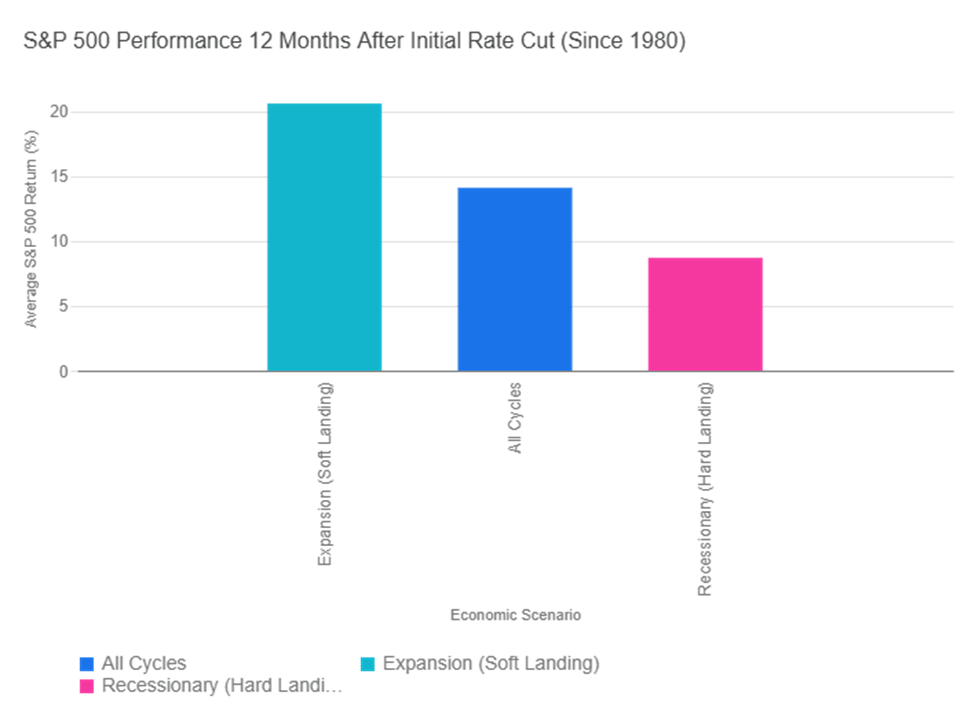
So, how will this affect the stock market? Historically, the market has performed well when interest rates are cut. The graph below illustrates the historical performance of the S&P 500 Index in the 12 months following the Federal Reserve’s first interest rate cut in a new cycle (since 1980). The returns vary significantly based on the underlying economic conditions, but they have always been good for stocks.

If we consider the start of the easing cycle to be September of 2024, we are now at a full year following the first rate cut. Interestingly enough, the S&P 500 has returned about 15.3% for that period, which coincides with its historical returns, as seen on the graph.

Does that mean we are due for a pullback? Not necessarily. If we continue on the trajectory of the soft landing that we were headed for at the beginning of this year, stock prices could continue to move higher. But, if inflation persists and unemployment continues to rise, we could be heading for a downturn.

The S&P 500 is also approaching a significant milestone: 3 years of consecutive double-digit returns. Stringing together three or more years of positive double-digit returns is rare but it happens.

Period (Start Year)Length of Streak (Years)
Early 1930s (e.g., 1933–1936)4
World War II / Post-War (e.g., 1942–1945)4
Post-War Boom (e.g., 1949–1955)7
Mid-1960s (e.g., 1963–1967)5
1990s Tech Boom (1995–1999)5
Post-Financial Crisis (e.g., 2012–2014)3
Post-Pandemic Era (2019–2021)3

We will see if stocks can make history as we head into the home stretch of 2025.

Please comment or send an email if you have any questions.

Joe Baker, CFP®

Baker Asset Management, LLC

joebaker@bakerassetmanagement.com
What Happens When The Fed Changes Rates

The Fed, specifically, the Federal Open Market Committee (FOMC), is not having their monthly meeting this August but many of the members are gathering this week in Jackson Hole, Wyoming with a bunch of financial big shots for their annual summer conference. The investment world will be tuning in to get any hints on what they plan to do with interest rates when they meet in September. So, I thought it would be a good time to review what happens when the Federal Reserve changes interest rates.

When the FOMC changes interest rates, they aren’t changing every rate out there.  They are only changing the Federal Funds Rate (FFR).  This is the rate that banks charge each other for overnight loans. Modifying this rate is one of the Fed’s tools that they use to maintain a healthy economy. They lower it if they feel the economy is slowing and raise it if the economy is heating up too quickly.

For example, if unemployment is trending up, the Fed would be more inclined to lower rates. If consumer prices (inflation) are going up at a higher rate than expected, they would consider raising rates to slow the increase.

Although you probably have never heard of the Fed Funds Rate, it does influence many of the interest rates that you are familiar with and interact with every day. The FFR is the base that the cost of money in the banking system is built upon. In fact, the prime rate, which almost all bank loans are based off of, is derived from the FFR and is typically 3% higher than the FFR.

Now, let’s take a look at the table below that shows what is expected with various rates and other economic factors when the FOMC changes the Fed Funds rate:

 When FOMC raises the FFR, plan on:When FOMC lowers the FFR, plan on:
Mortgage ratesHigherLower
Car loan ratesHigherLower
CD ratesHigherLower
Money market ratesHigherLower
Credit card ratesHigherLower
Business profitsLowerHigher
Stock marketLowerHigher
Consumer spendingLowerHigher
Home salesLowerHigher

These expected changes don’t happen overnight. It takes time for the Fed’s actions to trickle down to other rates and markets. For instance, if the Fed raises the FFR, the stock market might not go down until rates are high enough in other investments, such as bonds or CDs, to justify the shift from stocks to those other investment options.

This should give you a better understanding of what is happening when you hear that the Fed is changing interest rates.

Please comment or send an email if you have any questions.

Joe Baker, CFP®

Baker Asset Management, LLC

joebaker@bakerassetmanagement.com
Monthly Update – August 2025

Calendar Notes

  • None.

Stocks stayed in the green for the third month in a row, climbing a wall of worry built mainly from tariffs. The index reached a series of new all-time highs, driven by strong performances in Q2 by our home-grown big technology companies.

For the month of July, the S&P 500 rose a respectable 2.2%, even with a pretty big drop in the last days of the month. That beat the historical July average of 1.28% and now takes the index to a year-to-date return of 8.50%.

The usually quiet summer months for stocks are anything but this year. With most of the Q2 earnings posted already, the stock market is now going to be fixated on trade policy, the job market, inflation, and interest rates. Each of these four elements can provide a boost or a bust for stocks over the next month. If the new tariffs that were recently implemented stay in place, inflation is going to continue higher as it has over the past few months. Layoffs from both the public and private sectors are now showing up in the data as the effects of DOGE, trade, and immigration policies take hold. Companies are embracing AI to reduce payroll as well. The Federal Reserve is more likely to cut interest rates by their September meeting (no meeting in August) now with the recent poor jobs data most likely outweighing the rising inflation data.

The good news is, as I have said many times this year, the economy can get back on track if we get rid of the tariffs and instead negotiate trade deals with our allies that are beneficial to both parties. This would especially help our small businesses that can’t afford to pay these levies and still remain viable. It would also benefit those that are in the lower- and middle-income tiers that can’t afford the price increases that our companies will have to pass on to their customers due to the tariffs.

Historically, August has been a pretty boring month for stocks, with an average return of about 0.5%. I think this August could be a little more exciting, to say the least.

Take a look at the Outlook section below to see what events could move the markets over the short term.

Bond prices were flat to slightly lower during July as the economy began to show signs of slowing, increasing the potential for short-term interest rates to be lowered by the Federal Reserve. Although the Federal Reserve held rates unchanged after their July meeting, sentiment increased sharply for a cut by the time that they meet again in September due to the poor jobs report that came out just after the Fed concluded their meeting.

While there is a recovery in market sentiment after a temporary pause on new tariffs, concerns over the long-term impact of trade policies and geopolitical risks still persist. This kind of uncertainty can drive investors toward safer assets like bonds, particularly government bonds, increasing demand and pushing prices up. We will most likely see this price action continue if the most recent tariffs stay in place for any significant period of time.

The 10-year US Treasury note yield finished higher in July, settling at 4.36%, higher than the 4.23% yield that it was at the beginning of the month. The 30-year bond yield closed out the month at 4.89%, about 12 basis points higher than a month ago.

With all of the uncertainty in the bond market, it is prudent to invest in bonds that mature sooner rather than later. I like bonds with a 12-to-18-month maturity and plan on holding onto them until they do mature.

Savings rates didn’t move much in July. Money market rates and bank savings accounts are averaging only about 0.46% but the best rates can be found at credit unions and online banks with rates approaching 4.5%. It is worth it to do some research here. With rates staying above 4%, I think more money is going to be funneled into the safe havens of money markets and CDs as the stock market rebound is showing signs of fatigue. So, CDs and MMAs continue to be a great place toput your cash and your emergency fund, for now. Knowing this, it makes sense in most situations to put cash that you don’t immediately need into CDs with up to 2-year maturities. For emergency cash, stick to high yielding money market and savings accounts, of which the best are yielding about 4.4%. As always, keep the total under $250,000 per person at any one bank to ensure you are fully covered by the FDIC.

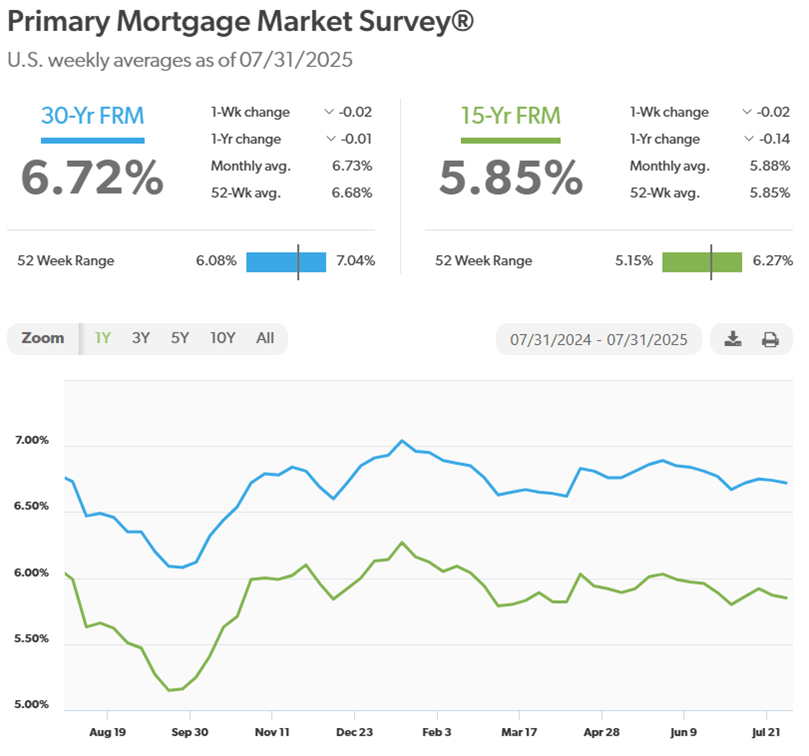
Mortgage rates mirrored other rate categories and had little movement this past month. The expectations were low for any changes in rates by the Federal Reserve, so this was expected. Higher housing inventory continued to put downward pressure on mortgage rates as well. Active listings rose for the 21st consecutive month, but overall inventory remains below pre-pandemic levels. It has become a buyers’ market in most parts of the country, but prices are still historically high and coupled with high mortgage rates, makes home purchases out of reach for many, especially first-time home buyers.

The 30-year fixed rate finished the month at 6.72%, still within the narrow range of 6.5% and 7% that it has been in since October of last year. The trade and immigration policies are causing higher raw materials and labor costs for homebuilders and are starting to show up in new home prices now, making it even harder to afford a new home.

Here is a look at the one-year chart of the 15- and 30-year mortgage rates from Freddie Mac.

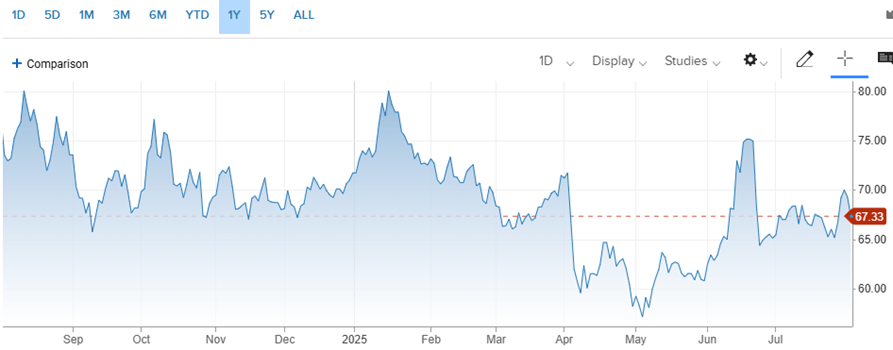
Oil prices were much calmer in July than they were in June of this year. That is, until the last week when oil prices surged due to renewed geopolitical risk causing a disruption in the global oil supply. Specifically, when the U.S. issued a deadline to Russia to end the war in Ukraine, threatening additional sanctions and tariffs on countries that continue to buy Russian oil. This, coupled with the seasonally strong summer demand could keep prices elevated at least through the end of August.

For the month, the price for a barrel of oil closed at $69.26, up from $65.11 at the beginning of July. For the year, it’s down about 3.40%. We certainly don’t want to see oil prices going higher now because that will raise the input costs for companies even higher as the tariffs take hold.

Here’s a look at the one-year chart for U.S. oil:

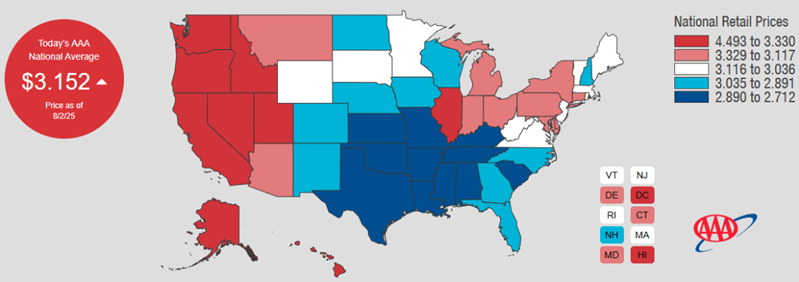
Gasoline prices dipped slightly in July. Regular unleaded gasoline is now averaging $3.15 per gallon, down four cents from last month. However, gas prices could be heading higher in the near future for reasons stated above in the oil prices section. Mississippi has the cheapest gas currently, checking in at $2.71 a gallon. California has the most expensive gasoline at $4.49 per gallon. FYI, a year ago, we were paying $3.48.

Check out the prices at the pump in your area: AAA Gas Prices.

Outlook

Events on the horizon that could move the markets in the near term:

  • Fed & Inflation: The Federal Reserve had started leaning towards cutting rates even before the bad jobs report came out this past Friday. Cracks have begun to appear in our resilient labor market as layoffs from DOGE and the private sector are reflected in the latest data. Also, inflation is picking up as U.S. companies begin to raise prices to offset the tariffs they are paying on imported goods and raw materials. Higher unemployment and higher prices, aka stagflation, is a tough scenario for the Fed to fight at the same time. Right now, it looks like they need to focus on the labor side of the equation, which would mean to cut rates. However, they have to tread carefully because lower rates combined with tariffs could lead to runaway inflation, which would be devastating to the economy. The ideal situation would be if we cut rates and removed the tariffs. That would help our economy recover and spur growth. I’m still hopeful.
  • Trump Administration Policies: The trade war is back on the front burner as tariffs are assessed on almost everything that our companies import for the products that they produce. As a reminder, the tariffs that we have been talking about this year are fees that U.S. companies pay our government. I like to think of these tariffs simply as an increase in the corporate tax for our companies. It basically increases the cost of doing business. So, in order for companies to keep the same profit margins pre-tariff, or in the case of many small businesses, to remain profitable at all, they have to either raise the prices that they charge their customers, lower expenses in other areas of their business, or a combination of both. Regardless of which avenue a company chooses, our economy will suffer, especially our small businesses and our lower income population that is already living paycheck to paycheck. As I said last month and will keep saying, the government needs to scuttle this absurd tariff strategy and go back to the drawing board to put together a plan that is realistic and can meet their objectives without damaging so many industries and so many lives. It’s not too late to save our small businesses, keep inflation in check, and get our economy back on track.

Joe Baker, CFP®

Baker Asset Management, LLC

joebaker@bakerassetmanagement.com
Steer Clear of Small-Cap Stock Funds

For as long as I can remember, one of the standard ingredients in a diversified stock portfolio has always included small-cap stock mutual funds or ETFs. As a refresher, small-cap stocks are shares in publicly traded companies with a market capitalization between $250 million and $2 billion and are considered to have higher growth potential but also higher risk compared to larger companies, such as those in the S&P 500 index.

Some of the risks that differentiate small-cap stocks from their large-cap siblings are:

  • Lower Liquidity: Small-cap stocks often have lower trading volumes. This means it can be difficult to buy or sell a large number of shares quickly without significantly impacting the stock’s price. In times of market stress, this lack of liquidity can make it challenging to exit a position, potentially exacerbating losses.
  • Greater Risk of Failure: Many small-cap companies are still in their early growth stages, with unproven business models and limited financial resources. This makes them more susceptible to business failures, competition, and economic shocks. Investors in these companies face a higher risk of losing their entire investment compared to investing in established, larger firms.
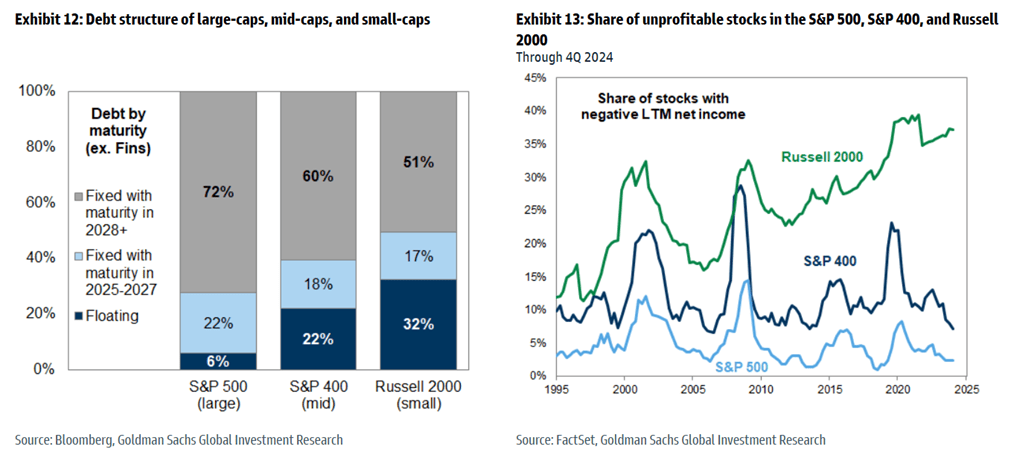
  • Sensitivity to Economic Conditions: Small-cap companies tend to be more sensitive to macroeconomic factors like interest rates, inflation, and recessions. They often have higher debt burdens and shorter debt cycles, making them more vulnerable to rising interest rates, which increase borrowing costs. During economic downturns, small businesses can be hit harder and take longer to recover than larger, more diversified corporations.

Because of these increased risks, most investors like to use small-cap mutual funds or ETFs to meet their diversification goals because it allows them to invest in a basket of small-cap stocks which normally helps reduce some of the risk. Recently, however, this has not been the best strategy and another reason why too much diversification can lead to diworsification when setting up your stock portfolio.

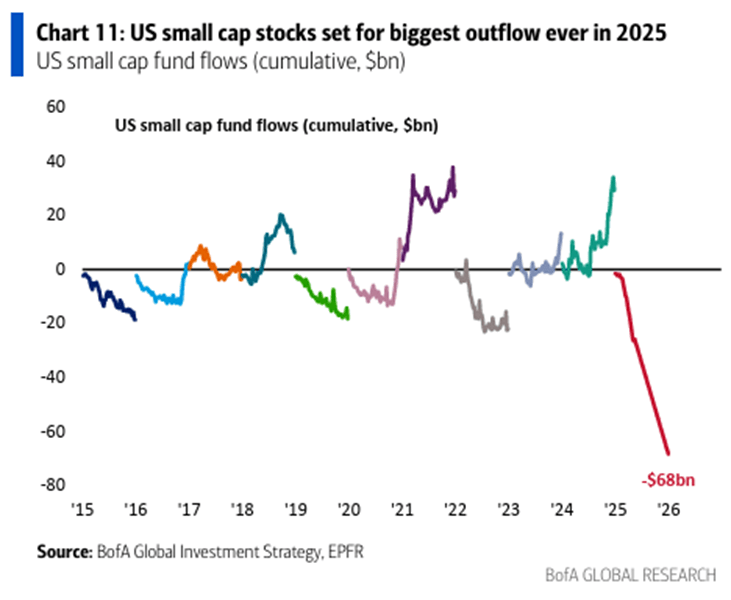
The biggest problem with small-cap funds is that when a small-cap company does well, it either gets bought by a larger company or becomes too big to stay in the small-cap world. Either way, it gets taken out of the small-cap fund, leaving the lower performing companies in it and it looks like investors are starting to realize this:

This illustration shows flow of money into and out of small-cap funds over the last ten years. As you can see, money is moving out big-time this year due to underperformance for the reasons stated above.

Here’s a few more charts that should scare you away from small-caps:

The chart on the left shows that small companies hold a larger portion of their debt in floating rate loans, which can be a huge risk in a rising interest-rate environment that we are starting to see as the tariffs start to kick in. The graph on the right shows that the number of unprofitable small-cap stocks is increasing while larger companies are becoming more profitable.

While it can pay off investing in small-cap stocks, it just seems like there is too much risk for the reward, especially in the current economic environment.

Please comment or send an email if you have any questions.

Joe Baker, CFP®

Baker Asset Management, LLC

joebaker@bakerassetmanagement.com