The Big Three: Which Market Pulse Actually Matters for Your Portfolio?

We’ve all seen the tickers scrolling at the bottom of the news screen: the Dow is up 200 points, the NASDAQ is flat, and the S&P 500 is hitting another record high. But for most investors, those numbers are just noise without context. It’s easy to treat “the market” as one giant, monolithic entity, but the truth is that these three indices are built differently, behave differently, and tell very different stories about your money. Today, we’re peeling back the curtain on the “Big Three” to see what’s actually under the hood—and which one you should actually be watching.

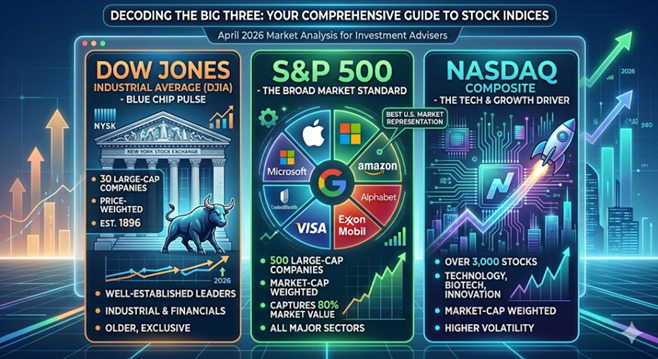
1. The Dow Jones Industrial Average (DJIA)

Commonly referred to as “The Dow”, this is the oldest and most “exclusive” of the three.

  • Composition: It consists of just 30 “blue-chip” companies. These are massive, well-established leaders in their respective industries (think Apple, UnitedHealth, and Goldman Sachs). Despite its name, it is no longer just “industrial”; it covers healthcare, tech, and financial services.
  • Calculation: The Dow is price weighted. This means the index is calculated by adding up the share prices of all 30 stocks and dividing by the “Dow Divisor” — a number that adjusts for stock splits and corporate changes.
  • The Quirk: Because it’s price-weighted, a stock with a $500 share price has a much bigger impact on the Dow than a stock with a $50 share price, regardless of the actual size of the company.

2. The S&P 500

The Standard & Poor’s 500 is widely considered the gold standard for institutional investors and professionals.

  • Composition: It tracks 500 of the largest publicly traded companies in the U.S. across 11 major sectors. To be included, companies must meet strict liquidity and profitability requirements.
  • Calculation: It is market-cap weighted (specifically, float-adjusted). The larger the company’s total market value, the more influence it has on the index.
  • The Reality: In 2026, the S&P 500 remains heavily influenced by the “Magnificent Seven” and other mega-cap tech giants, which account for a significant portion of its total movement.

3. The NASDAQ Composite

If the Dow is the “old guard” and the S&P is the “whole market,” the NASDAQ is the “innovator.”

  • Composition: This index includes over 3,000 stocks listed on the Nasdaq exchange. It is heavily concentrated in technology, biotechnology, and growth-oriented sectors. Notably, it excludes financial companies (unlike the S&P 500).
  • Calculation: Like the S&P 500, it is market-cap weighted.
  • The Role: Investors look to the NASDAQ as a barometer for the “risk-on” sentiment. When tech is booming, the NASDAQ leads the way; when interest rates rise and growth slows, it often takes the hardest hit.

Which One Represents the U.S. Market Best?

While the Dow gets the most TV time, the S&P 500 is the most accurate representation of the U.S. stock market.

FeatureDow JonesS&P 500NASDAQ
DiversityLow (30 stocks)High (500 stocks)Specialized (3,000+ stocks)
WeightingStock PriceMarket CapMarket Cap
Industry BiasBalanced/MatureBroad MarketTech / Growth
Who uses it?General PublicFund ManagersTech Investors

Why the S&P wins: The S&P 500 captures approximately 80% of the total available market value in the U.S. Its market-cap weighting ensures that we are looking at the actual economic footprint of these companies rather than just their arbitrary share price.


At the end of the day, these indices are more than just numbers on a screen; they are the tools we use to measure the temperature of the American economy. While the Dow offers a snapshot of blue-chip stability and the NASDAQ captures the high-voltage energy of the tech sector, the S&P 500 remains the most reliable compass for your long-term financial journey. By understanding how these benchmarks are constructed, you can move past the daily headlines and focus on what truly drives wealth: a disciplined, diversified strategy that looks at the big picture rather than just the daily ticker.

Investor Note: Always keep in mind that all three of these indices are comprised of 100% stock. Your portfolio most likely is a mix of stocks, bonds, commodities, and real estate so consider that when comparing your investment accounts to any of these indices.

Please comment or send an email if you have any questions.

Joe Baker, CFP®

Baker Asset Management, LLC

joebaker@bakerassetmanagement.com
Where Do Stocks Go Now That The Fed Just Cut Rates?

The Federal Open Market Committee (FOMC) just cut its benchmark interest rate, known as the federal funds rate, by a quarter-point (0.25%), bringing the target range to between 4.00% and 4.25%.

This can be considered a continuation of an easing cycle (period of lowering interest rates) that started back in September of 2024 but had been paused at the beginning of this year due to the uncertainty of how the new administration’s trade and immigration policies were going to affect prices and unemployment.

Since then, the data has shown that inflation has picked up mainly due to tariffs but not as much as expected. Our businesses are not passing on the full cost of the tariffs to their customers….for now. However, the labor market has weakened significantly in that same time span. Typically, when inflation picks up, raising rates helps cool it down. When unemployment increases, lowering rates is the standard response to help support employment. This dilemma of rising inflation and rising unemployment, aka stagflation, put the FOMC in a quandary for most of 2025.

Ultimately, at their last meeting, the FOMC chose to prioritize the battle against rising unemployment and restarted their easing cycle by cutting rates.

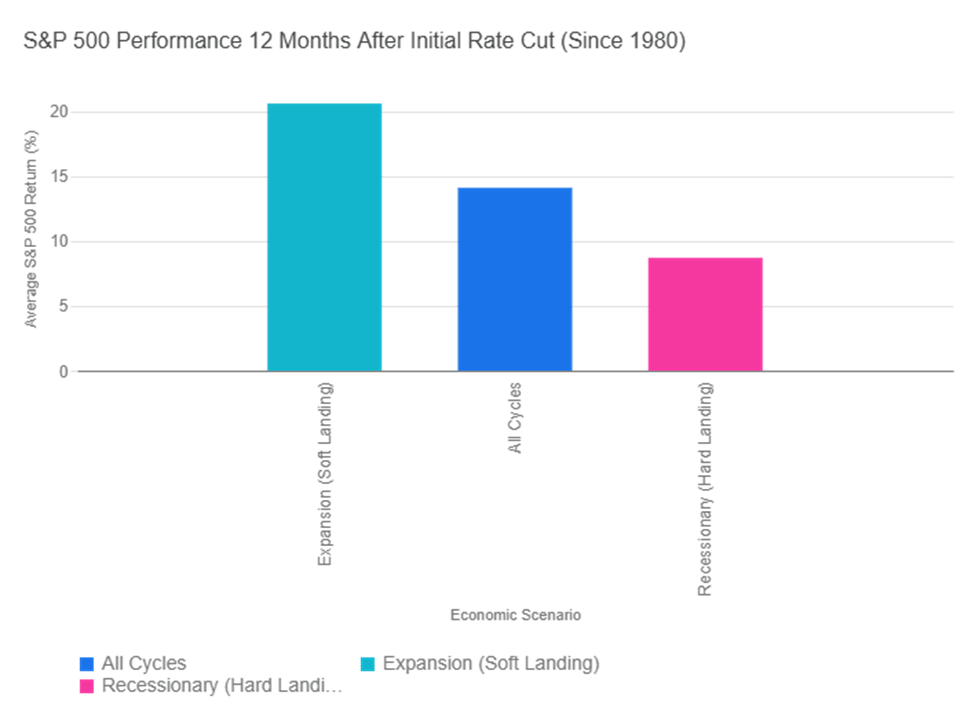
So, how will this affect the stock market? Historically, the market has performed well when interest rates are cut. The graph below illustrates the historical performance of the S&P 500 Index in the 12 months following the Federal Reserve’s first interest rate cut in a new cycle (since 1980). The returns vary significantly based on the underlying economic conditions, but they have always been good for stocks.

If we consider the start of the easing cycle to be September of 2024, we are now at a full year following the first rate cut. Interestingly enough, the S&P 500 has returned about 15.3% for that period, which coincides with its historical returns, as seen on the graph.

Does that mean we are due for a pullback? Not necessarily. If we continue on the trajectory of the soft landing that we were headed for at the beginning of this year, stock prices could continue to move higher. But, if inflation persists and unemployment continues to rise, we could be heading for a downturn.

The S&P 500 is also approaching a significant milestone: 3 years of consecutive double-digit returns. Stringing together three or more years of positive double-digit returns is rare but it happens.

Period (Start Year)Length of Streak (Years)
Early 1930s (e.g., 1933–1936)4
World War II / Post-War (e.g., 1942–1945)4
Post-War Boom (e.g., 1949–1955)7
Mid-1960s (e.g., 1963–1967)5
1990s Tech Boom (1995–1999)5
Post-Financial Crisis (e.g., 2012–2014)3
Post-Pandemic Era (2019–2021)3

We will see if stocks can make history as we head into the home stretch of 2025.

Please comment or send an email if you have any questions.

Joe Baker, CFP®

Baker Asset Management, LLC

joebaker@bakerassetmanagement.com
Using The VIX In Portfolio Management

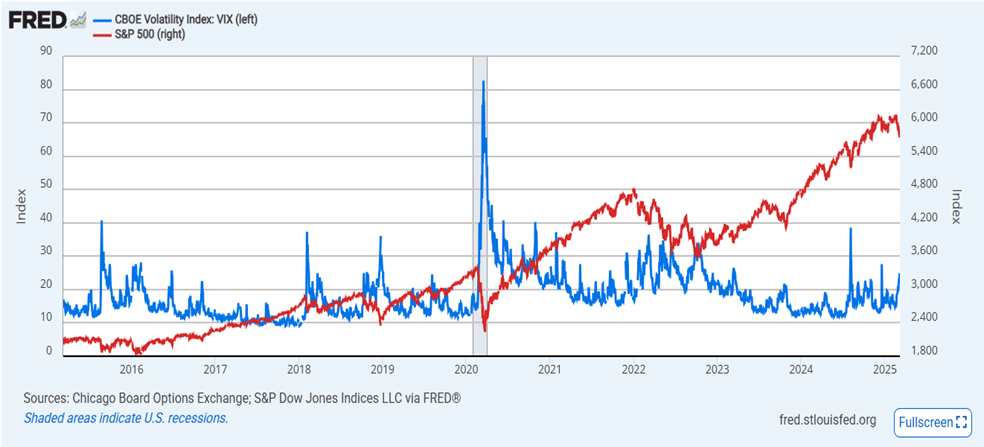
One of the metrics that I like to look at when assessing market risk is the CBOE Volatility Index, more commonly known as the VIX. The VIX measures the level of fear, anxiety, and/or uncertainty in the stock market. Technically, it looks at the options pricing of the S&P 500 index into the near future (about a month). When investors buy a lot of call options, meaning they expect the stock market to go up, the VIX drops. Conversely, when a lot of put options are bought, meaning people expect the stock market to drop, the VIX rises.

Of course, like everything else on Wall Street, there is a saying for the VIX: “When the VIX is high, it’s time to buy. When the VIX is low, look out below!” You’re probably thinking that this doesn’t make sense. A high VIX means there are a lot of pessimistic investors and so it would be bad for stocks. This is true but it is also true that the herd is usually wrong, so the VIX is normally interpreted as a contrarian indicator. This means when everyone is fearful, a high VIX, it’s probably not a bad time to buy stocks and vice versa.

Right now, we have a VIX of a little more than 26, a bit higher than what most investors consider a neutral VIX of 20. This makes sense because there is a lot of uncertainty in the market due to several of the current administration’s policies and there on again, off again status. I suspect that it will stay elevated until the chaos and confusion coming out of D.C. subsides.

An elevated VIX typically brings larger swings in stock market prices. For equity investors with a time horizon of three years or more, this volatility isn’t a big deal, as the major market indices have always trended up over time. For those with a shorter time period, they should have the money that they need in the near-term out of the stock market.

Using the VIX as part of your big picture view of the market’s risk is a useful data point to help with your portfolio management.

Please comment or send an email if you have any questions. Thanks!

Joe Baker, CFP®

Baker Asset Management, LLC

What History Tells Us About Stock Performance in the 4th Quarter

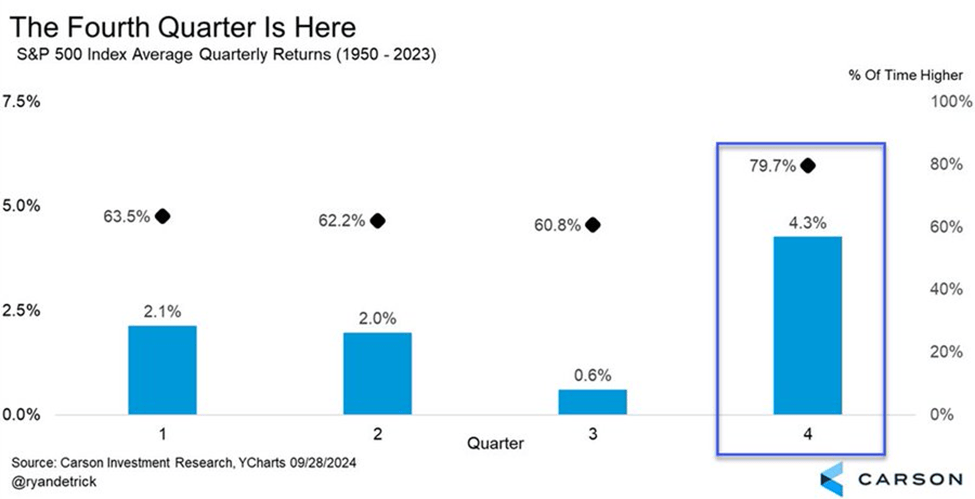
History tells us that the fourth quarter of the year is typically a very good time to be invested in stocks. Take a look at this chart:

As you can see, the S&P 500 index has an average return of 4.3% in the fourth quarter over the past seventy-three years. This is more than twice as good a return as any other quarter of the year.

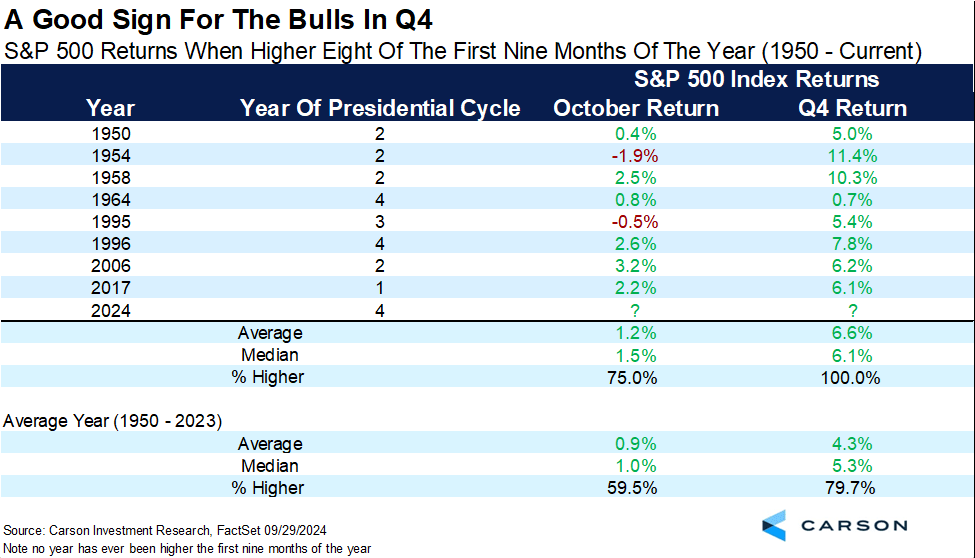
Historical data gets even better for stock market bulls when it comes to this year. When the S&P 500 index is higher the first eight of the nine months of a year, like it has been in 2024, then the fourth quarter is positive every single time (8 for 8), with an average gain of 6.6%. FYI, the index has never been up each of the first nine months of a year. This year, April has been the only down month.

I have to hedge this blog by stating that the upcoming election could have a greater influence on the markets than any other election in recent history. Even so, if history repeats itself, or at least rhymes, we should expect a pretty good quarter for the stock market to finish out 2024.

Please comment or send an email if you have any questions.

Joe Baker, CFP®

Baker Asset Management, LLC

joebaker@bakerassemanagement.com

Our Current Economy in Charts

I recently took a look at a whole bunch of economic data charts compiled by economists and strategists from the financial world. Much of this information shows that the U.S. economy can still achieve a soft landing coming out of the interest rate hiking cycle of the past few years.

Regarding the stock market, there are mixed reviews with some showing further room to run in this current bull market while others expect a pullback, especially with uncertainty picking up as we approach the November elections.

Here are a few of those charts that I wanted you to see:

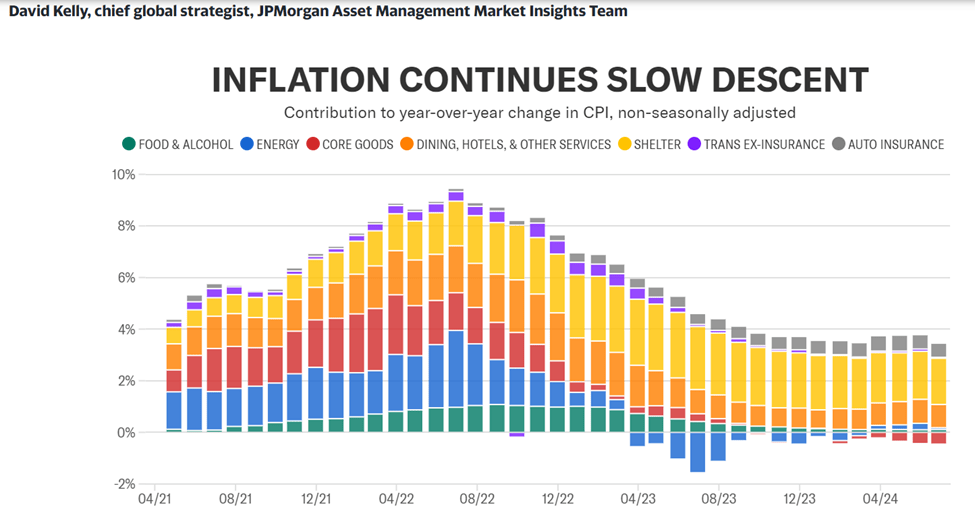
Shelter and auto insurance have been the two stubborn pieces of inflation that haven’t subsided yet. The good news is that rents and mortgage rates are rising much slower or even dropping in some areas, which should help get inflation down to the Federal Reserve’s target of 2% sometime in 2025.

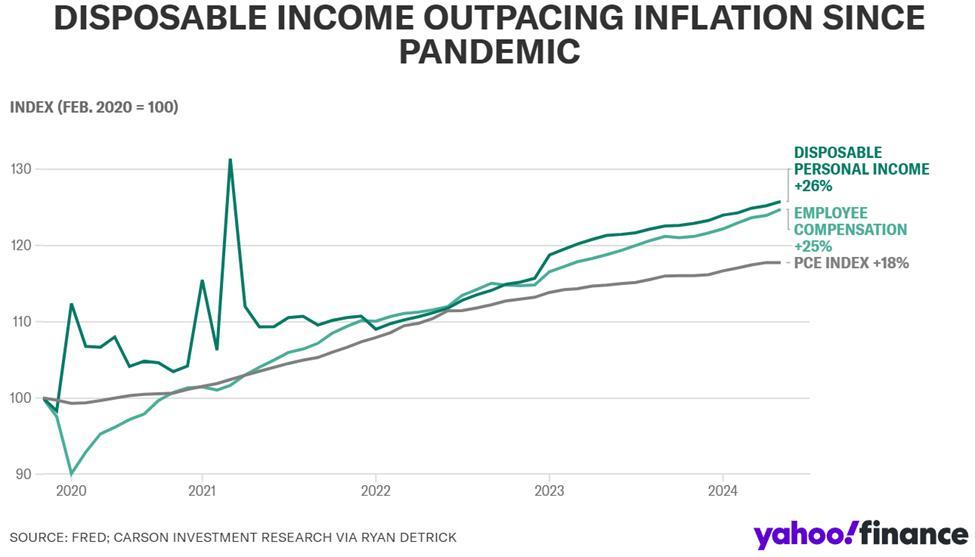
Because inflation has taken up all the oxygen in the room over the past few years, disposable income outpacing inflation is not a well-known statistic, but here it is. Both employee compensation and disposable personal income have increased more than inflation since the pandemic. Also, inflation is expected to continue to drop through the rest of this year, so consumers should see their disposable income increase, assuming their salaries remain the same.

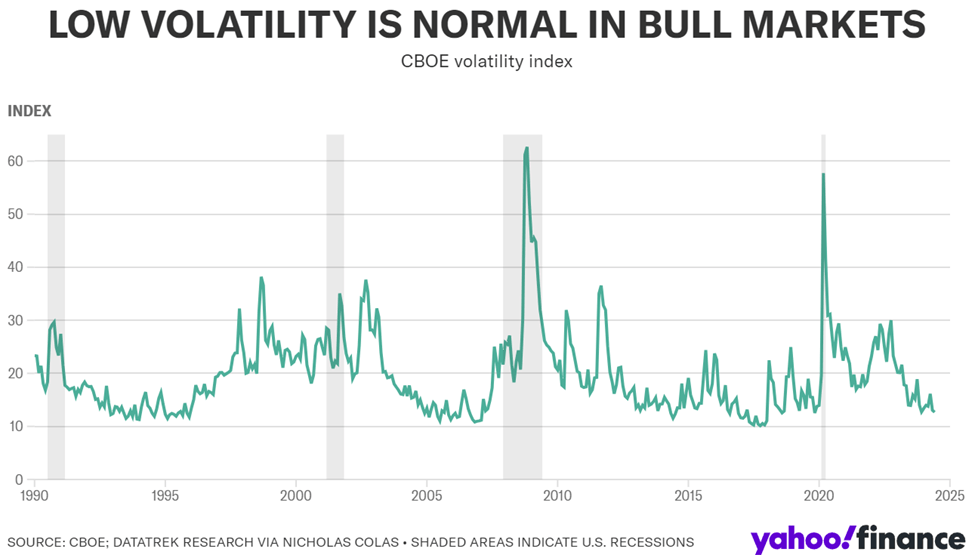
Chicago Board Options Exchange (CBOE) Volatility Index, more commonly known as the VIX, is an options-based measure of expected S&P 500 volatility over the next 30 days. When this indicator is consistently below 20, stocks tend to perform well. This was the case in the mid-1990s, mid-2000s, and much of the 2010s. When the VIX spikes, it is an indicator of a recession, of which the four most recent are shown as the shaded regions in the chart above. So, we could be in a period of low VIX, which is good for stocks, or about to enter a period where the VIX spikes. Interest rate and election forces will be what moves this index through the rest of this year.

To summarize, the economy and markets have done well so far in 2024 but it feels like we are at an inflection point now. The two big influencers are interest rates and the elections. These will dictate how we finish up in 2024. It should be an interesting ride into the end of the year.

Please comment or send an email if you have any questions.

Joe Baker, CFP®

Baker Asset Management, LLC

joebaker@bakerassemanagement.com

Dot Com Vs. AI Era Comparison

I thought it would be interesting to take a look at the late 1990’s Dot Com era and see how it compares to the current AI era. There are some similarities that I see, particularly with investors’ mindsets, that make me think history will repeat itself. But there are also some key differences that could keep the AI era from suffering the same fate as the Dot com era. Here’s what I am seeing:

What’s the same

Transformational Change – In the 90’s, the internet was changing how businesses interacted with customers. We went from going to brick and mortar stores to sitting at a computer to transact business. Today, AI is involved not only on the transactional side of business, but also the marketing, manufacturing, research, and almost every aspect of business today.

Fear Of Missing Out (FOMO) – You couldn’t go to a party, restaurant or pretty much any social gathering without hearing someone talk about how well their Dot Com investments were doing. This caused a great deal of FOMO among both retail and institutional investors. If there was a “.com” at the end of a company’s name, you wanted to own its stock. Now, investors are lining up to buy any company that is involved in AI infrastructure and willing to pay a premium for them.

What’s different

Earnings – The Dot Com era ushered in an incredible number of companies that went public based on hype and the promise of amazing revenue and profits. Many had no revenue but the push to get their stock publicly traded was so great that they rushed to the markets. The insanity was that investors couldn’t get enough of them. Of course, once reality set in, these companies went bankrupt, and investors lost everything. Now, most companies involved in AI are already well established (Microsoft, Amazon, Google, Nvidia, Meta, etc.) and are very profitable already.

Behind the Scenes – AI is helping make companies more efficient, productive, and profitable by improving operations and procedures behind the scenes. It is involved in almost every aspect of a company’s business whereas in the Dot Com era, the internet was more concentrated in just the sales and marketing sectors.

Far Reaching – Back in the 90’s the internet focused mainly on the interphase between businesses and consumers. Today, AI is not only involved there, it is changing nearly every aspect of every industry. In health care for instance, AI can read x-rays, CAT scans, and biopsy slides with incredible accuracy, detecting and diagnosing diseases faster. In the forest fire arena, AI is now being used to detect fires much quicker than humanly possible. California has 1,000 cameras monitoring their forests using AI. The money, manpower, and property saved by employing AI is immense. Now, extrapolate that across every industry and you can see why AI is a game changer.

That being said, it does seem that the markets might be getting ahead of themselves in this AI era. But it is nowhere near the frenzied euphoria that caused the Dot Com era bubble to burst…..for now.

Please comment or send an email if you have any questions.

Joe Baker, CFP®

Baker Asset Management, LLC

joebaker@bakerassemanagement.com

Are You A Trader or An Investor?

Since November of last year, the S&P 500 index has risen steadily, with just a handful of weeks with negative returns. So, you may be asking yourself if stocks have gone up too far, too fast and are ripe for a pullback. If you are good at timing the market, this may seem like a good time to take some chips off the table. I recently talked about timing the market and you can check that out here: Sell In May And Go Away?

But before you do anything, you should ask yourself this question: Are you a trader or an investor?

Traders and investors both deal with buying and selling financial assets, but they have different goals and timeframes. Here’s a breakdown of the key differences:

Timeframe:

  • Trader: Focuses on short-term gains, buying and selling assets within a short period, like seconds, days, or weeks. This is often called short-term trading or day trading.
  • Investor: Has a long-term perspective, buying and holding assets for years or even decades. They aim to grow their wealth through the overall appreciation of the assets and potentially through dividends (regular payments from companies to shareholders).

Goal:

  • Trader: Aims to capitalize on short-term market movements and price fluctuations. They may be more concerned with technical analysis, looking for patterns in charts and trading data.
  • Investor: Focuses on the underlying value of the asset and the company’s potential for long-term growth. They rely more on fundamental analysis, researching a company’s financials and overall economic conditions.

Effort:

  • Trader: Trading can be a very active process, requiring constant monitoring of markets and frequent buying and selling decisions.
  • Investor: Investing can be more passive, requiring less day-to-day attention. Investors may periodically rebalance their portfolio, but generally don’t need to be glued to the markets.

Risk:

  • Trader: Short-term trading can be riskier, as markets can be volatile and unpredictable.
  • Investor: Long-term investing is generally considered less risky, as history shows the stock market tends to trend upwards over time. However, there are still risks involved, such as economic downturns.

There are many people, me included, who operate as both a trader and an investor. For me, I have trader accounts and investor accounts. My retirement accounts are considered my investor accounts. I also have a small trader account that I manage as well.

For traders, this probably is a good time to take some profits and get some cash ready to make buys after the eventual dip that’s coming since stocks seem over bought currently. Traders can also buy put options (insurance of sorts) to protect their gains without having to sell their existing positions.

For investors, the current state of the markets shouldn’t influence your long-term strategy. If you are holding well-managed companies with strong financials in growing industries and high barriers to entry (wide moat), you stay the course. If their stock prices drop on the eventual pullback, you buy more.

Now, you can categorize your accounts based on how you manage them, as a trader or as an investor.

Finally, just as a reminder, if you need money for something in the immediate future, it should be in an emergency reserve account, like a money market, savings, or checking account.

Please comment or send an email if you have any questions.

Joe Baker, CFP®

Baker Asset Management, LLC

joebaker@bakerassemanagement.com

Must See Stock Charts During Presidential Election Years

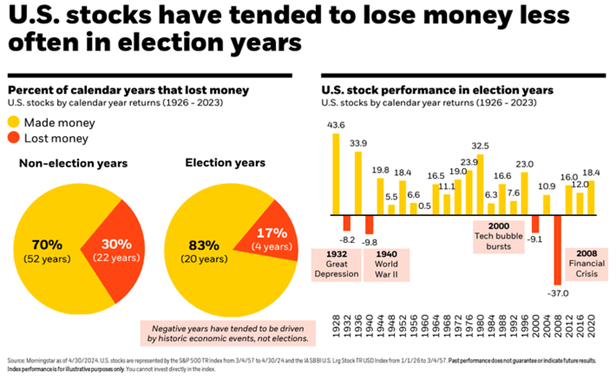
I saw some interesting charts in the past week that illustrate stock performance in a presidential election year.

First, in the chart above, you can see that stocks have performed well in past presidential election years. The four years that stocks had negative returns included some very significant economic and geopolitical events that contributed to their poor performance.

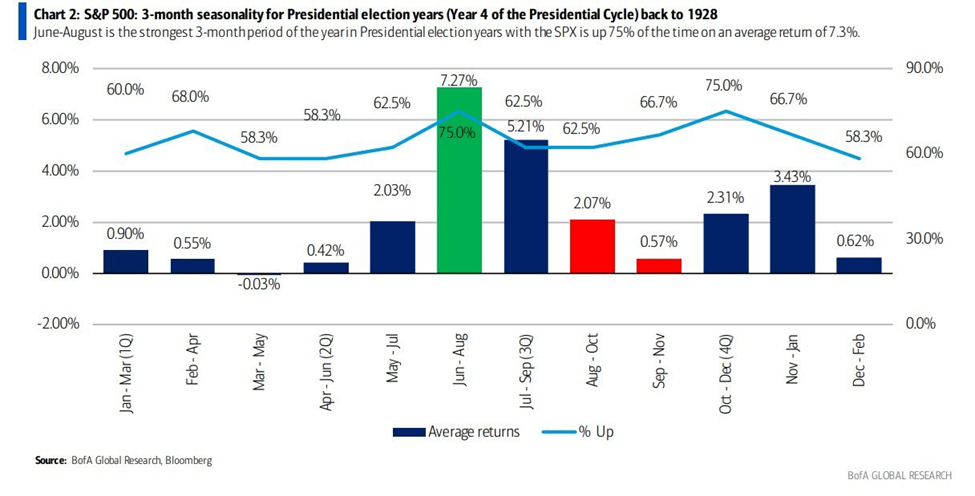
This next chart shows how stocks performed during every rolling three month stretch in an election year going all the way back to 1928. As you can see, the June, July, and August stretch is the best performing with a positive return 75% of the time and an average return of almost 7.3%.

The last chart simply shows the performance of stocks during each month of a presidential election year going back to 1928.

So, it seems that summertime is the best time to be invested in the stock market during a presidential election year. However, we are currently at or near all-time highs in most stock indices and appear to be ripe for a pullback in stock prices. It will be interesting to see if this historical trend can hold up with such a positive return in stocks preceding it over the last eighteen months.

Please comment or send an email if you have any questions.

Joe Baker, CFP®

Baker Asset Management, LLC

joebaker@bakerassemanagement.com

Sell In May And Go Away?

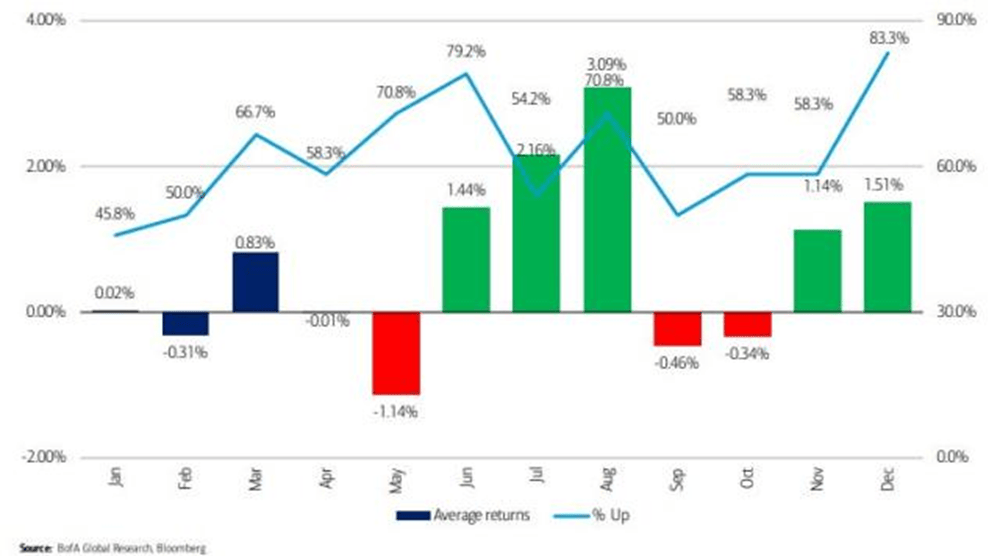
Sell in May and go away is an old Wall Street saying that is the basis for a market-timing investment strategy which calls for you to sell your stock holdings right before summer and buy them back in late fall, or right before Memorial Day and right after Halloween.

Historically, the S&P 500 has performed better during the winter months than in the summer months. So, there is evidence that this strategy could work, but we are really Monday-morning quarterbacking here. In reality, you have to be very good at timing the market not once, but twice every year! You have to pick when to sell and then you have to pick when to buy back in. Plus, you have to consider your holdings’ short-term versus long-term gains and losses as well as the associated tax ramifications.

I don’t know of anyone or any firm that has been able to do this successfully for an extended period of time.

So, whenever I hear the “Sell in May and go away” adage, I like to think of another old Wall Street saying: Time in the market, not timing the market. This means relying on a strategy where you don’t try to guess when the market is at its lowest or highest point. Instead, you invest knowing that your timing is probably going to be off, but that eventually, investing in great companies with strong fundamentals matters more than the timing.

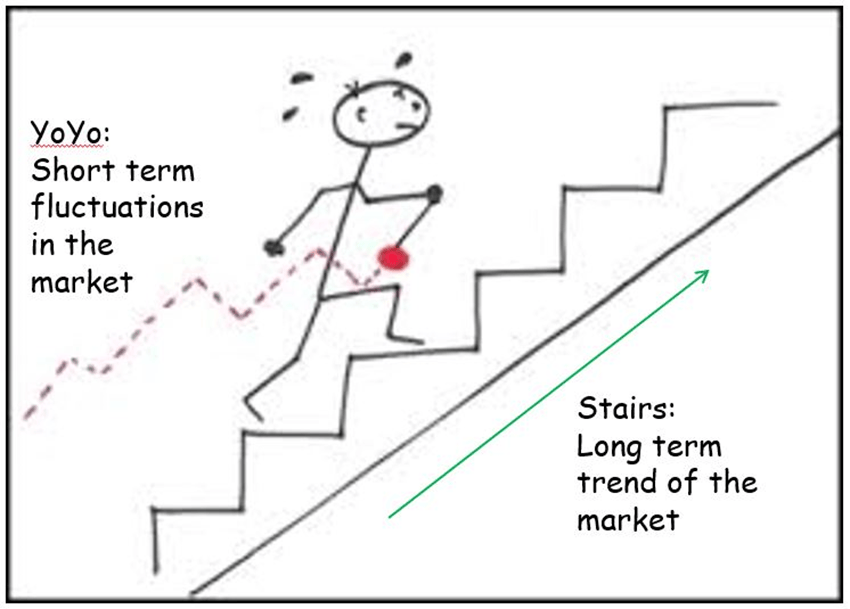
Now is when I roll out my favorite illustration to show why time in the market is better than timing the market for investors.

Picture the movement of the yo-yo as the short-term fluctuations of the stock market and the guy walking up the stairs as the long-term trend of the market. The market has its ups and downs, but over time, has consistently moved higher. This is a simple, but effective, way to illustrate why time in the market is better than timing the market.

Please comment or send an email if you have any questions. Have a great Memorial Day weekend!

Joe Baker, CFP®

Baker Asset Management, LLC

joebaker@bakerassemanagement.com

How Stocks Perform In Presidential Election Years

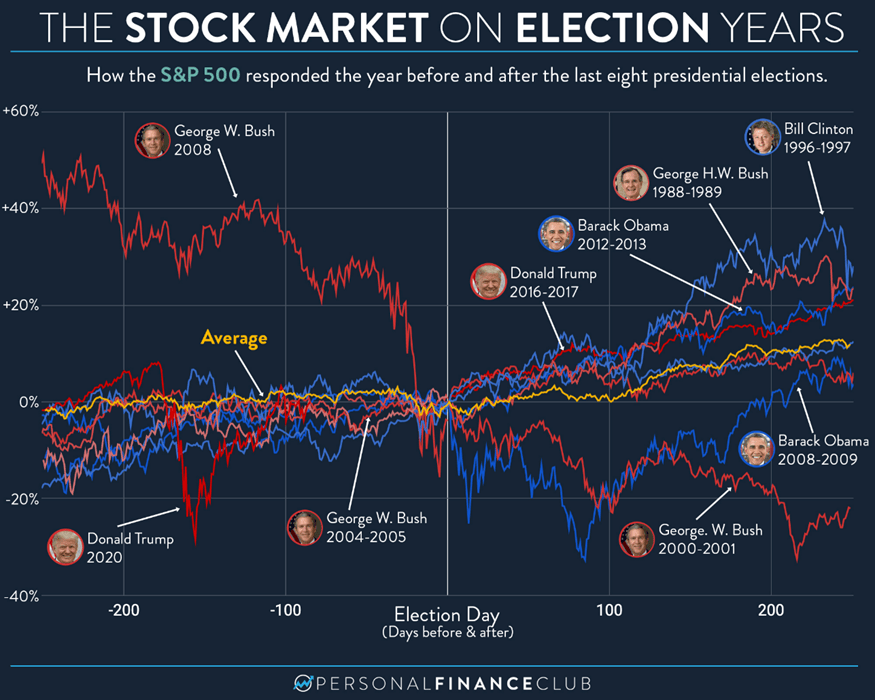
Besides interest rates and The Federal Reserve, stock market volatility is going to be heavily influenced by the presidential election this November. And it’s not going to wait until Fall. Headlines are going to be filled with polls, debates, and trials from now until election day (and beyond, I’m sure). I have always felt that elections are just short-term catalysts, both positive and negative, for stocks and Presidents don’t really have an affect on stock prices. It will still hold true this year. However, I suspect there will be much more volatility due to politics than normal, especially with addition of the Trump trials to the landscape.

So, let’s take a look at how markets have performed historically in a presidential election year:

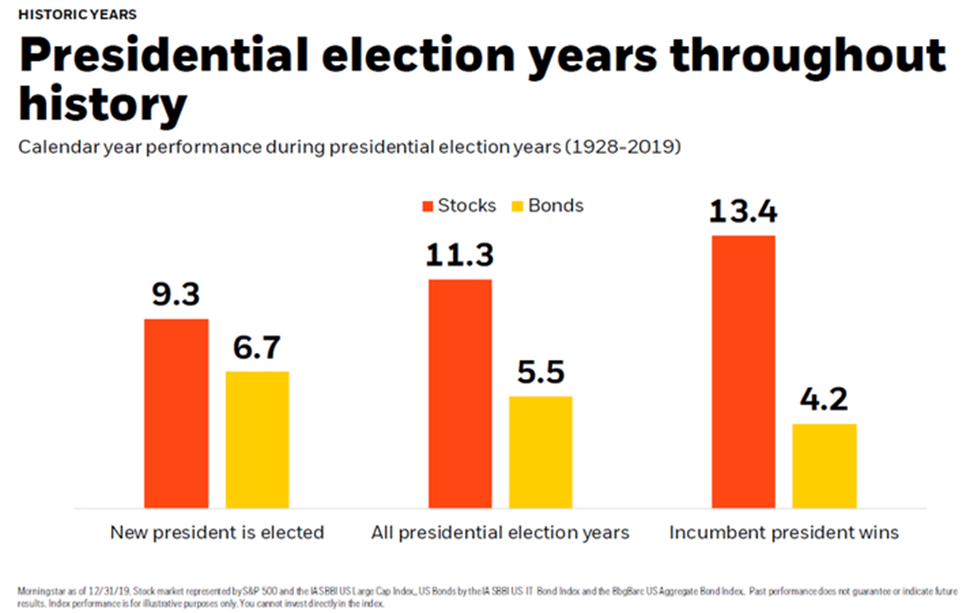
  • Historically, the S&P 500 has averaged a 7% gain during U.S. presidential election years since 1952. This is lower than the average annual gain of around 10% but still positive.
  • Re-election years: Markets tend to perform better in re-election years (such as this year), with the S&P 500 averaging a 12.2% gain since 1952. This could be due to an incumbent president’s focus on maintaining stability and avoiding major policy changes.
  • Party control: The party in control of Congress doesn’t seem to have a significant impact on market performance. However, major policy changes proposed by either party can cause uncertainty and volatility.
  • Economic conditions: The overall health of the economy has a much stronger influence on the stock market than the election itself. Strong economic growth and low inflation are typically associated with positive market returns.

Historically, stocks perform the best when an incumbent president wins and the opposite party controls at least one  section of Congress, either the House of Representatives or the Senate. But this shouldn’t influence your investment strategy for the long term. Holding high-quality, well-run companies will serve you well regardless of the political climate.

Please comment or send an email if you have any questions.

Joe Baker, CFP®

Baker Asset Management, LLC

joebaker@bakerassetmanagement.com