
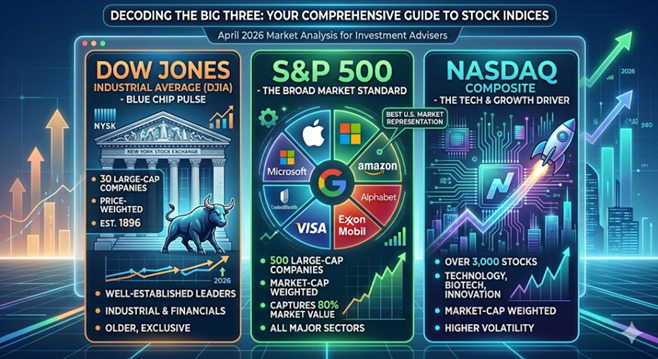
We’ve all seen the tickers scrolling at the bottom of the news screen: the Dow is up 200 points, the NASDAQ is flat, and the S&P 500 is hitting another record high. But for most investors, those numbers are just noise without context. It’s easy to treat “the market” as one giant, monolithic entity, but the truth is that these three indices are built differently, behave differently, and tell very different stories about your money. Today, we’re peeling back the curtain on the “Big Three” to see what’s actually under the hood—and which one you should actually be watching.
1. The Dow Jones Industrial Average (DJIA)
Commonly referred to as “The Dow”, this is the oldest and most “exclusive” of the three.
- Composition: It consists of just 30 “blue-chip” companies. These are massive, well-established leaders in their respective industries (think Apple, UnitedHealth, and Goldman Sachs). Despite its name, it is no longer just “industrial”; it covers healthcare, tech, and financial services.
- Calculation: The Dow is price weighted. This means the index is calculated by adding up the share prices of all 30 stocks and dividing by the “Dow Divisor” — a number that adjusts for stock splits and corporate changes.
- The Quirk: Because it’s price-weighted, a stock with a $500 share price has a much bigger impact on the Dow than a stock with a $50 share price, regardless of the actual size of the company.
2. The S&P 500
The Standard & Poor’s 500 is widely considered the gold standard for institutional investors and professionals.
- Composition: It tracks 500 of the largest publicly traded companies in the U.S. across 11 major sectors. To be included, companies must meet strict liquidity and profitability requirements.
- Calculation: It is market-cap weighted (specifically, float-adjusted). The larger the company’s total market value, the more influence it has on the index.
- The Reality: In 2026, the S&P 500 remains heavily influenced by the “Magnificent Seven” and other mega-cap tech giants, which account for a significant portion of its total movement.
3. The NASDAQ Composite
If the Dow is the “old guard” and the S&P is the “whole market,” the NASDAQ is the “innovator.”
- Composition: This index includes over 3,000 stocks listed on the Nasdaq exchange. It is heavily concentrated in technology, biotechnology, and growth-oriented sectors. Notably, it excludes financial companies (unlike the S&P 500).
- Calculation: Like the S&P 500, it is market-cap weighted.
- The Role: Investors look to the NASDAQ as a barometer for the “risk-on” sentiment. When tech is booming, the NASDAQ leads the way; when interest rates rise and growth slows, it often takes the hardest hit.
Which One Represents the U.S. Market Best?
While the Dow gets the most TV time, the S&P 500 is the most accurate representation of the U.S. stock market.
| Feature | Dow Jones | S&P 500 | NASDAQ |
| Diversity | Low (30 stocks) | High (500 stocks) | Specialized (3,000+ stocks) |
| Weighting | Stock Price | Market Cap | Market Cap |
| Industry Bias | Balanced/Mature | Broad Market | Tech / Growth |
| Who uses it? | General Public | Fund Managers | Tech Investors |
Why the S&P wins: The S&P 500 captures approximately 80% of the total available market value in the U.S. Its market-cap weighting ensures that we are looking at the actual economic footprint of these companies rather than just their arbitrary share price.
At the end of the day, these indices are more than just numbers on a screen; they are the tools we use to measure the temperature of the American economy. While the Dow offers a snapshot of blue-chip stability and the NASDAQ captures the high-voltage energy of the tech sector, the S&P 500 remains the most reliable compass for your long-term financial journey. By understanding how these benchmarks are constructed, you can move past the daily headlines and focus on what truly drives wealth: a disciplined, diversified strategy that looks at the big picture rather than just the daily ticker.
Investor Note: Always keep in mind that all three of these indices are comprised of 100% stock. Your portfolio most likely is a mix of stocks, bonds, commodities, and real estate so consider that when comparing your investment accounts to any of these indices.
Please comment or send an email if you have any questions.
Joe Baker, CFP®
Baker Asset Management, LLC
joebaker@bakerassetmanagement.com

