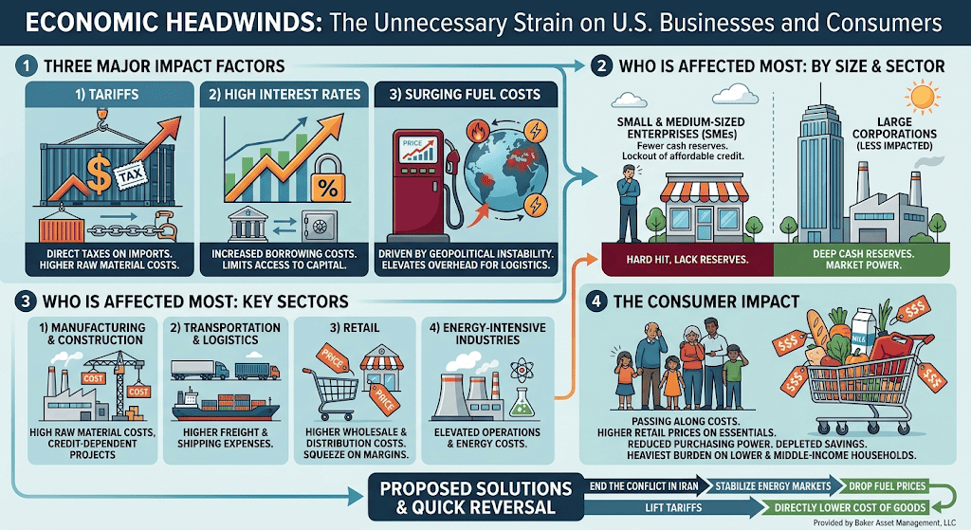
The U.S. economy has shown remarkable resilience, largely buoyed by a historic surge in productivity and investment driven by the artificial intelligence revolution. However, that underlying momentum is now in serious jeopardy due to three major self-inflicted pressures: high interest rates, trade tariffs, and surging inflation driven by skyrocketing fuel costs. These conditions create an unnecessary drag on economic expansion, but they could be reversed quickly by ending the conflict in Iran to stabilize global energy markets and removing trade tariffs.
Here is a breakdown of how these factors are impacting the market and who is bearing the brunt of the burden:
The Core Economic Pressures
Tariffs: Tariffs act as a direct tax on imported goods, raising the cost of raw materials and inventory. Businesses are forced to either absorb these losses or pass them on to consumers, driving inflation higher.
Surging Fuel Costs: Geopolitical conflict—specifically the war in Iran—has pushed fuel and energy prices up rapidly. This disproportionately increases overhead for any business reliant on physical operations, shipping, or manufacturing.
High Interest Rates: Elevated borrowing costs mean that securing capital for business expansion, equipment upgrades, or day-to-day cash flow management is now prohibitively expensive.
Who is Affected the Most?
By Business Size: Small and medium-sized enterprises (SMEs) bear the heaviest load. Unlike massive multinational corporations, SMEs lack the deep cash reserves and market power to absorb sustained cost increases, while high interest rates restrict their access to affordable working capital.
By Sector:
Manufacturing & Construction: Heavily reliant on raw materials subject to tariffs and credit-dependent for project financing.
Transportation & Logistics: Surging fuel costs act as an immediate hit to margins for any firm moving physical goods.
Retail: Retailers are squeezed on both ends—paying higher wholesale and transport costs while selling to consumers whose discretionary budgets are pinched by inflation.
By Consumer (Lower and Middle-Income Households): Ultimately, these corporate cost pressures spill over onto everyday households. As businesses pass along tariff taxes, elevated freight charges, and higher borrowing expenses, retail prices rise on essential goods like food, energy, and household staples. Lower and middle-income families—who spend a significantly larger portion of their take-home pay on basic necessities—bear the heaviest burden, facing reduced purchasing power and depleted savings as living costs climb.
The Solution
The clearest, most efficient path to economic relief requires straightforward policy changes. Ending the conflict in Iran would immediately ease energy market volatility and lower fuel prices at the pump, while lifting tariffs would directly reduce input costs for businesses and bring relief to consumer budgets across the board. By eliminating these primary drivers of inflation, the Federal Open Market Committee (FOMC) would have the leeway needed to lower interest rates without the risk of runaway prices, providing immediate relief to borrowing businesses and the broader economy.
Please comment or send an email if you have any questions.
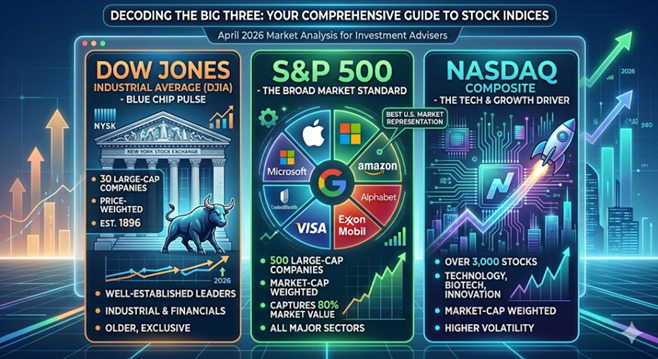
We’ve all seen the tickers scrolling at the bottom of the news screen: the Dow is up 200 points, the NASDAQ is flat, and the S&P 500 is hitting another record high. But for most investors, those numbers are just noise without context. It’s easy to treat “the market” as one giant, monolithic entity, but the truth is that these three indices are built differently, behave differently, and tell very different stories about your money. Today, we’re peeling back the curtain on the “Big Three” to see what’s actually under the hood—and which one you should actually be watching.
1. The Dow Jones Industrial Average (DJIA)
Commonly referred to as “The Dow”, this is the oldest and most “exclusive” of the three.
Composition: It consists of just 30 “blue-chip” companies. These are massive, well-established leaders in their respective industries (think Apple, UnitedHealth, and Goldman Sachs). Despite its name, it is no longer just “industrial”; it covers healthcare, tech, and financial services.
Calculation: The Dow is price weighted. This means the index is calculated by adding up the share prices of all 30 stocks and dividing by the “Dow Divisor” — a number that adjusts for stock splits and corporate changes.
The Quirk: Because it’s price-weighted, a stock with a $500 share price has a much bigger impact on the Dow than a stock with a $50 share price, regardless of the actual size of the company.
2. The S&P 500
The Standard & Poor’s 500 is widely considered the gold standard for institutional investors and professionals.
Composition: It tracks 500 of the largest publicly traded companies in the U.S. across 11 major sectors. To be included, companies must meet strict liquidity and profitability requirements.
Calculation: It is market-cap weighted (specifically, float-adjusted). The larger the company’s total market value, the more influence it has on the index.
The Reality: In 2026, the S&P 500 remains heavily influenced by the “Magnificent Seven” and other mega-cap tech giants, which account for a significant portion of its total movement.
3. The NASDAQ Composite
If the Dow is the “old guard” and the S&P is the “whole market,” the NASDAQ is the “innovator.”
Composition: This index includes over 3,000 stocks listed on the Nasdaq exchange. It is heavily concentrated in technology, biotechnology, and growth-oriented sectors. Notably, it excludes financial companies (unlike the S&P 500).
Calculation: Like the S&P 500, it is market-cap weighted.
The Role: Investors look to the NASDAQ as a barometer for the “risk-on” sentiment. When tech is booming, the NASDAQ leads the way; when interest rates rise and growth slows, it often takes the hardest hit.
Which One Represents the U.S. Market Best?
While the Dow gets the most TV time, the S&P 500 is the most accurate representation of the U.S. stock market.
Feature
Dow Jones
S&P 500
NASDAQ
Diversity
Low (30 stocks)
High (500 stocks)
Specialized (3,000+ stocks)
Weighting
Stock Price
Market Cap
Market Cap
Industry Bias
Balanced/Mature
Broad Market
Tech / Growth
Who uses it?
General Public
Fund Managers
Tech Investors
Why the S&P wins: The S&P 500 captures approximately 80% of the total available market value in the U.S. Its market-cap weighting ensures that we are looking at the actual economic footprint of these companies rather than just their arbitrary share price.
At the end of the day, these indices are more than just numbers on a screen; they are the tools we use to measure the temperature of the American economy. While the Dow offers a snapshot of blue-chip stability and the NASDAQ captures the high-voltage energy of the tech sector, the S&P 500 remains the most reliable compass for your long-term financial journey. By understanding how these benchmarks are constructed, you can move past the daily headlines and focus on what truly drives wealth: a disciplined, diversified strategy that looks at the big picture rather than just the daily ticker.
Investor Note: Always keep in mind that all three of these indices are comprised of 100% stock. Your portfolio most likely is a mix of stocks, bonds, commodities, and real estate so consider that when comparing your investment accounts to any of these indices.
Please comment or send an email if you have any questions.
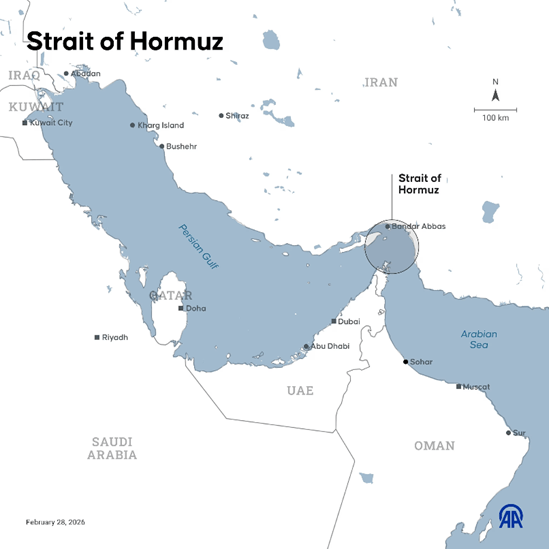
It’s a common question I hear from clients: “If the U.S. is producing record amounts of its own oil, why does a conflict thousands of miles away in the Middle East make it more expensive to fill up my SUV in suburbs?” It feels like a disconnect, but the answer lies in the fact that oil isn’t just a local resource—it’s a global currency. Even if not a single drop of oil from the Strait of Hormuz ever reaches a U.S. refinery, the closure of that vital waterway sends a shockwave through the global market that changes the price of every barrel on earth, including the ones produced right here in the U.S.
Why U.S. Oil Prices Are Rising
West Texas Intermediate (WTI) is the U.S. benchmark for oil. While it is produced domestically, its price is heavily influenced by global supply and demand.
Global Competition for Barrels: When 20% of the world’s oil supply is cut off at the Strait of Hormuz, countries that previously relied on Middle Eastern oil (like those in Asia and Europe) must find it elsewhere. They begin bidding on any available barrel, including those produced in the U.S., which drives up the price for everyone.
Market Interconnectivity: Traders look for the highest price globally. If global benchmarks like Brent crude spike, U.S. producers will sell to international buyers unless domestic prices rise to match.
Why U.S. Gas Prices Are Increasing
Retail gasoline prices respond to the replacement cost of fuel, not just the current supply.
Refining Realities: Although the U.S. produces more oil than it consumes, our refineries are often configured to process heavy crude imported from abroad rather than the “light sweet” crude produced in Texas. Disruptions in global shipping force refiners to pay more for suitable crude, a cost passed to the pump. Why our refineries aren’t configured to process U.S. oil is a whole other discussion.
Anticipating Future Costs: Gas station owners set prices based on what it will cost to buy their next shipment. If they see wholesale oil prices skyrocketing due to the Strait’s closure, they raise prices immediately to ensure they have enough cash to restock their tanks at the new, higher rate.
“Rockets and Feathers”: Economists note that gas prices typically rise quickly (like a rocket) when oil prices spike but fall slowly (like a feather) even after tensions ease, as retailers are cautious about lowering prices until they are sure their replacement costs have stabilized.
Ultimately, while we have achieved a high level of energy independence on paper, we are still tied to a global price tag. When 20% of the world’s oil supply is suddenly at risk, the “neighborhood” of global energy becomes a lot more expensive for everyone. Understanding this helps us look past the daily headlines and focus on the broader economic reality: in a connected world, a bottleneck in the Middle East is felt at every gas station in America.
Please comment or send an email if you have any questions.
The Strait of Hormuz is often called the “world’s most important oil artery,” but its role in the global economy extends far beyond just crude oil. As of March 2026, the ongoing conflict involving the U.S., Israel, and Iran has effectively turned this narrow waterway into a “nightmare scenario” for global trade. Beyond the millions of barrels of crude, the Strait is the exit point for 20% of the world’s Liquefied Natural Gas (LNG), nearly a third of the global seaborne fertilizer trade, and a massive 8% of the world’s aluminum supply. From the essential chemicals like sulfur that power our mines and farms to the refined fuels that keep global shipping afloat, the blockade of Hormuz isn’t just an energy crisis, it is a total systemic disruption of the materials that build our cities, feed our populations, and power our technology.
Below are the main commodities that pass through the Strait and how the current war is impacting their supply and pricing.
1. Energy: The Lifeblood of the Global Economy
The Strait of Hormuz is the primary conduit for energy moving from the Persian Gulf to the rest of the world.
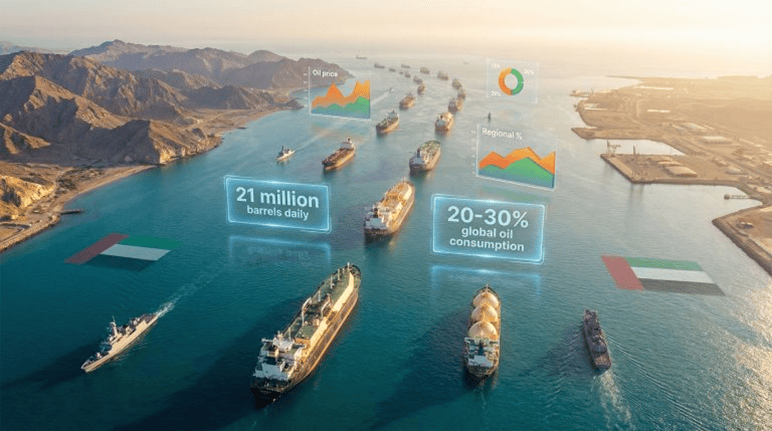
Crude Oil & Petroleum Liquids: Roughly 20–21 million barrels per day (bpd)—about 20% of global consumption—transit the Strait.
Impact: Since the escalation on February 28, 2026, oil prices have been highly volatile. Brent crude spiked from around $70 to a peak of nearly $120 per barrel before stabilizing near $90.
Supply: Most exports go to Asia (China, India, Japan, South Korea). With the Strait effectively under blockade, these nations are facing immediate supply shortages.
Liquefied Natural Gas (LNG): About 20% of the world’s seaborne LNG passes through the Strait, almost all of it from Qatar.
Impact: QatarEnergy recently declared force majeure and suspended production at its main facilities following regional attacks. This has caused European natural gas futures to jump by over 70% in early March.
2. Agriculture: The Fertilizer Crisis
While less discussed than oil, the Strait is a critical chokepoint for the materials that grow the world’s food.
Fertilizers (Urea, Ammonia, Phosphates): Between 25% and 33% of the global seaborne trade in fertilizer raw materials passes through the Strait.
Impact: Regional producers like Saudi Arabia and Iran are massive exporters of urea. The “soft closure” of the Strait has halted these shipments, causing benchmark Egyptian urea prices to rise by more than 25%.
Economic Ripple: Because half of global food production relies on synthetic fertilizers, this disruption is expected to push up the prices of household staples like bread, pasta, and animal feed globally.
3. Industrial Metals: The Aluminum Squeeze
The Gulf region has become a major hub for high-grade industrial metals, which are now trapped behind the blockade.
Aluminum: The Gulf produces about 8% of the world’s aluminum. Smelters in Bahrain, Qatar, and the UAE rely on the Strait for both exporting finished metal and importing raw materials like bauxite and alumina.
Impact: Qatari smelters (like Qatalum) have begun shutting down due to gas supply suspensions. This “dual squeeze”—blocking both raw material imports and finished metal exports—has sent aluminum prices soaring on the London Metal Exchange.
4. The Middle East: The World’s Sulfur Engine
The Persian Gulf region accounts for approximately 50% of the global seaborne sulfur trade. It is produced primarily as a byproduct of natural gas processing and oil refining at massive hubs like Ras Laffan (Qatar) and Ruwais (UAE).
Impact: Closing the Strait of Hormuz halts both the fuel and the feedstock for sulfuric acid—the most produced chemical on Earth. Without this acid, we lose the ability to extract copper and cobalt. No copper or cobalt means no EV batteries, no power transformers, and no data center hardware.
In summary, the crisis in the Strait of Hormuz is a stark reminder that our globalized economy is only as resilient as its most narrow corridor. We have long viewed this waterway through the lens of oil prices, but the events of March 2026 have proven that the stakes are far more complex. When the Strait closes, the world loses more than just fuel; it loses the LNG heating European homes, the aluminum framing our modern architecture, the fertilizers sustaining global agriculture, and even the airfreight capacity that moves our electronics and medicines. The ‘Hormuz Factor’ is not merely an energy shock—it is a systemic threat to the physical materials that build and feed our world. Let’s hope we can get a quick resolution to this ill-advised war.
Please comment or send an email if you have any questions.
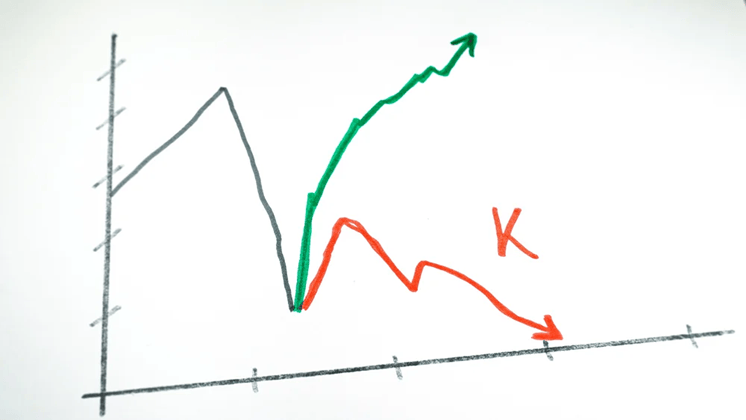
A K-shaped economy describes a situation where, following an economic downturn (pandemic), different parts of the economy recover at vastly different rates, resembling the two legs of the letter “K”. The key characteristic is the widening gap between the wealthy, who see their fortunes rise, and lower-income individuals and some industries, who continue to struggle. Looking back, this started shortly after the pandemic shutdown and the divergence between the upper- and lower-income legs became more evident once the federal government stopped the covid relief payments.
Let’s break it down.
Pros of the K-Shaped Economy (The Upper Leg)
The upper leg of the “K” highlights robust growth in certain areas, which can benefit the overall economy in specific ways:
Innovation and Productivity: Sectors that thrive, often driven by technology and large-scale investment, experience rapid innovation and high productivity. This leads to strong corporate profits and stock market performance.
Targeted Investment: The success of leading industries attracts significant investment, which further fuels growth in those areas (e.g., AI infrastructure and data centers).
Economic Resilience (for some): High-income households benefit from appreciating assets (stocks, real estate) and can maintain high consumer spending, which props up a significant portion of the overall economy.
Examples of the Upper Leg:
Technology Companies: Firms involved in software, artificial intelligence, and cloud computing (e.g., the “Magnificent 7” tech stocks) have seen immense revenue and stock price growth.
Wealthy Households: Individuals with significant financial investments see their net worth climb due to strong market performance and asset appreciation.
Premium Goods/Services: Companies selling high-end products, like luxury cars or premium airline seating, experience strong demand from affluent consumers.
High-skill Professionals: These individuals often maintain job security and can benefit from remote work flexibility and rising wages.
Cons of the K-Shaped Economy (The Lower Leg)
The lower leg reveals significant challenges, primarily centered around growing disparity and economic strain:
Widening Inequality: The most significant downside is the exacerbation of the gap between the rich and poor, leading to a less equitable society.
Financial Strain: Lower-income individuals face immense pressure from stagnant wages, high inflation, surging debt, and rising costs for essential goods like housing and groceries.
Unsustainable Growth: An economy propelled largely by the wealthiest 10% (who account for about half of all spending) may not be sustainable long-term. If the struggling majority cuts back spending significantly due to financial distress, it could pull the entire economy into a recession.
Policymaking Challenges: The K-shape makes it difficult for policymakers to implement broad stimulus actions, as measures that help the struggling lower leg (e.g., low interest rates) might overheat the booming upper leg, and vice versa.
Examples of the Downward Leg:
Service & Hospitality Industries: Businesses like restaurants and hotels have struggled with recovery, job losses, and revenue drops.
Lower-Income Households: This group faces increasing debt, stagnant real wage growth, and higher rates of loan delinquencies.
Younger Generations: This group often face greater challenges, grappling with student loans and high costs for necessities like housing and groceries.
Small Businesses: Many small, brick-and-mortar retailers and other local firms have been hit hard, lacking the capital and digital infrastructure of larger corporations.
It is also important to note that the current administration’s trade policies, particularly the tariffs, have made this situation so much worse for lower income households and small businesses.
To summarize, the K-shaped economy creates a significant increase in wealth inequality. While overall economic indicators like GDP or the stock market may appear strong, they don’t tell the full story, as many people are left behind. This divergence can create an economy that relies heavily on the spending of a small, wealthy segment of the population, which is not sustainable in the long term.
Please comment or send an email if you have any questions.
The Federal Open Market Committee (FOMC) just cut its benchmark interest rate, known as the federal funds rate, by a quarter-point (0.25%), bringing the target range to between 4.00% and 4.25%.
This can be considered a continuation of an easing cycle (period of lowering interest rates) that started back in September of 2024 but had been paused at the beginning of this year due to the uncertainty of how the new administration’s trade and immigration policies were going to affect prices and unemployment.
Since then, the data has shown that inflation has picked up mainly due to tariffs but not as much as expected. Our businesses are not passing on the full cost of the tariffs to their customers….for now. However, the labor market has weakened significantly in that same time span. Typically, when inflation picks up, raising rates helps cool it down. When unemployment increases, lowering rates is the standard response to help support employment. This dilemma of rising inflation and rising unemployment, aka stagflation, put the FOMC in a quandary for most of 2025.
Ultimately, at their last meeting, the FOMC chose to prioritize the battle against rising unemployment and restarted their easing cycle by cutting rates.
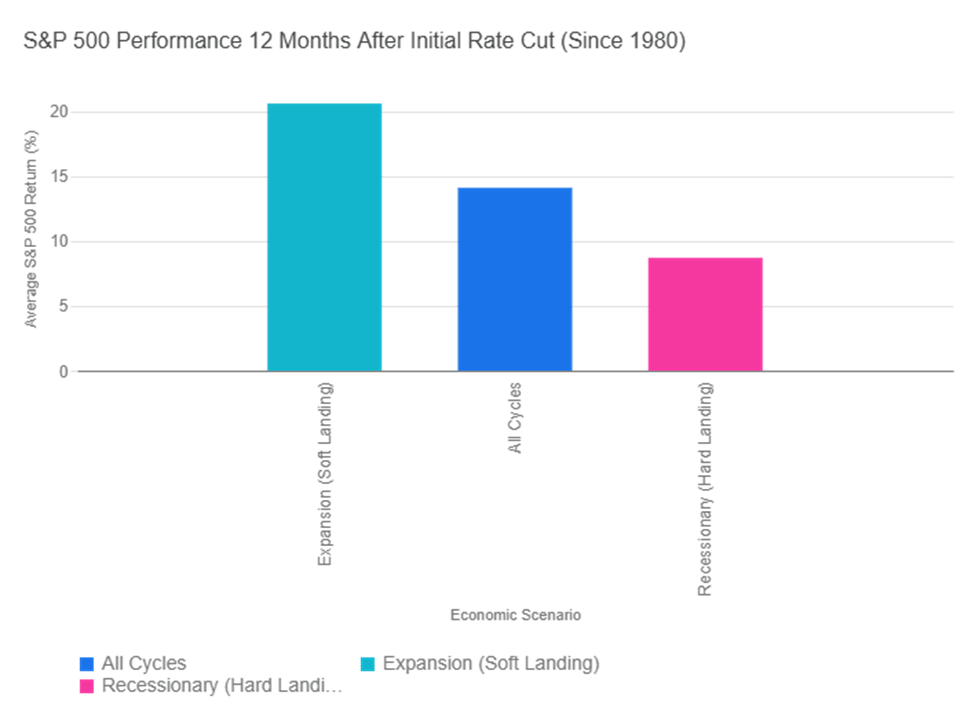
So, how will this affect the stock market? Historically, the market has performed well when interest rates are cut. The graph below illustrates the historical performance of the S&P 500 Index in the 12 months following the Federal Reserve’s first interest rate cut in a new cycle (since 1980). The returns vary significantly based on the underlying economic conditions, but they have always been good for stocks.
If we consider the start of the easing cycle to be September of 2024, we are now at a full year following the first rate cut. Interestingly enough, the S&P 500 has returned about 15.3% for that period, which coincides with its historical returns, as seen on the graph.
Does that mean we are due for a pullback? Not necessarily. If we continue on the trajectory of the soft landing that we were headed for at the beginning of this year, stock prices could continue to move higher. But, if inflation persists and unemployment continues to rise, we could be heading for a downturn.
The S&P 500 is also approaching a significant milestone: 3 years of consecutive double-digit returns. Stringing together three or more years of positive double-digit returns is rare but it happens.
Period (Start Year)
Length of Streak (Years)
Early 1930s (e.g., 1933–1936)
4
World War II / Post-War (e.g., 1942–1945)
4
Post-War Boom (e.g., 1949–1955)
7
Mid-1960s (e.g., 1963–1967)
5
1990s Tech Boom (1995–1999)
5
Post-Financial Crisis (e.g., 2012–2014)
3
Post-Pandemic Era (2019–2021)
3
We will see if stocks can make history as we head into the home stretch of 2025.
Please comment or send an email if you have any questions.
The Fed, specifically, the Federal Open Market Committee (FOMC), is not having their monthly meeting this August but many of the members are gathering this week in Jackson Hole, Wyoming with a bunch of financial big shots for their annual summer conference. The investment world will be tuning in to get any hints on what they plan to do with interest rates when they meet in September. So, I thought it would be a good time to review what happens when the Federal Reserve changes interest rates.
When the FOMC changes interest rates, they aren’t changing every rate out there. They are only changing the Federal Funds Rate (FFR). This is the rate that banks charge each other for overnight loans. Modifying this rate is one of the Fed’s tools that they use to maintain a healthy economy. They lower it if they feel the economy is slowing and raise it if the economy is heating up too quickly.
For example, if unemployment is trending up, the Fed would be more inclined to lower rates. If consumer prices (inflation) are going up at a higher rate than expected, they would consider raising rates to slow the increase.
Although you probably have never heard of the Fed Funds Rate, it does influence many of the interest rates that you are familiar with and interact with every day. The FFR is the base that the cost of money in the banking system is built upon. In fact, the prime rate, which almost all bank loans are based off of, is derived from the FFR and is typically 3% higher than the FFR.
Now, let’s take a look at the table below that shows what is expected with various rates and other economic factors when the FOMC changes the Fed Funds rate:
When FOMC raises the FFR, plan on:
When FOMC lowers the FFR, plan on:
Mortgage rates
Higher
Lower
Car loan rates
Higher
Lower
CD rates
Higher
Lower
Money market rates
Higher
Lower
Credit card rates
Higher
Lower
Business profits
Lower
Higher
Stock market
Lower
Higher
Consumer spending
Lower
Higher
Home sales
Lower
Higher
These expected changes don’t happen overnight. It takes time for the Fed’s actions to trickle down to other rates and markets. For instance, if the Fed raises the FFR, the stock market might not go down until rates are high enough in other investments, such as bonds or CDs, to justify the shift from stocks to those other investment options.
This should give you a better understanding of what is happening when you hear that the Fed is changing interest rates.
Please comment or send an email if you have any questions.
Stocks stayed in the green for the third month in a row, climbing a wall of worry built mainly from tariffs. The index reached a series of new all-time highs, driven by strong performances in Q2 by our home-grown big technology companies.
For the month of July, the S&P 500 rose a respectable 2.2%, even with a pretty big drop in the last days of the month. That beat the historical July average of 1.28% and now takes the index to a year-to-date return of 8.50%.
The usually quiet summer months for stocks are anything but this year. With most of the Q2 earnings posted already, the stock market is now going to be fixated on trade policy, the job market, inflation, and interest rates. Each of these four elements can provide a boost or a bust for stocks over the next month. If the new tariffs that were recently implemented stay in place, inflation is going to continue higher as it has over the past few months. Layoffs from both the public and private sectors are now showing up in the data as the effects of DOGE, trade, and immigration policies take hold. Companies are embracing AI to reduce payroll as well. The Federal Reserve is more likely to cut interest rates by their September meeting (no meeting in August) now with the recent poor jobs data most likely outweighing the rising inflation data.
The good news is, as I have said many times this year, the economy can get back on track if we get rid of the tariffs and instead negotiate trade deals with our allies that are beneficial to both parties. This would especially help our small businesses that can’t afford to pay these levies and still remain viable. It would also benefit those that are in the lower- and middle-income tiers that can’t afford the price increases that our companies will have to pass on to their customers due to the tariffs.
Historically, August has been a pretty boring month for stocks, with an average return of about 0.5%. I think this August could be a little more exciting, to say the least.
Take a look at the Outlook section below to see what events could move the markets over the short term.
Bond prices were flat to slightly lower during July as the economy began to show signs of slowing, increasing the potential for short-term interest rates to be lowered by the Federal Reserve. Although the Federal Reserve held rates unchanged after their July meeting, sentiment increased sharply for a cut by the time that they meet again in September due to the poor jobs report that came out just after the Fed concluded their meeting.
While there is a recovery in market sentiment after a temporary pause on new tariffs, concerns over the long-term impact of trade policies and geopolitical risks still persist. This kind of uncertainty can drive investors toward safer assets like bonds, particularly government bonds, increasing demand and pushing prices up. We will most likely see this price action continue if the most recent tariffs stay in place for any significant period of time.
The 10-year US Treasury note yield finished higher in July, settling at 4.36%, higher than the 4.23% yield that it was at the beginning of the month. The 30-year bond yield closed out the month at 4.89%, about 12 basis points higher than a month ago.
With all of the uncertainty in the bond market, it is prudent to invest in bonds that mature sooner rather than later. I like bonds with a 12-to-18-month maturity and plan on holding onto them until they do mature.
Savings rates didn’t move much in July. Money market rates and bank savings accounts are averaging only about 0.46% but the best rates can be found at credit unions and online banks with rates approaching 4.5%. It is worth it to do some research here. With rates staying above 4%, I think more money is going to be funneled into the safe havens of money markets and CDs as the stock market rebound is showing signs of fatigue. So, CDs and MMAs continue to be a great place toput your cash and your emergency fund, for now. Knowing this, it makes sense in most situations to put cash that you don’t immediately need into CDs with up to 2-year maturities. For emergency cash, stick to high yielding money market and savings accounts, of which the best are yielding about 4.4%. As always, keep the total under $250,000 per person at any one bank to ensure you are fully covered by the FDIC.
Mortgage rates mirrored other rate categories and had little movement this past month. The expectations were low for any changes in rates by the Federal Reserve, so this was expected. Higher housing inventory continued to put downward pressure on mortgage rates as well. Active listings rose for the 21st consecutive month, but overall inventory remains below pre-pandemic levels. It has become a buyers’ market in most parts of the country, but prices are still historically high and coupled with high mortgage rates, makes home purchases out of reach for many, especially first-time home buyers.
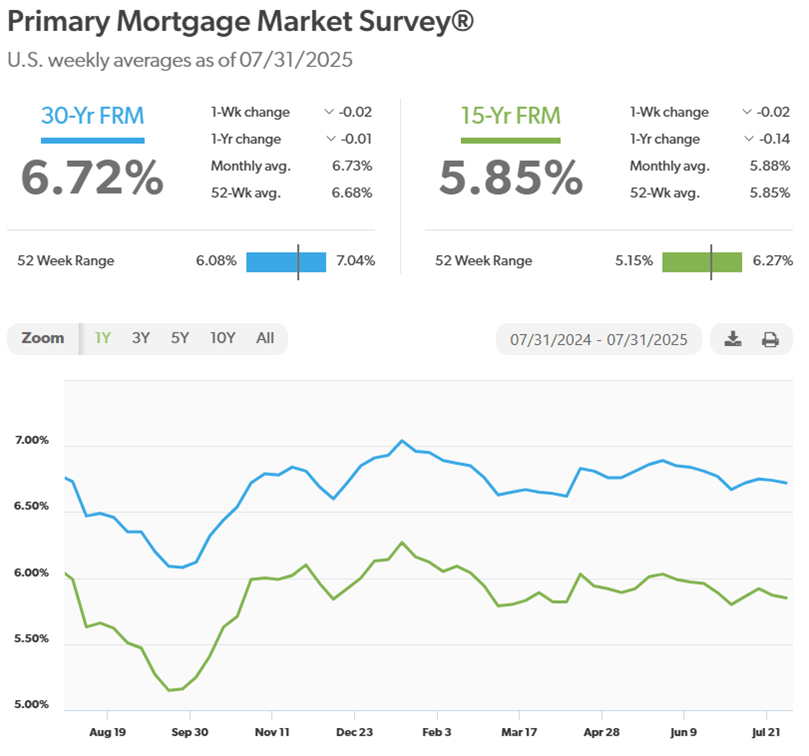
The 30-year fixed rate finished the month at 6.72%, still within the narrow range of 6.5% and 7% that it has been in since October of last year. The trade and immigration policies are causing higher raw materials and labor costs for homebuilders and are starting to show up in new home prices now, making it even harder to afford a new home.
Here is a look at the one-year chart of the 15- and 30-year mortgage rates from Freddie Mac.
Oil prices were much calmer in July than they were in June of this year. That is, until the last week when oil prices surged due to renewed geopolitical risk causing a disruption in the global oil supply. Specifically, when the U.S. issued a deadline to Russia to end the war in Ukraine, threatening additional sanctions and tariffs on countries that continue to buy Russian oil. This, coupled with the seasonally strong summer demand could keep prices elevated at least through the end of August.
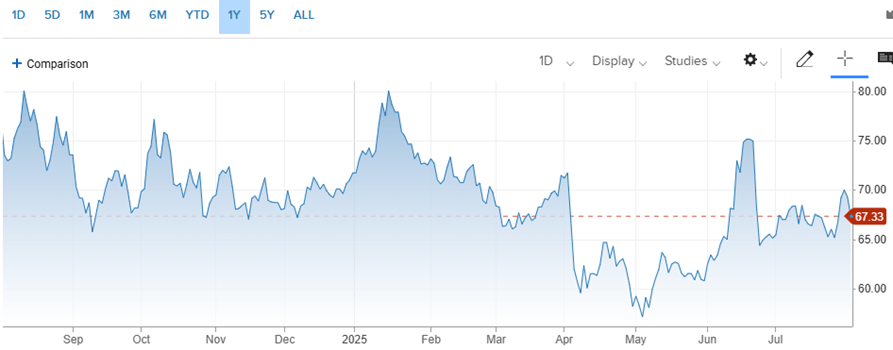
For the month, the price for a barrel of oil closed at $69.26, up from $65.11 at the beginning of July. For the year, it’s down about 3.40%. We certainly don’t want to see oil prices going higher now because that will raise the input costs for companies even higher as the tariffs take hold.
Here’s a look at the one-year chart for U.S. oil:
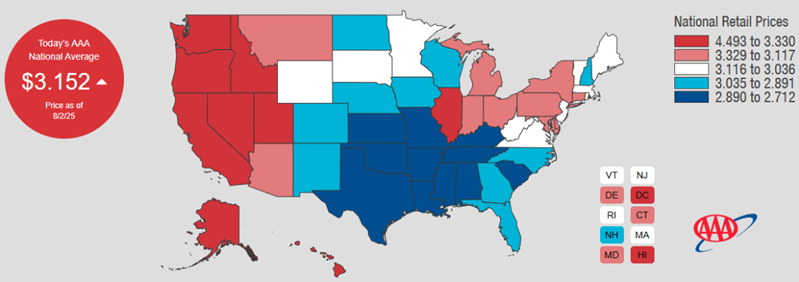
Gasoline prices dipped slightly in July. Regular unleaded gasoline is now averaging $3.15 per gallon, down four cents from last month. However, gas prices could be heading higher in the near future for reasons stated above in the oil prices section. Mississippi has the cheapest gas currently, checking in at $2.71 a gallon. California has the most expensive gasoline at $4.49 per gallon. FYI, a year ago, we were paying $3.48.
Check out the prices at the pump in your area: AAA Gas Prices.
Outlook
Events on the horizon that could move the markets in the near term:
Fed & Inflation: The Federal Reserve had started leaning towards cutting rates even before the bad jobs report came out this past Friday. Cracks have begun to appear in our resilient labor market as layoffs from DOGE and the private sector are reflected in the latest data. Also, inflation is picking up as U.S. companies begin to raise prices to offset the tariffs they are paying on imported goods and raw materials. Higher unemployment and higher prices, aka stagflation, is a tough scenario for the Fed to fight at the same time. Right now, it looks like they need to focus on the labor side of the equation, which would mean to cut rates. However, they have to tread carefully because lower rates combined with tariffs could lead to runaway inflation, which would be devastating to the economy. The ideal situation would be if we cut rates and removed the tariffs. That would help our economy recover and spur growth. I’m still hopeful.
Trump Administration Policies: The trade war is back on the front burner as tariffs are assessed on almost everything that our companies import for the products that they produce. As a reminder, the tariffs that we have been talking about this year are fees that U.S. companies pay our government. I like to think of these tariffs simply as an increase in the corporate tax for our companies. It basically increases the cost of doing business. So, in order for companies to keep the same profit margins pre-tariff, or in the case of many small businesses, to remain profitable at all, they have to either raise the prices that they charge their customers, lower expenses in other areas of their business, or a combination of both. Regardless of which avenue a company chooses, our economy will suffer, especially our small businesses and our lower income population that is already living paycheck to paycheck. As I said last month and will keep saying, the government needs to scuttle this absurd tariff strategy and go back to the drawing board to put together a plan that is realistic and can meet their objectives without damaging so many industries and so many lives. It’s not too late to save our small businesses, keep inflation in check, and get our economy back on track.
The economic stars were aligning beautifully at the beginning of the year for the Federal Reserve to start to gradually lower interest rates in 2025. Then, in February our economy, and much of the world’s economies, were upended with a shock and awe tariff policy by the Trump administration. This, coupled with changing global perceptions of U.S. governance and institutions has forced the Fed to rethink its interest rate strategy. Subsequently, the odds of any rate cuts this year have dropped significantly since the end of 2024.
Here are the main suspects that may keep interest rate higher for the foreseeable future:
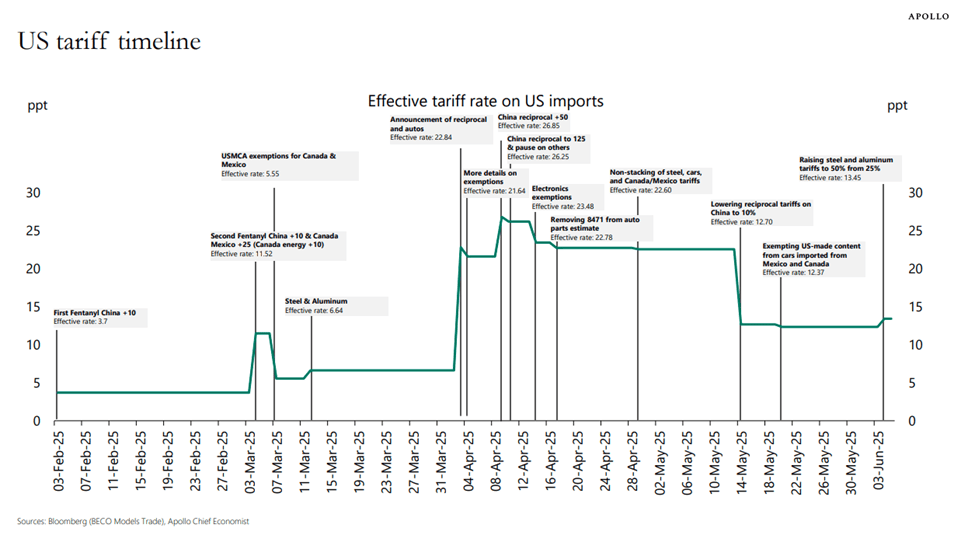
Tariffs: This chart summarizes the effective tariff rate that U.S. companies have had to pay since February:
The green line shows the effective tariff rate from February to June of this year. Prior to February, the U.S. was paying an effective tariff rate of about 2.4%. Currently, we are paying an effective rate of 13.45%. We were as high as 26.85% in April, so we have come off of the highs but still are at a level that is almost 6 times what we were paying at the start of the year. Now, it’s showing up in the prices that we are paying and also in the number of small businesses that have had to lay off workers, suspend operations, or shut down completely. This increase is just not sustainable and higher prices mean rates have to stay high to fend off runaway inflation.
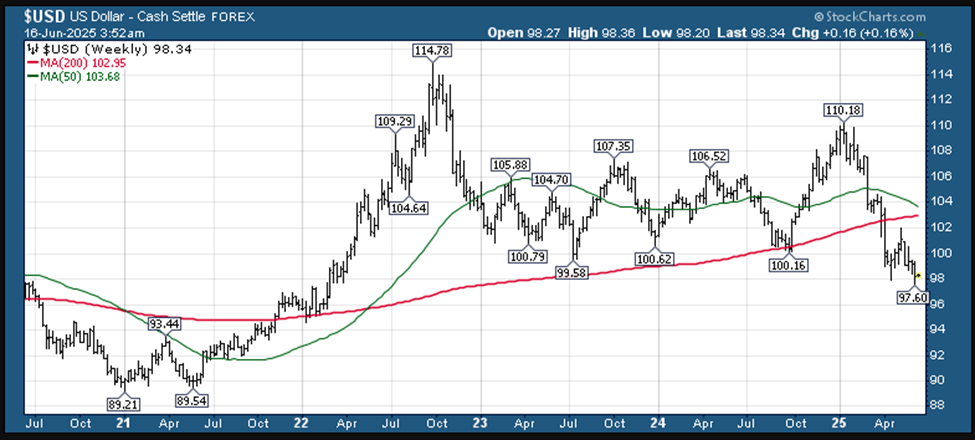
Weaker Dollar: Take a look at this chart of the US Dollar hitting a 3-year low recently.
The black is the dollar index value, the red is its 200-day moving average and the green is its 50-day moving average. There are several factors contributing to the downward pressure on the U.S. dollar, including:
Tariffs and Trade Policy
Global Concerns about U.S. Economic Growth and Recession Risks
Fiscal Deficit and Debt Concerns
Erosion of U.S. Except
In essence, a combination of protectionist trade policies, concerns about the U.S. economy’s resilience, fiscal anxieties, and a shift in global investor sentiment are all contributing to the weakening of the U.S. dollar in 2025. A weaker dollar is inflationary and another reason for the Fed to keep rate elevated.
As I have said before, these issues are self-inflicted, which means they can be resolved quickly if we act now. The longer these policies are in place, the harder it will be to recover from them. Then, the Federal Reserve will have to lower interest rates but for all the wrong reasons, aka a recession.
Please comment or send an email if you have any questions.
In my last post, I talked about how our tariffs could adversely affect the 33+ million small businesses in the U.S. Today, I want to continue that discussion but go into a little more detail with some interesting illustrations that show the contribution that our small businesses have to our economy.
Tariffs have been used throughout history to protect domestic industries. When implemented tactically on certain materials or products within a broader, strategic economic plan, they have had some success. However, when you carpet-bomb everything simultaneously that is imported into our country with tariffs without letting our companies prepare and plan, it results in chaos, as we have seen already.
When our government implements very high tariffs suddenly, they impact many businesses, particularly small businesses, because the tariff must be paid by the business when the imported goods arrive in the US. Small businesses that have relied on a stable US system for decades need to adjust quickly and may not have the working capital to pay tariffs. Ships might remain offshore, orders could be canceled, and many small businesses may face bankruptcy.
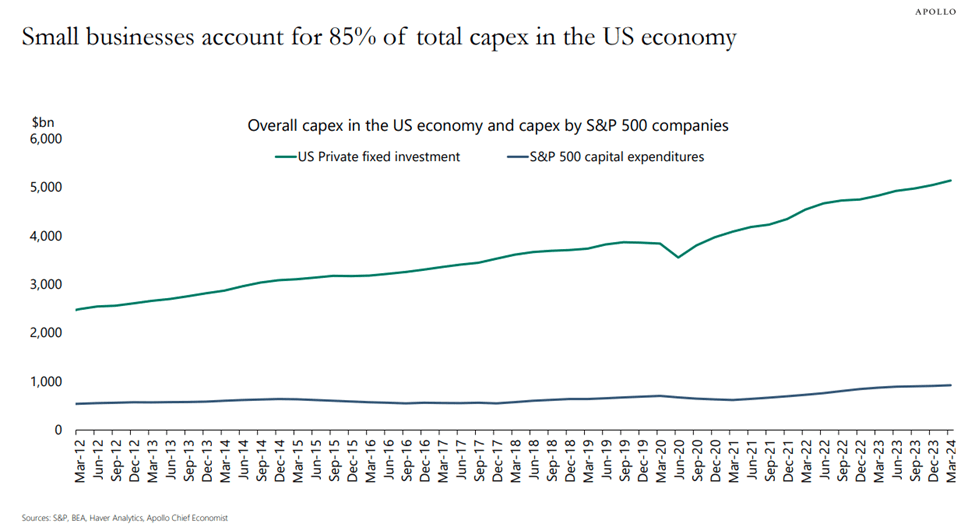
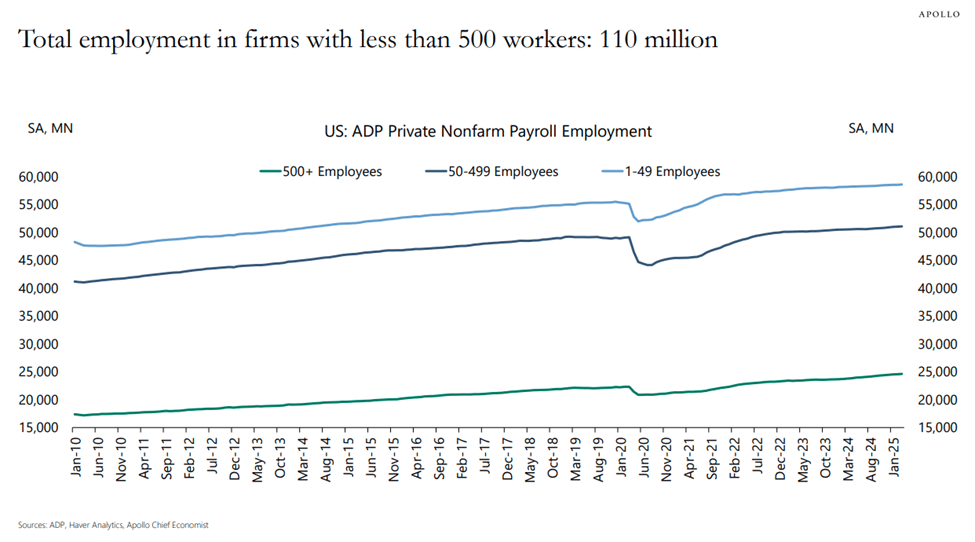
There have been some exceptions for large businesses, but they are the companies that need them the least. These massive corporations have the flexibility and the resources to handle unforeseen expenses. Not giving the same breaks to small businesses does not make any sense. Just look at these charts below to see why:
This shows that 85% of the capital expenditures, basically the money that businesses reinvest into themselves to expand and grow, in the US economy comes from small businesses. These guys should be getting the tariff exemptions.
Here we see that small businesses (less than 500 employees) account for 110 million workers of the labor force, approximately 75% of the total number of workers employed in the country. Damage to this large of a swath of the economy would be devastating.
So now, the challenges for small companies have become a big problem for the US economy. Even if tariffs get knocked down substantially from their current high levels, many small businesses will not be able to absorb the costs and will have to pass the costs onto their customers, reduce their payroll, or worse, shut down.
Let’s hope we abandon the blanket tariff policy and instead develop a long-term plan along with our trading partners that will benefit all parties.
Please comment or send an email if you have any questions.