Why Small Businesses Will Be Hurt Most by Tariffs

I thought I’d take a look at how the current trade war could affect the small business community here in the U.S.

First , let’s look at some numbers. There are 33.27 million small businesses in the U.S. with fewer than 500 employees. These businesses employ 61.6 million people, which is 45.9% of the U.S. workforce, and account for 33% of the country’s imports.

For those that don’t know, the tariffs that we have implemented so far this year are levies, or fees, on imported goods to the U.S. that have to be paid by the company that imports them. These tariffs are hitting small businesses particularly hard, since they almost all rely on some quantity of imported materials. Unlike large corporations, small businesses often lack the financial cushion to absorb rising costs, forcing them to either raise prices or take a financial hit. Also, many small retailers and manufacturers are struggling with uncertainty, as tariffs have been fluctuating, making it difficult to plan ahead.

Here’s a detailed breakdown on how the imposition of tariffs can significantly impact small businesses:

Increased Costs of Goods:

  • Imported Materials and Goods: Many small businesses rely on imported raw materials, components, or finished goods. Tariffs, being taxes on these imports, directly increase their cost. For example, a local furniture maker importing wood or hardware will face higher expenses.
  • Reduced Profit Margins: Unless small businesses can pass these increased costs entirely to their customers, their profit margins will likely shrink. Small businesses often operate with tighter margins than larger corporations and have less capacity to absorb these additional expenses.
  • Cash Flow Strain: Higher upfront costs for imported goods can strain the cash flow of small businesses, potentially affecting their ability to manage day-to-day operations and invest in growth.

Price Increases for Customers:

  • Passing on Costs: To maintain profitability, small businesses may need to increase the prices of their products or services. This can make them less competitive compared to larger businesses that might absorb some of the tariff costs or domestic producers not subject to these import taxes.
  • Loss of Customers: Price-sensitive customers might opt for cheaper alternatives from competitors, leading to a decrease in sales volume and customer loyalty for the small business.

Supply Chain Disruptions:

  • Difficulty in Sourcing: Tariffs can disrupt established global supply chains, making it harder for small businesses to obtain the necessary goods or materials. This could lead to production delays, an inability to fulfill orders, and a loss of customer trust.
  • Finding Alternative Suppliers: While businesses might look for domestic suppliers or suppliers in countries not affected by tariffs, this shift can be time-consuming, costly, and may not always offer the same quality or price. For instance, a small electronics repair shop that relies on specific imported components might struggle to find suitable local alternatives quickly.

Reduced Competitiveness:

  • Against Larger Businesses: Larger companies often have more leverage to negotiate with suppliers, find alternative sourcing, or absorb tariff costs due to their scale. This can put small businesses at a significant competitive disadvantage.
  • In Export Markets: When the U.S. imposes tariffs, other countries often retaliate with their own tariffs on U.S. exports, which we have already seen. This can harm small businesses that export their products, making them more expensive for foreign buyers. For example, a local artisan food producer exporting to a country that imposes a retaliatory tariff will see their goods become pricier in that market.

Uncertainty and Investment:

  • Difficulty in Planning: Fluctuating tariff policies create uncertainty, making it difficult for small businesses to plan for the future, make investments, or forecast their financials accurately.
  • Hesitation in Growth: The unpredictable economic climate caused by tariffs can make small business owners hesitant to expand their operations, hire new employees, or invest in new equipment.

To summarize, tariffs pose significant challenges for small businesses, primarily through increased costs, potential price hikes, supply chain disruptions, and reduced competitiveness. Finally, as history has taught us, there are no winners in a trade war. Hopefully, we can get that message through to the Trump administration sooner rather than later.

Please comment or send an email if you have any questions. Thanks!

Joe Baker, CFP®

Baker Asset Management, LLC

joebaker@bakerassetmanagement.com
US Balance Sheets Looking Strong Heading Into 2025

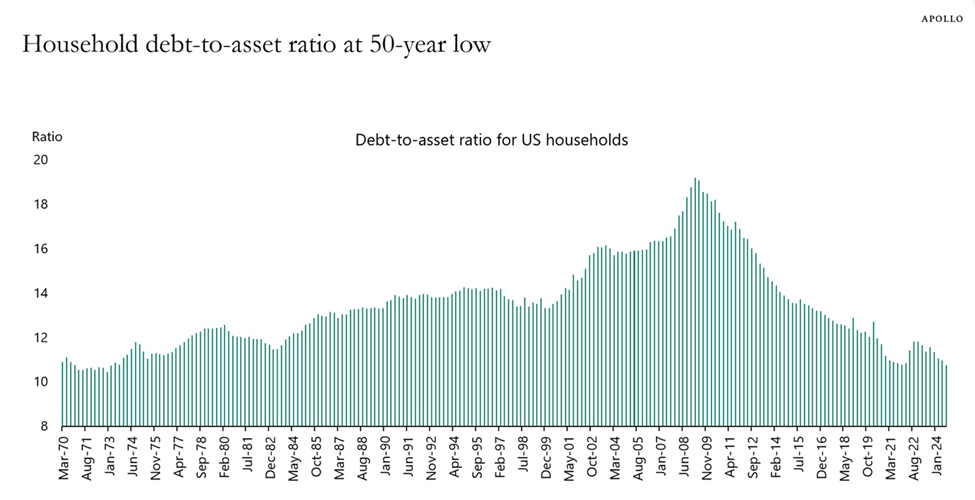
Financially speaking, U.S. households are looking strong heading into 2025. In fact, they have never looked better. Just check out the following chart to see how we are doing compared to the last 50 years:

Source: Federal Reserve, Haver Analytics, Apollo Chief Economist

As you can see, we have come quite a long way from the Great Financial Crisis era in 2008/2009 and are at levels that we haven’t seen since the early 1970’s. There are a few key reasons for such a strong showing:

  • Home prices have increased at a much faster rate over the past fifteen years than in the past. This has improved the asset side of the balance sheet.
  • More homes are now owned outright (no mortgage) or have mortgages at a 3% rate or lower than ever before. This has helped reduce household debt quite a bit.
  • Stellar stock market returns over the past two years have bolstered people’s retirement and investment accounts, thereby increasing their assets and subsequently, their net worth.

Can it keep going?

It’s possible. We still have a shortage of housing which will keep upward pressure on home prices. But mortgage rates are still relatively high which could increase the debt side of the balance sheet of new homeowners.

Regarding stocks, history is on our side. For instance, the S&P 500 has a history of delivering strong gains following two consecutive years of 20%+ gains, which we just had. Since 1950, there have been eight instances where the S&P 500 index has risen by 20% or more for two consecutive years. In six of those cases, the U.S. stock market achieved positive returns in the third year, with an average return of 12%.

Obviously, it’s always tough to predict what’s going to happen over the course of the next year but it’s good to know that we are in a great position now, regardless of what the future holds.

Please comment or send an email if you have any questions.

Joe Baker, CFP®

Baker Asset Management, LLC

joebaker@bakerassetmanagement.com
Monthly Update – January 2025

Calendar Notes

  • Wednesday, January 1st – New Year’s Day: Stock market is closed.
  • Thursday, January 9th – National Day of Mourning for President Jimmy Carter – Stock market is closed.
  • Monday, January 20th – Martin Luther King, Jr. Day – Stock market is closed.

Stocks seemed a bit tired in December as the year-end rally flamed out. I can’t blame them. They worked hard all year, and it showed, racking up a 20%+ return for the second year in a row. This hasn’t happened since the 1990’s, which sounds so long ago. The biggest catalysts for this performance were the continuing AI expansion on all fronts as well as inflation dropping substantially over the past year.

For the month, the S&P 500 dropped about 2.5%. However, it was still able to finish the year with a gain of over 23.3%.

Looking ahead, we will have Q4 earnings reports coming out in a few weeks. Also, Trump and his new administration will be coming in later this month. Finally, the Federal Reserve meets at the end of the month in a very cloudy interest-rate environment. Those are some pretty big catalysts that can move the markets, making for a very busy start to the year.

Historically, January has been a good month for stock performance. It has also been a pretty accurate indicator of how stocks will perform the rest of the year. For instance, when stocks have a positive January, full year returns have been positive 77% of the time. Let’s hope history repeats itself this month.

Take a look at the Outlook section below to see what events could move the markets over the short term.

Bond prices flip flopped once again, reflecting the uncertainty in the current interest rate environment. Both corporate and government bond prices fell during the month of December as new inflation data coming in showed that inflation is stickier than anyone expected. Still, the Federal Reserve did cut rates another 25 bps at their December meeting but where they go from here is anyone’s guess, including the Fed.

The 10-year US Treasury note yield finished higher in December, settling at about 4.57%, above the 4.18% that it was at the beginning of the month. The 30-year bond yield closed out the month at 4.79%, higher than the 4.37% that it was a month ago.

Bond investors are waiting with bated breath for the new administration to get in office and lay out their plans for trade and immigration policies, which will heavily influence the direction of bond prices and their yields. We should get some clarity on those issues by the end of the month.

Savings rates either stopped dropping or even went up a little bit this past month. The change in direction is most likely due to the Fed’s talk of slowing down their pace of lowering short-term interest rates in 2025. The direction of where these rates are heading will continue to be uncertain until the inflation picture clears up, which will also depend on the incoming administration’s trade and immigration policies. That said, these rates are pretty good for savers and risk-averse investors. You can get above 4% return on your money currently. So, CDs and MMAs continue to be a great place to put your cash and your emergency fund, for now.

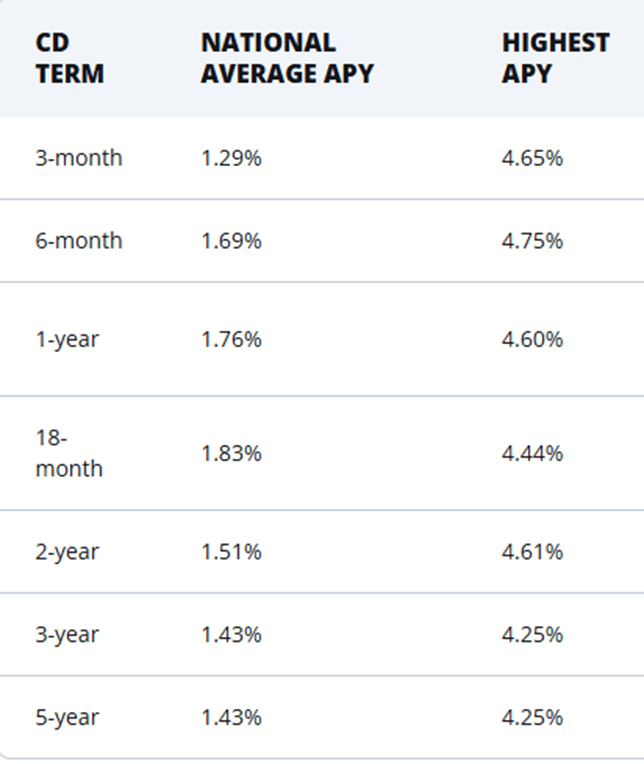
Now, take a look at the top rates for CDs and money market accounts (MMA):

MMA Rates

National AverageHigh Rate
0.66%5.00%

The best 1-year CD interest rate is currently at 4.60%, higher than last month. The best 5-year CD rate right now is around 4.25%, a 25-basis point rise from last month. Once again, MMA and traditional bank savings account rates changed very little from last month.

Savings rates are now in a holding pattern until we get a clearer picture on where interest rates are heading. This isn’t a bad thing, especially for risk-averse investors and savers. Knowing this, it makes sense in most situations to put cash that you don’t immediately need into CDs with up to 2-year maturities. For emergency cash, stick to high yielding money market and savings accounts, which are still yielding around 5%. As always, keep the total under $250,000 per person at any one bank to ensure you are fully covered by the FDIC.

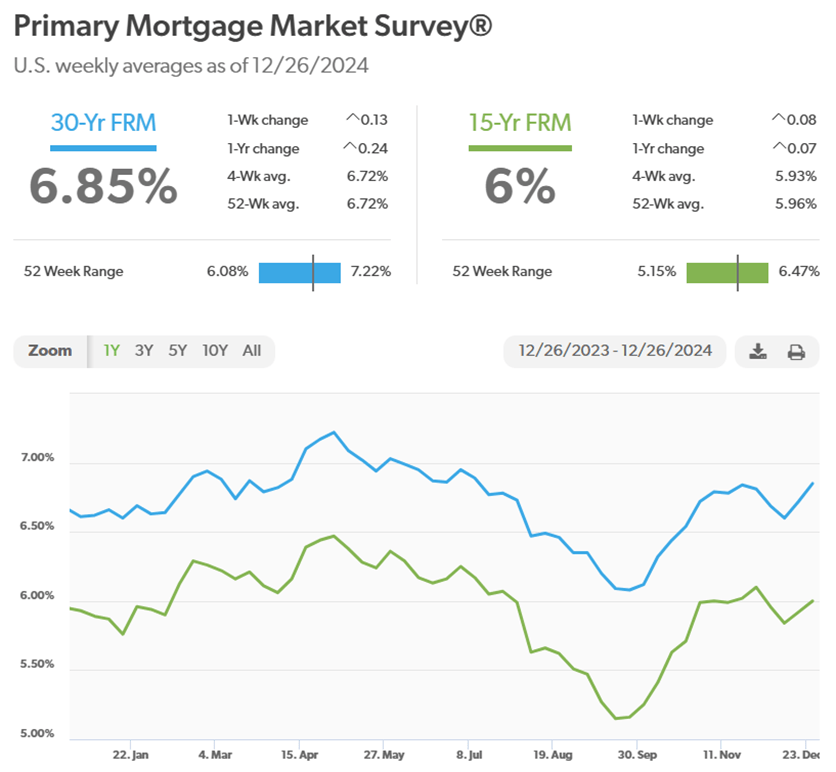
Mortgage rates stayed about the same as a month ago, with the 30-year loan getting ever so close to the 7% mark. Currently, the 30-year rate sits at 6.85%, slightly higher than a month ago, at 6.81%. There is still low inventory, especially for existing homes, so any drop in rates continues to be met with a quick surge in demand.

Oil prices headed higher as hopes of new drilling to lower oil prices were dashed by oil producers’ comments. It seems that these companies like high oil prices (shocking!) and don’t necessarily want to pump more oil. This is a global market that is motivated by profits, so it is difficult to tell them how much oil to produce unless they become operated by the government.

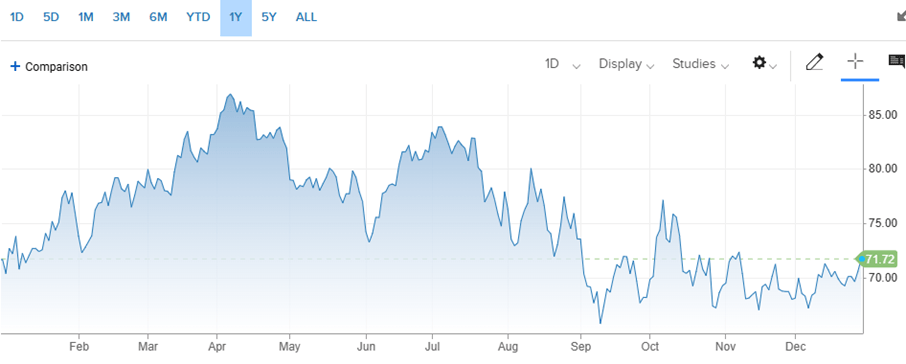
For the month, the price for a barrel of oil closed at $71.72, down from $68.15 at the beginning of December. For the year, prices ended right where they started in January. Getting oil prices below $70 for an extended period of time would help greatly in lowering the overall inflation rate.

Here’s a look at the one-year chart for U.S. oil:

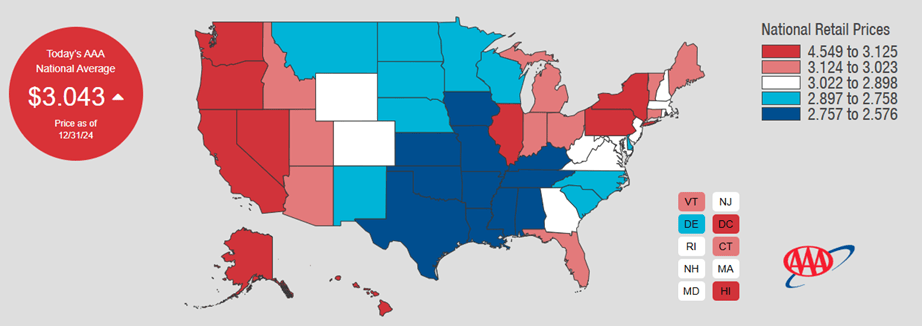
Gasoline prices lagged the rise in oil prices and fell once again in December, albeit barely. Regular unleaded gasoline is now averaging $3.04 per gallon, down from $3.06 last month. Oklahoma has the cheapest gas currently, checking in at $2.58 a gallon. Hawaii has the most expensive gasoline at $4.55 per gallon. FYI, a year ago, we were paying $3.11.

Check out the prices at the pump in your area: AAA Gas Prices.

Outlook

Events on the horizon that could move the markets in the near term:

  • Fed & Inflation: The Federal Reserve cut interest rates by another 25 basis points at their last meeting of 2024 a few weeks ago. They did state that they might not be as aggressive in cutting rates in 2025 as they thought just a few months ago. I believe they want to let the new administration get settled in to see what policies they plan to implement, particularly tariffs and mass deportation, since these could have a significant impact on inflation. We could know as soon as the end of this month so volatility in the stock and bond markets may be higher than normal this January.

Joe Baker, CFP®

Baker Asset Management, LLC

joebaker@bakerassetmanagement.com

Our Current Economy in Charts

I recently took a look at a whole bunch of economic data charts compiled by economists and strategists from the financial world. Much of this information shows that the U.S. economy can still achieve a soft landing coming out of the interest rate hiking cycle of the past few years.

Regarding the stock market, there are mixed reviews with some showing further room to run in this current bull market while others expect a pullback, especially with uncertainty picking up as we approach the November elections.

Here are a few of those charts that I wanted you to see:

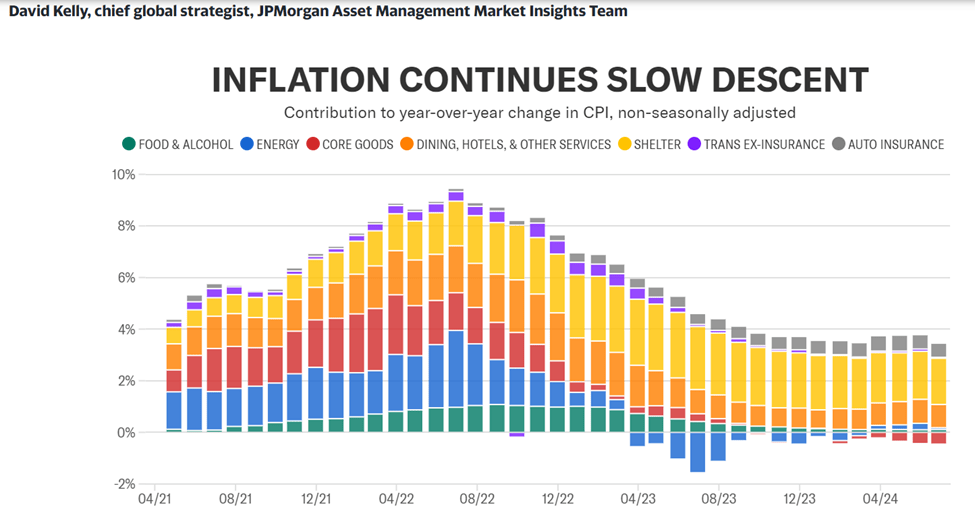
Shelter and auto insurance have been the two stubborn pieces of inflation that haven’t subsided yet. The good news is that rents and mortgage rates are rising much slower or even dropping in some areas, which should help get inflation down to the Federal Reserve’s target of 2% sometime in 2025.

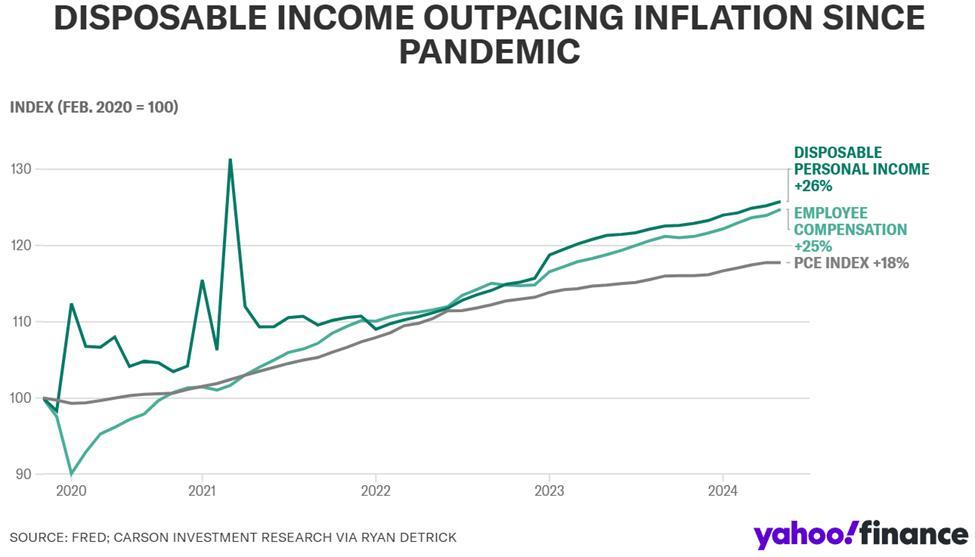
Because inflation has taken up all the oxygen in the room over the past few years, disposable income outpacing inflation is not a well-known statistic, but here it is. Both employee compensation and disposable personal income have increased more than inflation since the pandemic. Also, inflation is expected to continue to drop through the rest of this year, so consumers should see their disposable income increase, assuming their salaries remain the same.

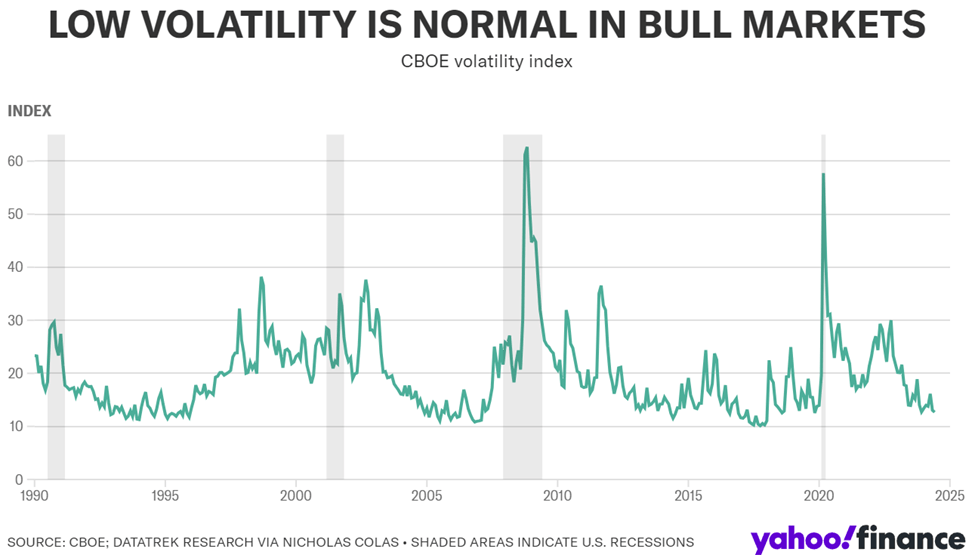
Chicago Board Options Exchange (CBOE) Volatility Index, more commonly known as the VIX, is an options-based measure of expected S&P 500 volatility over the next 30 days. When this indicator is consistently below 20, stocks tend to perform well. This was the case in the mid-1990s, mid-2000s, and much of the 2010s. When the VIX spikes, it is an indicator of a recession, of which the four most recent are shown as the shaded regions in the chart above. So, we could be in a period of low VIX, which is good for stocks, or about to enter a period where the VIX spikes. Interest rate and election forces will be what moves this index through the rest of this year.

To summarize, the economy and markets have done well so far in 2024 but it feels like we are at an inflection point now. The two big influencers are interest rates and the elections. These will dictate how we finish up in 2024. It should be an interesting ride into the end of the year.

Please comment or send an email if you have any questions.

Joe Baker, CFP®

Baker Asset Management, LLC

joebaker@bakerassemanagement.com

Monthly Update – May 2024

Calendar Notes

  • Saturday, May 4th, Kentucky Derby
  • Monday, May 27th, Memorial Day. The stock market is closed.

Stocks finally took a breather in April after a five-month run of positive returns. It’s always healthy for the markets to take a break and consolidate to form another base before moving higher again. So, this break in the upward trend is not surprising, but still not fun to watch if you are long stocks. For the month, the S&P 500 was lower by about 4.20%. For 2024, it is up about 5.57%.

Q1 earnings continue to pour in and, for the most part, have been exceeding expectations, supporting the strong economic data that we have seen so far this year. Of course, earnings reports are looking into the past and it is what companies say about future growth that really moves their stock prices. The good news here is that CEOs are signaling that strong revenue growth should continue, although they are concerned about interest rates staying elevated.

Historically, May has been a month where many traders, or short-term investors, like to prepare their portfolios for the summer. Like the saying goes, sell in May and go away. We will see if that holds true this month.

The Federal Reserve met today and held rates steady once again. They are certainly testing the patience of both stock and bond investors, but so far, their stance hasn’t broken the economic momentum that we have seen over the past year (yet).

Take a look at the Outlook section below to see what events could move the markets over the short term.

Bond prices continue to flip flop, this time heading lower during the month of April. This drop was mainly due to the continued signs of a strong economy and inflation remaining sticky in certain areas, such as food and fuel. This is certainly causing the Fed to rethink when they want to start cutting back on interest rates.

The 10-year US Treasury note yield rose in April, finishing the month at 4.69%, higher than the 4.21% that it was at the beginning of the month. The 30-year bond yield closed out the month at 4.79%, higher than the 4.35% that it was a month ago.

Although the path of interest rates still appears to be in the downward direction, it is not a given. Therefore, bond buyers should continue to focus on bonds with short-term maturities. I would keep maturities under 18 months and just plan on holding these bonds to maturity. That way, you won’t have to worry about selling at a discount if interest rates head higher.

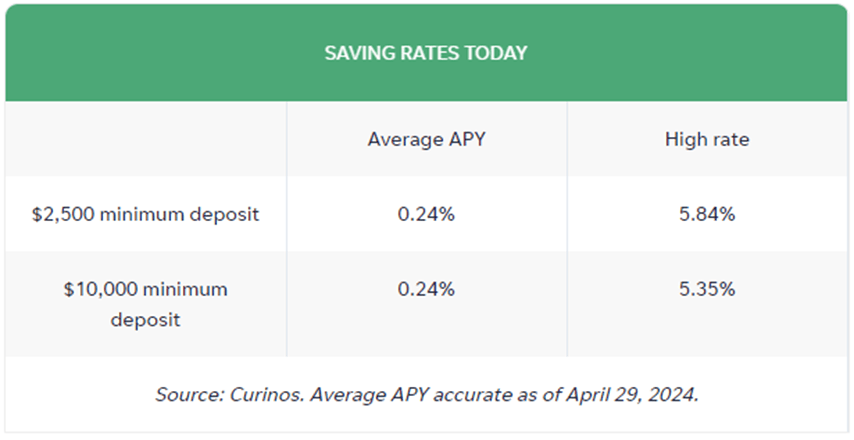
Savings rates stayed about the same in April as compared to March, even as other rates moved higher. But this is expected because savings rates typically follow, but lag, the direction of bond yields. These current savings rates are still quite high, especially with respect to inflation. So, CDs and MMAs continue to be agreat place to park your cash and your emergency fund. These rates continue to be a legitimate alternative to stocks and bonds and will keep pressure on those markets until we see this trend reverse, which looks like it will be happening later in the year than expected.

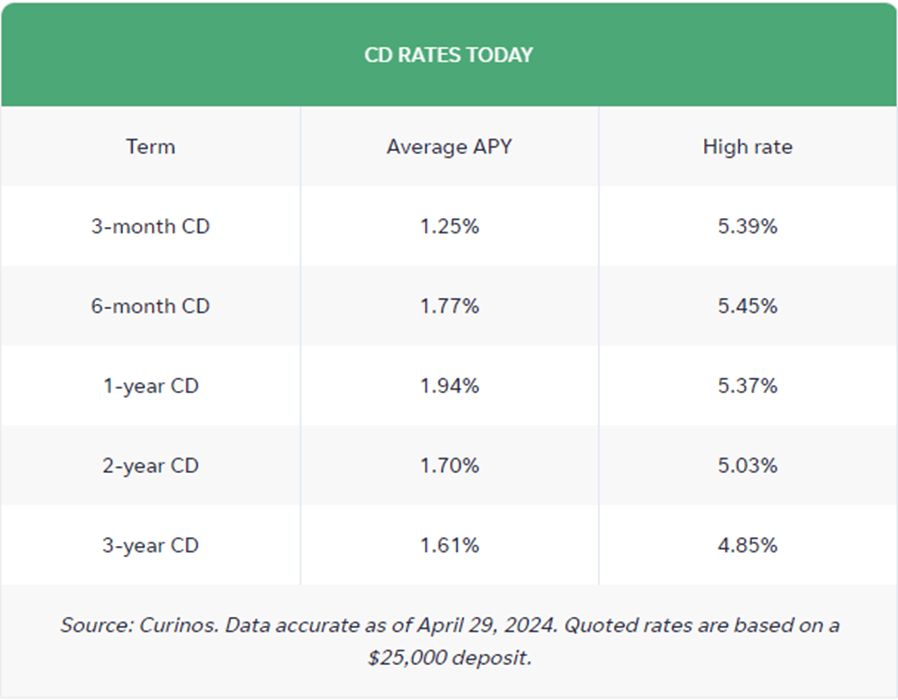
Now, take a look at the top rates for CDs and money market accounts (MMA):

The best 1-year CD interest rate is currently at 5.37%. The best 5-year CD rate right now is around 5.25%. We should see the 5-year CD rate surpass the 1-year rate by the end of the year based on current interest rate trends.

Eventually, savings rates will normalize but not until inflation comes down enough for the Fed to feel comfortable lowering interest rates. That said, I would still put my savings or emergency spending money into short-term CDs, 1 year or less, and reevaluate when they mature. If you would rather have more liquidity, look into an MMA (yielding close to 6% currently). Keep the total under $250,000 per person at any one bank to ensure you are fully covered by the FDIC. CDs and MMAs have become nice alternatives for risk-averse investors and have drawn money away from stocks because of their realtively high rates that carry virtually no risk.

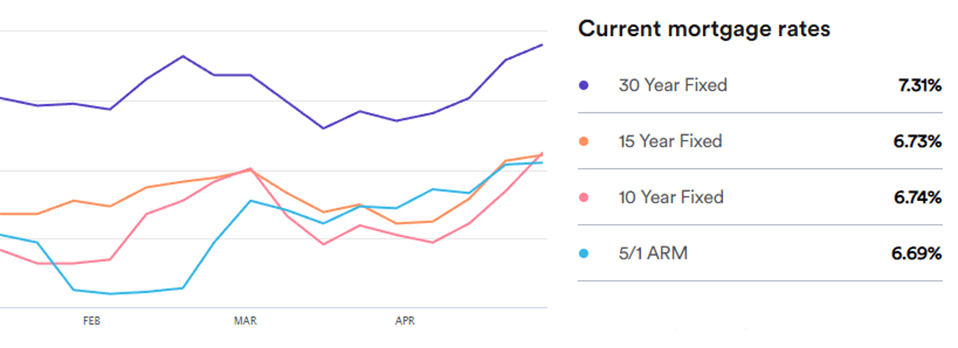
Mortgage rates rose in April as demand picked up most likely due to the spring buying season starting up. Currently, the 30-year rate sits at 7.31%, higher than a month ago, at 7.20%. The housing market continues to be in an unusual situation (high rates, low home inventory, strong demand) and that is making mortgage rates very volatile. Most homeowners either own their home outright or have a mortgage below 3.5%. There is very little incentive to sell a home with rates where they are right now. That will not change until mortgage rates fall. For now, the industry continues to bank on the Federal Reserve to get it squared away.

Oil prices broke their upward moving trend and dropped slightly in April, snapping a three-month streak. The drop could be attributed to the strong dollar due to rates in the U.S. staying higher, causing demand for the dollar worldwide, thus making imported oil cheaper.

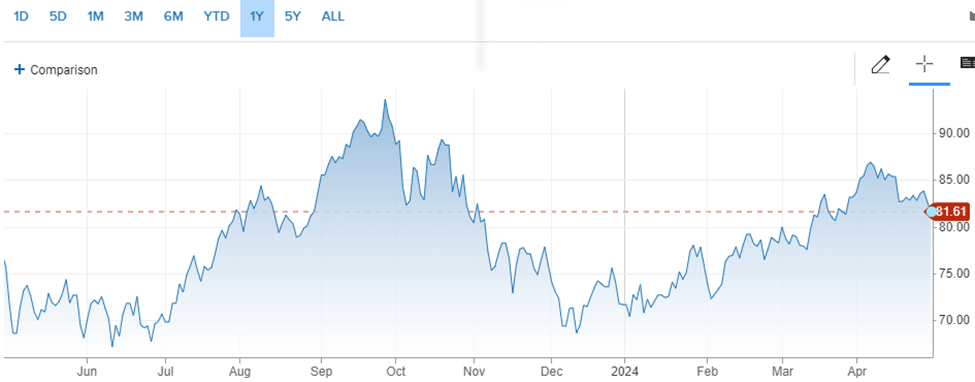
For the month, the price for a barrel of oil settled at $81.61, down from $83.17 at the beginning of April. For the year, it is up about 14%. Although oil prices fell, they are still high and are a big cause of the stubborn inflation that we are seeing in consumer prices, especially in the food and travel/leisure industries. It could be tough to get prices lower with economies worldwide continuing to chug along at a strong pace. It is a quandary that might be resolved only through demand destruction, or put another way, the cure for high oil prices is high oil prices.

Here’s a look at the one-year chart for U.S. oil:

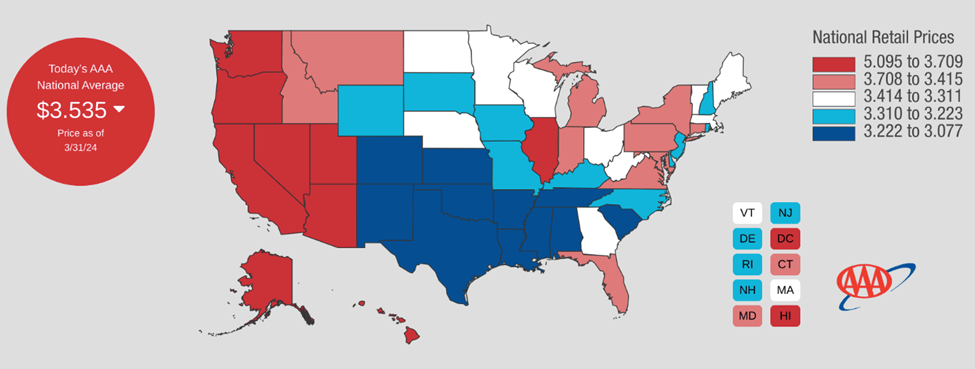
Gasoline prices headed higher again in April. Regular unleaded gasoline is now averaging $3.66 per gallon, up from $3.54 last month. Mississippi has the cheapest gas currently, checking in at $3.10 a gallon. California has the most expensive gasoline at $5.39 per gallon. FYI, a year ago, we were paying $3.61.

Check out the prices at the pump in your area: AAA Gas Prices.

Outlook

Events on the horizon that could move the markets in the near term:

Fed & Inflation: The Fed concluded their scheduled two-day meeting today and kept rates unchanged. They really don’t have a choice: unemployment is at historic lows and wages continue to rise. Both good things but too good, according to the Fed. Although prices have stabilized, especially for groceries, they just haven’t seen enough progress to justify cutting rates anytime soon. They feel what they have done so far is working, but not quite at the pace that they want so it looks like interest rates are going to remain high through at least the summer. Good news for savers, bad news for borrowers. For stock market investors, rate cuts aren’t fully priced into the market anymore so when it does happen, it will be a positive catalyst for stocks, but patience is warranted here.

Joe Baker, CFP®

Baker Asset Management, LLC

joebaker@bakerassetmanagement.com
Interesting Economic Indicators

I thought that I would share some interesting charts and data that I saw this past week regarding the health of the U.S. economy.

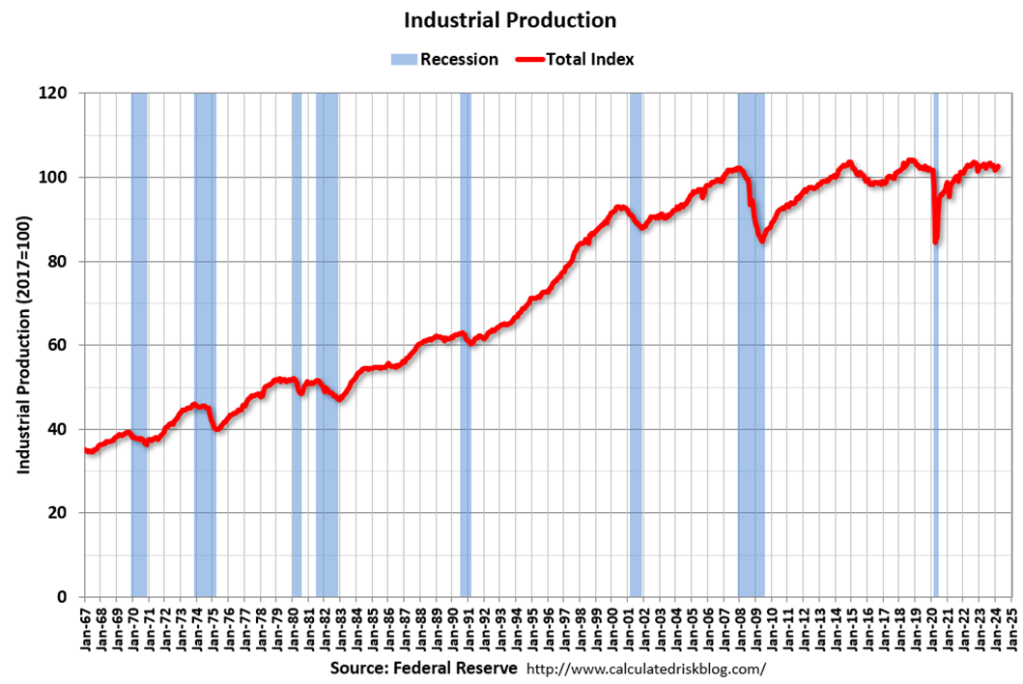
The following graph shows industrial production since 1967.

Industrial production is a measure of output of the industrial sector of the economy. The industrial sector includes manufacturing, mining, and utilities. The industrial sector is not as big a portion of our GDP as it once was but it’s still nice to see some increase in production in this area.


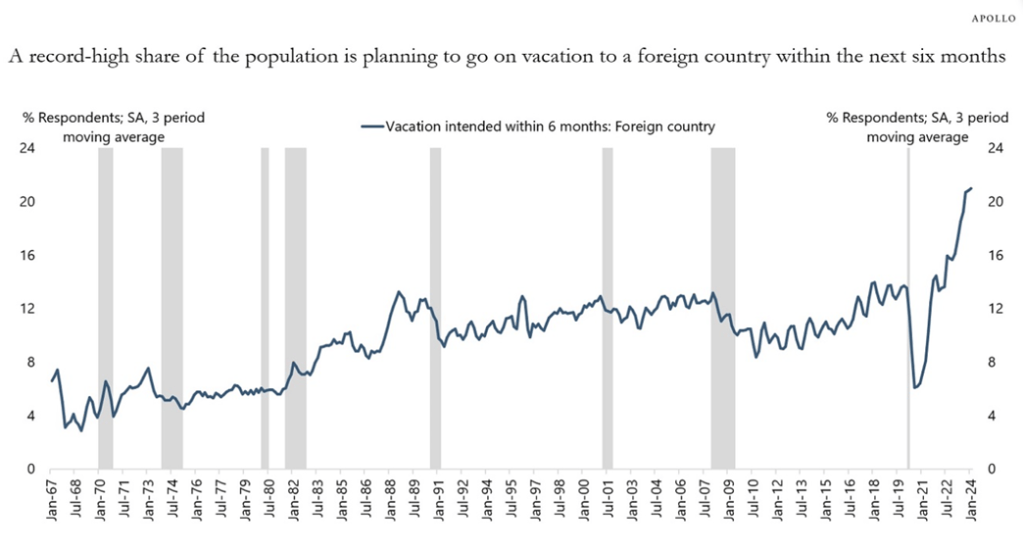
We are still spending like we just got out of a pandemic:

The Conference Board’s consumer confidence survey asks households if they plan to travel to a foreign country, and the chart below shows that a record-high share of US consumers is planning to go on vacation to a foreign country within the next six months.

Because of the significant rise in the stock market and significant cash flows from fixed income, US households have more money to travel on airplanes, stay at hotels, eat at restaurants, go to sporting events, amusement parks, and concerts, and that is why inflation in the non-housing service sector continues to be so high.


Apollo Academy


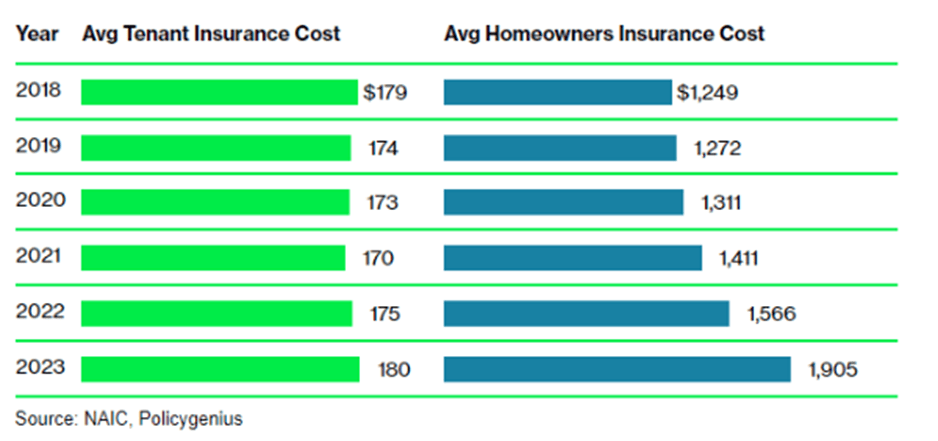
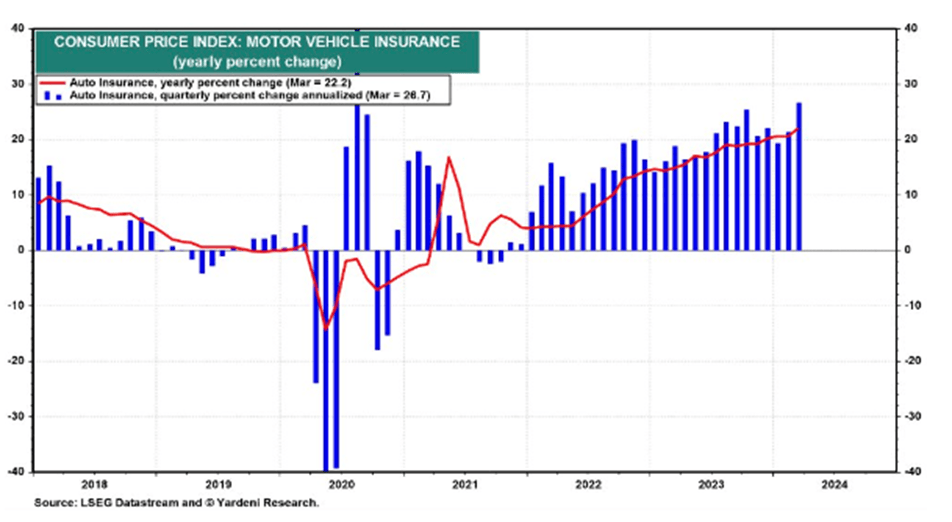
Homeowners and Auto Insurance Premiums are Surging

Regarding homeowners insurance, check this chart out which compares homeowners versus renters insurance over the last 5 years:


If you think that’s a big increase, look how much car insurance has jumped:


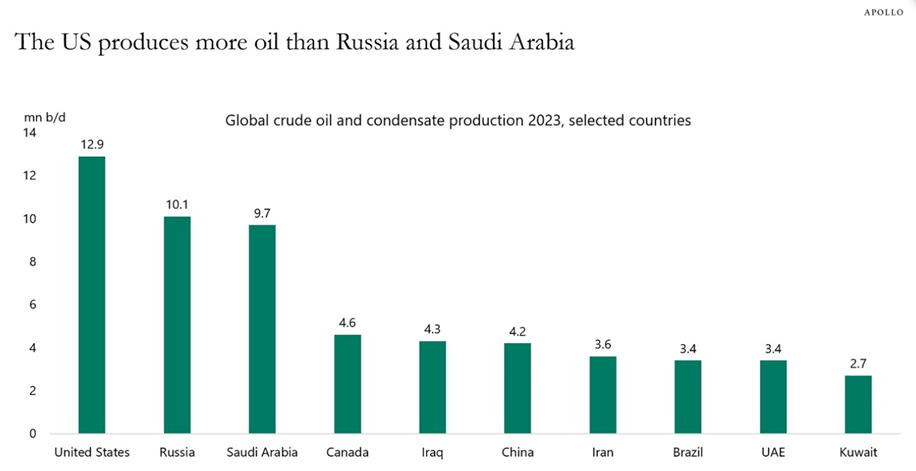
We are back on top of the world in oil production:

Apollo Academy


There’s a lot of good stuff happening in our economy. Unfortunately, one of the trade offs of a strong economy is inflation. Eventually, the high interest rate environment that we are currently in will help bring prices down but for now, the majority of U.S. consumers are keeping their wallets open. Hopefully, we can hit that soft landing that the Federal Reserve is aiming for so we don’t crash into a recession.

Please comment or send an email if you have any questions. Thanks!

Joe Baker, CFP®

Baker Asset Management, LLC

joebaker@bakerassemanagement.com
Your Balance Sheet Is Looking Good!

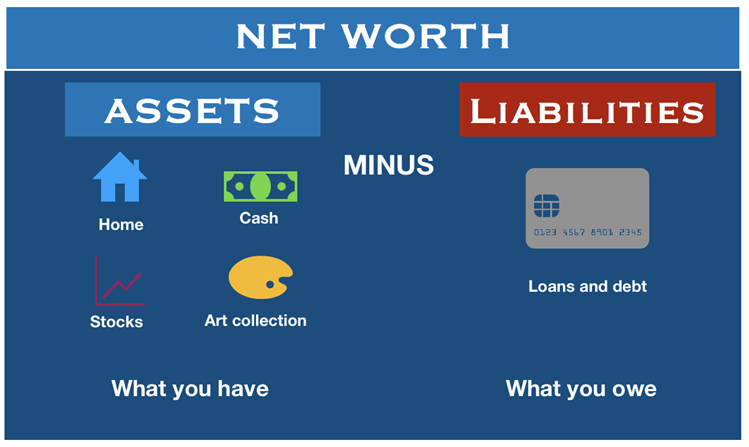
Just like for a company, the balance sheet is one of the most important financial statements that a household can use to monitor its financial health. Put simply, it is a snapshot of your net worth, which is just your assets (stuff you own like your home, stocks, retirement plans, etc.) minus your liabilities (stuff you owe like mortgages, credit card debt, student loans, etc.).

Recently, households in the U.S. have been getting healthier financially than at almost any other time in history. In fact, if you look at homeowners, about 39% have no mortgage and roughly 85% of homeowners that do have a mortgage, their mortgage rate is under 3.5%. When you couple this low amount of debt with all-time highs in the stock market, historically low unemployment, and decent wage growth, household net worth has never looked better.

Here are a few charts that illustrate this topic more clearly:

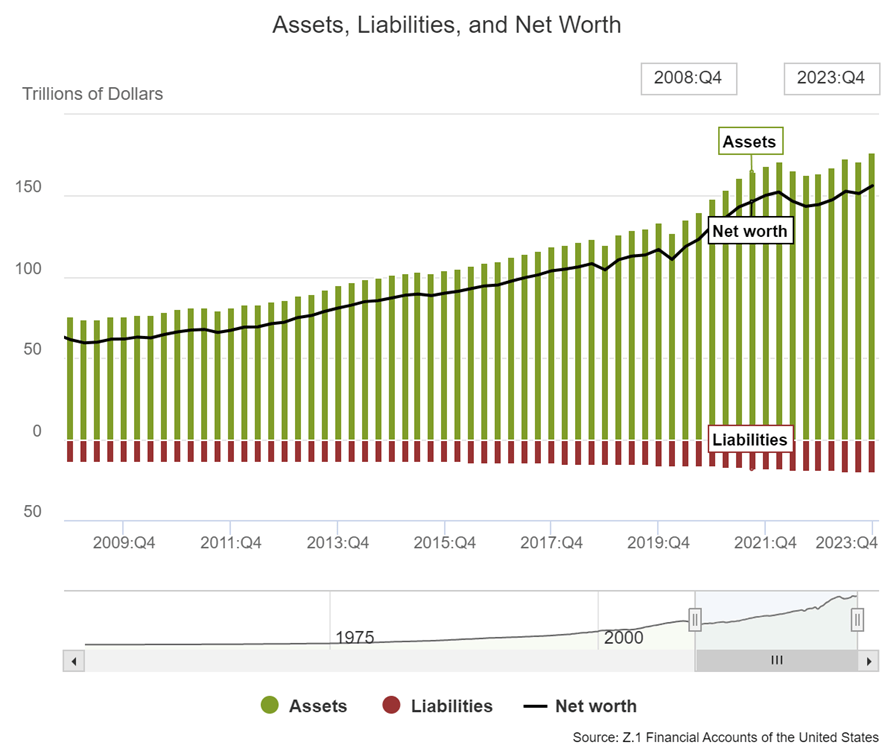
In the chart above, you can see that since the great financial crisis, household net worth has consistently grown over the last fifteen years.

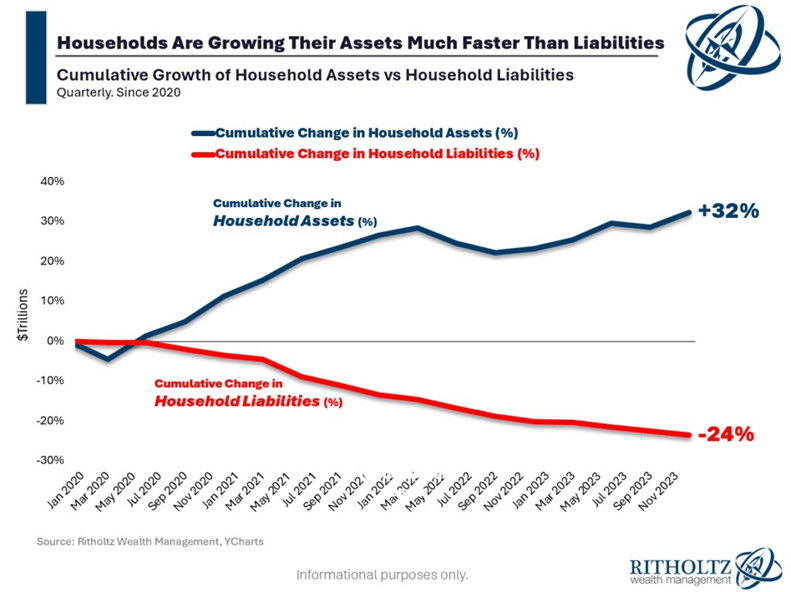
In this illustration, a more recent time period (from the pandemic in 2020 until the end of last year, 2023) shows the significant growth of household assets over the last three years while liabilities have dropped quite a bit.

Of course, the economic picture isn’t as rosy as it appears. There are some under currents to consider despite this encouraging data:

  • There is still significant wealth inequality. The top 1% hold a much larger share of the total wealth compared to the bottom 50% [Pew Research Center]. This falls under the old saying that “The rich get richer”.
  • Stubborn inflation could deplete some of the assets of households as they try to continue their same lifestyle without adjusting their spending habits for inflation.

For most households, things are looking pretty good, financially. If we can win the battle with inflation, we’ll see interest rates head lower, which will benefit the economy even more.

Please comment or send an email if you have any questions. Thanks!

Joe Baker, CFP®

Baker Asset Management, LLC

joebaker@bakerassemanagement.com
How Stocks Perform In Presidential Election Years

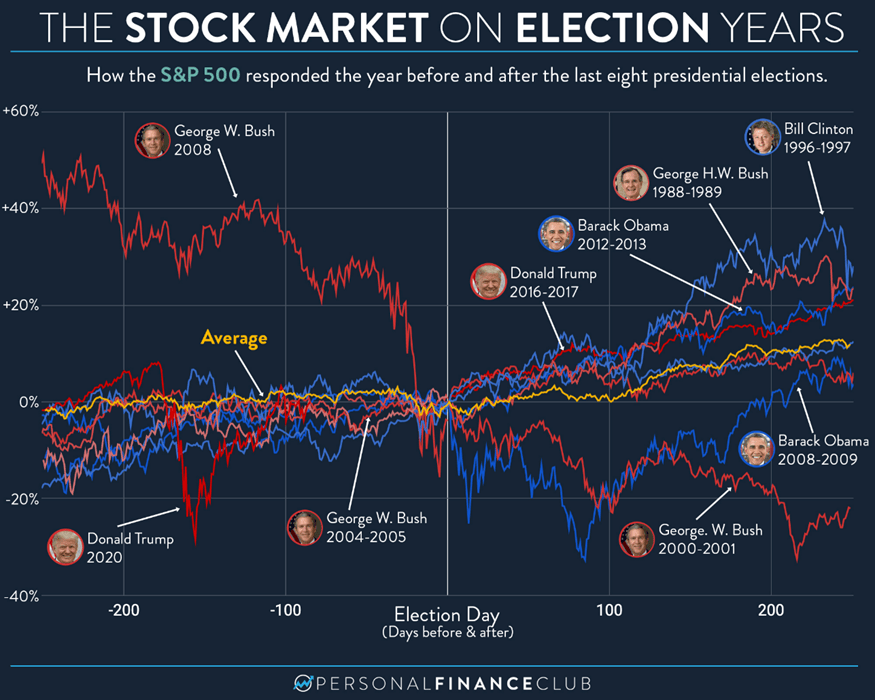
Besides interest rates and The Federal Reserve, stock market volatility is going to be heavily influenced by the presidential election this November. And it’s not going to wait until Fall. Headlines are going to be filled with polls, debates, and trials from now until election day (and beyond, I’m sure). I have always felt that elections are just short-term catalysts, both positive and negative, for stocks and Presidents don’t really have an affect on stock prices. It will still hold true this year. However, I suspect there will be much more volatility due to politics than normal, especially with addition of the Trump trials to the landscape.

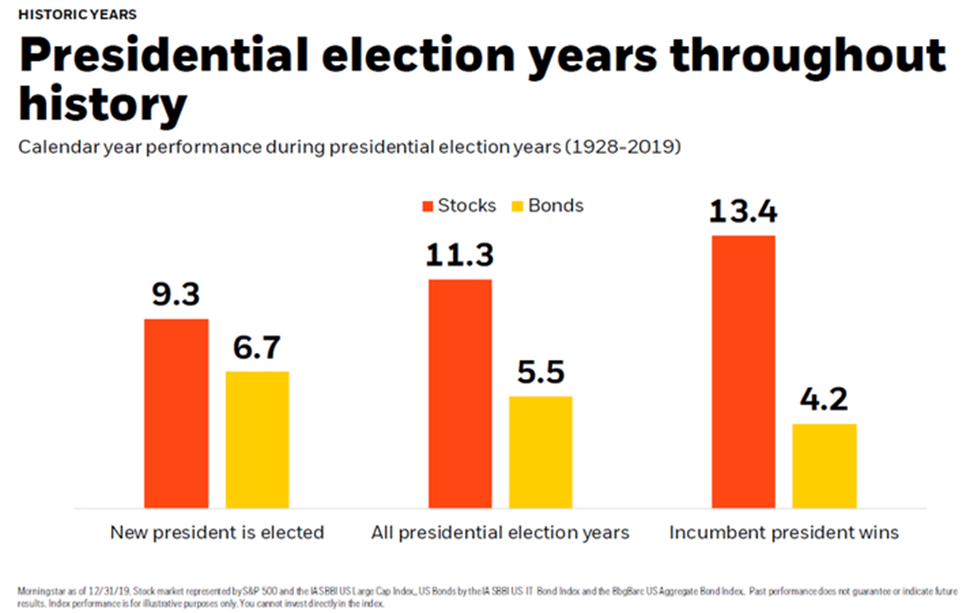
So, let’s take a look at how markets have performed historically in a presidential election year:

  • Historically, the S&P 500 has averaged a 7% gain during U.S. presidential election years since 1952. This is lower than the average annual gain of around 10% but still positive.
  • Re-election years: Markets tend to perform better in re-election years (such as this year), with the S&P 500 averaging a 12.2% gain since 1952. This could be due to an incumbent president’s focus on maintaining stability and avoiding major policy changes.
  • Party control: The party in control of Congress doesn’t seem to have a significant impact on market performance. However, major policy changes proposed by either party can cause uncertainty and volatility.
  • Economic conditions: The overall health of the economy has a much stronger influence on the stock market than the election itself. Strong economic growth and low inflation are typically associated with positive market returns.

Historically, stocks perform the best when an incumbent president wins and the opposite party controls at least one  section of Congress, either the House of Representatives or the Senate. But this shouldn’t influence your investment strategy for the long term. Holding high-quality, well-run companies will serve you well regardless of the political climate.

Please comment or send an email if you have any questions.

Joe Baker, CFP®

Baker Asset Management, LLC

joebaker@bakerassetmanagement.com