Financially speaking, U.S. households are looking strong heading into 2025. In fact, they have never looked better. Just check out the following chart to see how we are doing compared to the last 50 years:
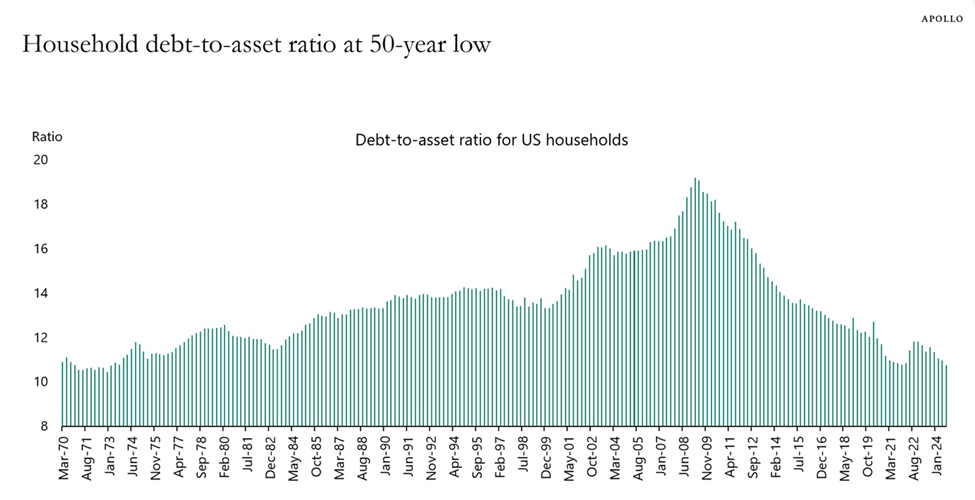
Source: Federal Reserve, Haver Analytics, Apollo Chief Economist
As you can see, we have come quite a long way from the Great Financial Crisis era in 2008/2009 and are at levels that we haven’t seen since the early 1970’s. There are a few key reasons for such a strong showing:
- Home prices have increased at a much faster rate over the past fifteen years than in the past. This has improved the asset side of the balance sheet.
- More homes are now owned outright (no mortgage) or have mortgages at a 3% rate or lower than ever before. This has helped reduce household debt quite a bit.
- Stellar stock market returns over the past two years have bolstered people’s retirement and investment accounts, thereby increasing their assets and subsequently, their net worth.
Can it keep going?
It’s possible. We still have a shortage of housing which will keep upward pressure on home prices. But mortgage rates are still relatively high which could increase the debt side of the balance sheet of new homeowners.
Regarding stocks, history is on our side. For instance, the S&P 500 has a history of delivering strong gains following two consecutive years of 20%+ gains, which we just had. Since 1950, there have been eight instances where the S&P 500 index has risen by 20% or more for two consecutive years. In six of those cases, the U.S. stock market achieved positive returns in the third year, with an average return of 12%.
Obviously, it’s always tough to predict what’s going to happen over the course of the next year but it’s good to know that we are in a great position now, regardless of what the future holds.
Please comment or send an email if you have any questions.
Joe Baker, CFP®
Baker Asset Management, LLC