
I was looking at some data last week to see if the U.S. still had a good chance of avoiding a recession and came upon some interesting charts that I wanted to share with you.
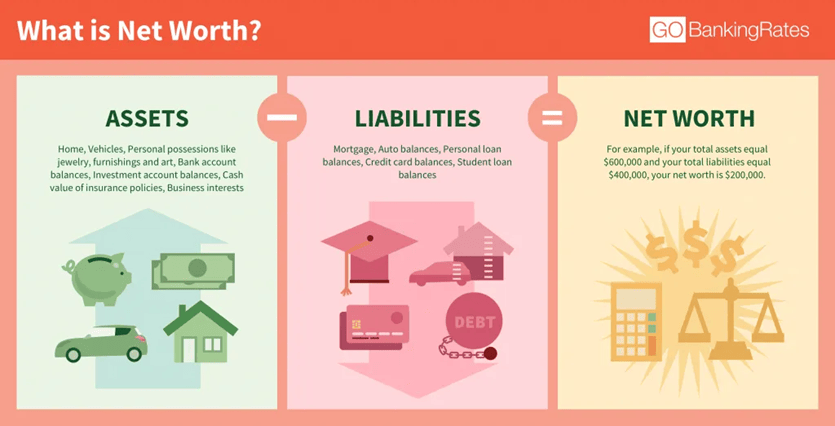
The first chart takes a look at the average and median net worth of U.S. citizens categorized by age as of 2023. Remember, net worth is just your assets minus your liabilities. The illustration above gives a great example of how net worth is calculated.
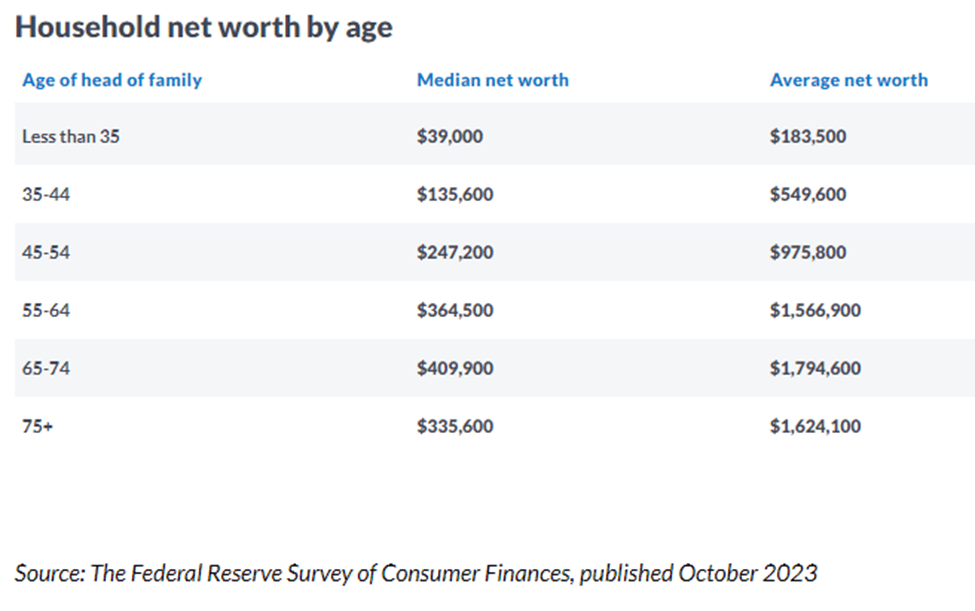
You can see there is quite a difference between average and median values. That’s because there are a bunch of households that are extremely wealthy and that will skew the average higher. The more realistic values are the ones in the Median Net Worth column. These amounts are calculated simply by locating the middle value of all the net worth values in that age group. That said, both show that the net worth of U.S. households is the highest that it’s ever been.
This next chart compares our household debt as a percentage of disposable income to our buddies in Canada and Australia. The lower the percentage, the better:
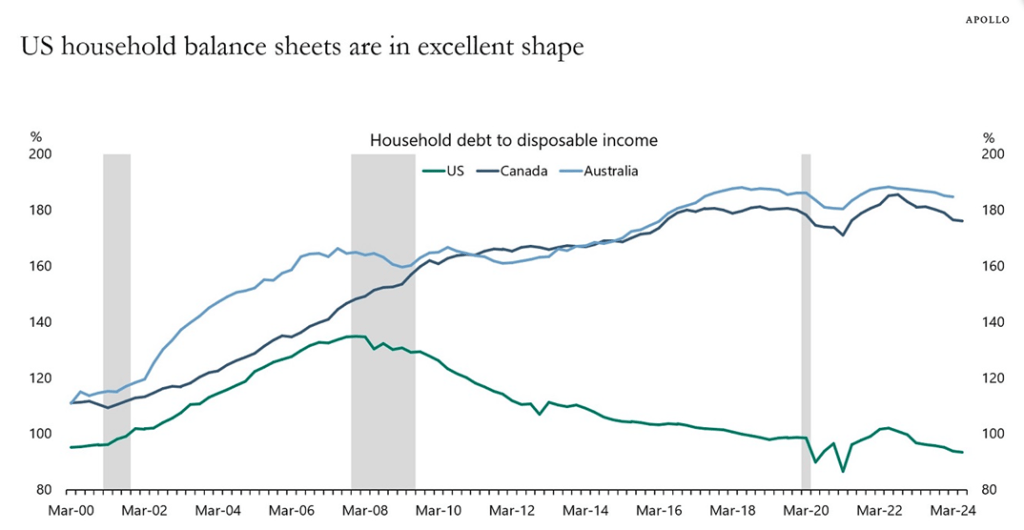
As you can see, we are below 100% which means that we have enough disposable income to pay off our debts. Also, we are in much better shape than our Canadian and Australian friends.
This is good news any way you slice it. The combination of rising asset values (homes, stocks, etc.), decent job growth, solid wage growth, and the Fed cutting interest rates, almost ensures that there is no recession on the horizon.
Please comment or send an email if you have any questions.
Joe Baker, CFP®
Baker Asset Management, LLC
joebaker@bakerassemanagement.com

