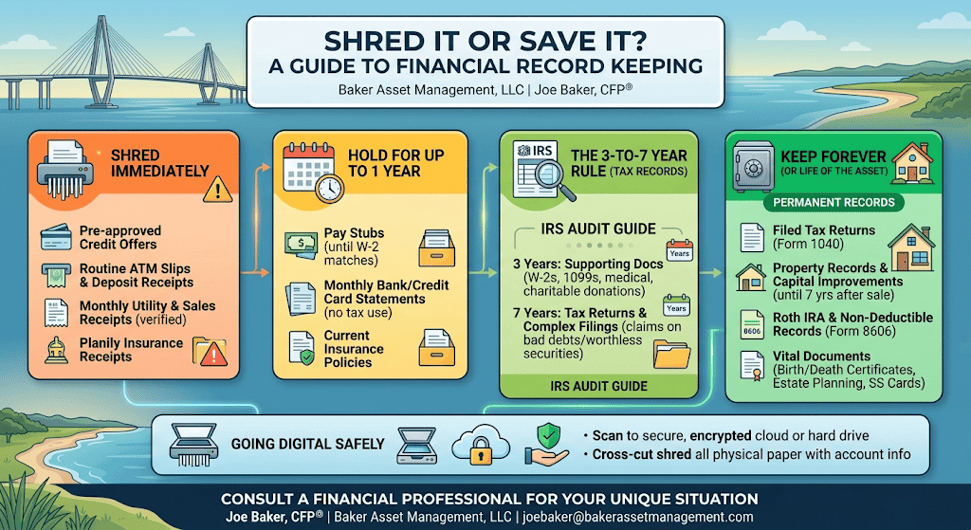
To Keep or Shred? A Guide to Financial Record Keeping

Between physical filing cabinets and sprawling digital downloads, managing financial paperwork can quickly become overwhelming. Holding onto every piece of paper creates unnecessary clutter, while tossing the wrong document can lead to headaches at tax time—or worse, identity theft if improperly discarded.

Knowing what to keep, what to digitize, and what to run through the shredder keeps your financial life secure and organized.

Shred Immediately

  • Pre-approved credit card offers and loan solicitations: Primary targets for identity thieves if left in the trash.
  • Routine ATM slips and deposit receipts: Shred as soon as you verify the transaction on your online bank statement.
  • Monthly utility and sales receipts: Toss after verifying payment, unless you need the receipt for a product warranty, insurance, or a home-office tax deduction.

Hold for Up to 1 Year

  • Pay stubs: Hold until you receive your annual W-2 to verify that earnings and withholdings match.
  • Monthly bank and credit card statements: Keep for up to a year to review annual spending patterns, unless they contain transactions needed for tax deductions.
  • Current insurance policies: Retain current declarations pages; shred expired policies once new coverage is active.

The 3-to-7 Year Rule (Tax Records)

  • Supporting tax documentation (3 Years): The IRS standard period of limitations for an audit is generally three years from the date you filed. Keep 1099s, W-2s, medical bills, and charitable donation receipts for at least this timeframe.
  • Tax returns and complex filings (7 Years): To be safe, retain supporting tax files for seven years. The IRS audit window extends to six years if income is underreported by more than 25%, and seven years for claims on bad debts or worthless securities.

Keep Forever (or Life of the Asset)

  • Filed tax returns (Form 1040): Keep actual tax returns permanently—either as PDFs or physical copies—for personal reference and Social Security verification.
  • Property records & capital improvements: Retain home closing documents, title deeds, and major renovation receipts until at least seven years after you sell the property to substantiate your tax cost basis.
  • Roth IRA & non-deductible IRA records: Keep Form 8606 and contribution records indefinitely to prove tax-free basis upon future withdrawals.
  • Vital personal documents: Birth/death certificates, marriage licenses, military discharge papers, estate planning documents (wills, trusts, powers of attorney), and Social Security cards should remain locked in a fireproof safe.

Going Digital Safely

When clearing out physical files, scanning documents to a secure, encrypted cloud storage service or encrypted hard drive is an effective way to stay organized. However, always use a cross-cut shredder for any physical paper containing account numbers, Social Security numbers, or personal identifying information.

Please comment or send an email if you have any questions.

Joe Baker, CFP®

Baker Asset Management, LLC

joebaker@bakerassetmanagement.com

The IPO Reality Check: What History Tells Us About Post-Debut Performance

Just ran some numbers on historical initial public offerings (IPOs) to provide a data-driven perspective on what the future might hold for highly anticipated market debuts like SpaceX, OpenAI, and Anthropic. While the media buzz surrounding mega-tech listings often generates massive retail excitement, the historical data over the last 25 years tells a much more cautious story for the 12 months following a company’s public debut.

Data-Driven Insights: The 12-Month Post-IPO Track Record

When evaluating historical IPO performance over the past two and a half decades, the data consistently refutes the myth of guaranteed first-year gains. Financial studies reveal several critical trends regarding how companies perform in the 365 days after hitting the public markets:

  • The “First-Day Pop” vs. Long-Term Reality: Historically, IPOs are known for significant first-day underpricing, giving early institutional investors an average initial “pop” of roughly 15% (Lowry et al., 2017). However, for everyday investors buying shares on the open market after day one, the subsequent 12 months frequently see a reversal of fortune.
  • Systemic Underperformance: Extensive long-run historical data indicates that, on average, IPOs tend to underperform broad market benchmarks—such as the S&P 500 or industry-specific indices—during their first one to three years (Ang et al., 2006).
  • The Size and Age Factors: Performance varies wildly based on a company’s maturity at the time of the listing. Smaller, younger startups exhibit severe average underperformance, with cumulative average abnormal returns dropping significantly in the first year (Siev & Qadan, 2022). Conversely, large, heavily capitalized, and older firms tend to manage the transition to public markets with far less volatility, though they still frequently lag behind established market peers in the short term (Siev & Qadan, 2022).
  • The “Star Performer” Statistical Outliers: The broader average of IPO performance is heavily weighed down by a high failure rate. Statistically, the vast majority of IPOs underperform, while the overall asset class is propped up by a tiny minority (roughly 2%) of “star performers” that achieve monumental returns (Ang et al., 2006).

What This Means for upcoming IPOs such as SpaceX, OpenAI, and Anthropic:

Applying this decision-making framework to the dominant tech private giants of today yields specific strategic takeaways:

Risk & Valuation VariableStrategic Application to Upcoming Mega-Tech IPOs
Institutional MaturityUnlike the speculative tech listings of the 1999–2000 dot-com bubble, firms like SpaceX, OpenAI, and Anthropic will enter the public markets as massive, heavily capitalized enterprises with massive global footprints. According to historical trends, their large size and operational age should structurally protect them from the extreme 40%+ drop-offs seen in smaller, speculative IPOs (Siev & Qadan, 2022).
The Hype PremiumBecause these brands carry unprecedented cultural and technological visibility, their IPOs will likely face intense public demand. This historically leads to severe initial underpricing (to benefit institutional insiders) followed by a retail-driven valuation peak on day one, which frequently leads to a cooling-off period and negative market-adjusted returns over the subsequent 12 months.
The “Long Shot” BetInvestors backing OpenAI or Anthropic are implicitly betting that these firms will become the absolute “star outliers” of the decade (Ang et al., 2006). While the historical probability of any random IPO becoming a permanent market leader is low, companies with profound structural moats stand the best statistical chance of breaking the traditional 12-month underperformance trend.

The historical data over the last 25 years sends a clear warning to investors: buying into the immediate 12-month aftermath of a high-profile tech IPO is statistically a losing proposition compared to holding a broad-market index. While mega-cap innovators like SpaceX or OpenAI possess the scale to avoid the catastrophic first-year collapses of smaller startups, history dictates that the safest, most optimized administrative path for retail capital is often patience—waiting for the initial regulatory, insider lockup, and hype cycles to clear before establishing a long-term position.

Please comment or send an email if you have any questions.

Joe Baker, CFP®

Baker Asset Management, LLC

joebaker@bakerassetmanagement.com


References

Ang, A., Gu, L., & Hochberg, Y. V. (2006). Is IPO underperformance a peso problem? National Bureau of Economic Research. https://doi.org/10.3386/w12203

Cited by: 81

Lowry, M., Michaely, R., & Volkova, E. (2017). Initial Public Offerings: A synthesis of the literature and directions for future research. Foundations and Trends® in Finance, 11(3-4), 154-320. https://doi.org/10.1561/0500000050

Cited by: 334

Siev, S., & Qadan, M. (2022). Call me when you grow up: Firms’ age, size, and IPO performance across sectors. Journal of Risk and Financial Management, 15(12), 586. https://doi.org/10.3390/jrfm15120586

Cited by: 19

2026 Paycheck Checkup

If you find yourself with a few minutes of free time during these cold winter days, you should take a look at your pay stub to make sure your deductions and withholdings are up to date and squared away.

I think the following pay stub items should be checked at least annually:

  • Federal and state status and exemptions – You set these when you complete form W-4 for your employer. These determine how much tax your employer withholds from your pay. You probably should adjust these if your tax returns show a large refund or if you owe a large amount. You can make these changes online with your employer or turn in a revised W-4 to HR.
  • Deductions – Check that the correct amount is being taken out for your retirement plans and group insurance plans. I have seen too many times where an employee changes their 401k contribution, but it never gets changed in the system. Again, these can typically be changed online on your benefits’ website.
  • Employer Contributions – Make sure your employer is contributing where they are supposed to. Employer matching for retirement plans and insurance premiums are two of the most common employer contributions that you should verify are correct.

The IRS even has a page on their site that you can use to help you figure out what your withholdings (marital status and exemptions on your W-4) should be based on your current pay stub and previous year’s tax filings. Here’s the link: https://www.irs.gov/paycheck-checkup

The IRS say that the following circumstances warrant a check of your withholdings:

  • Are a two-income family
  • Have two or more jobs at the same time
  • Work a seasonal job or only work part of the year
  • Claim credits like the child tax credit
  • Have dependents age 17 or older
  • Itemized deductions on your returns
  • Have high income or a complex tax return
  • Had a large tax refund or tax bill this past year

Now is a good time to review these items because if there are mistakes, there is enough time left in the year to rectify the situation. Also, if you wait until the end of the year, it will be much harder to find the time during the holiday season.

Please comment or send an email if you have any questions.

Joe Baker, CFP®

Baker Asset Management, LLC

joebaker@bakerassetmanagement.com

What History Tells Us About Stock Performance in the 4th Quarter

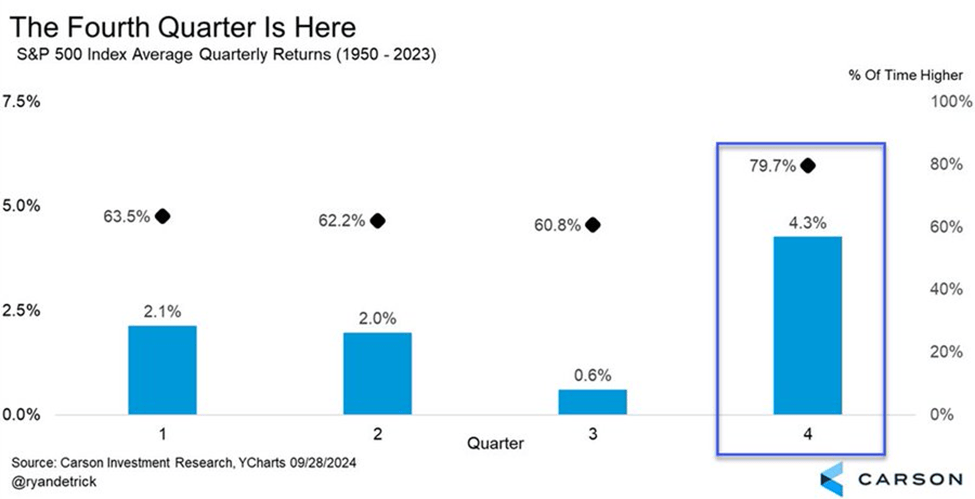
History tells us that the fourth quarter of the year is typically a very good time to be invested in stocks. Take a look at this chart:

As you can see, the S&P 500 index has an average return of 4.3% in the fourth quarter over the past seventy-three years. This is more than twice as good a return as any other quarter of the year.

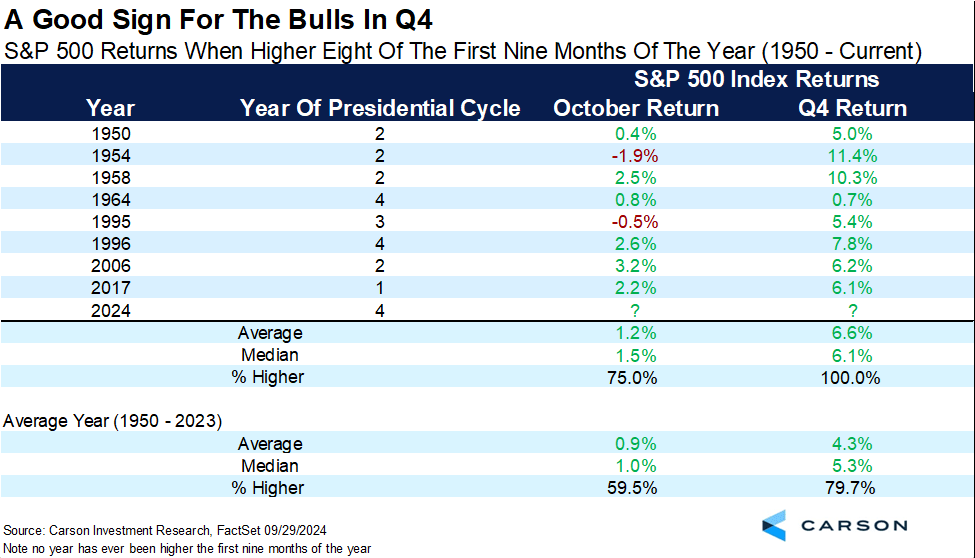
Historical data gets even better for stock market bulls when it comes to this year. When the S&P 500 index is higher the first eight of the nine months of a year, like it has been in 2024, then the fourth quarter is positive every single time (8 for 8), with an average gain of 6.6%. FYI, the index has never been up each of the first nine months of a year. This year, April has been the only down month.

I have to hedge this blog by stating that the upcoming election could have a greater influence on the markets than any other election in recent history. Even so, if history repeats itself, or at least rhymes, we should expect a pretty good quarter for the stock market to finish out 2024.

Please comment or send an email if you have any questions.

Joe Baker, CFP®

Baker Asset Management, LLC

joebaker@bakerassemanagement.com

Dot Com Vs. AI Era Comparison

I thought it would be interesting to take a look at the late 1990’s Dot Com era and see how it compares to the current AI era. There are some similarities that I see, particularly with investors’ mindsets, that make me think history will repeat itself. But there are also some key differences that could keep the AI era from suffering the same fate as the Dot com era. Here’s what I am seeing:

What’s the same

Transformational Change – In the 90’s, the internet was changing how businesses interacted with customers. We went from going to brick and mortar stores to sitting at a computer to transact business. Today, AI is involved not only on the transactional side of business, but also the marketing, manufacturing, research, and almost every aspect of business today.

Fear Of Missing Out (FOMO) – You couldn’t go to a party, restaurant or pretty much any social gathering without hearing someone talk about how well their Dot Com investments were doing. This caused a great deal of FOMO among both retail and institutional investors. If there was a “.com” at the end of a company’s name, you wanted to own its stock. Now, investors are lining up to buy any company that is involved in AI infrastructure and willing to pay a premium for them.

What’s different

Earnings – The Dot Com era ushered in an incredible number of companies that went public based on hype and the promise of amazing revenue and profits. Many had no revenue but the push to get their stock publicly traded was so great that they rushed to the markets. The insanity was that investors couldn’t get enough of them. Of course, once reality set in, these companies went bankrupt, and investors lost everything. Now, most companies involved in AI are already well established (Microsoft, Amazon, Google, Nvidia, Meta, etc.) and are very profitable already.

Behind the Scenes – AI is helping make companies more efficient, productive, and profitable by improving operations and procedures behind the scenes. It is involved in almost every aspect of a company’s business whereas in the Dot Com era, the internet was more concentrated in just the sales and marketing sectors.

Far Reaching – Back in the 90’s the internet focused mainly on the interphase between businesses and consumers. Today, AI is not only involved there, it is changing nearly every aspect of every industry. In health care for instance, AI can read x-rays, CAT scans, and biopsy slides with incredible accuracy, detecting and diagnosing diseases faster. In the forest fire arena, AI is now being used to detect fires much quicker than humanly possible. California has 1,000 cameras monitoring their forests using AI. The money, manpower, and property saved by employing AI is immense. Now, extrapolate that across every industry and you can see why AI is a game changer.

That being said, it does seem that the markets might be getting ahead of themselves in this AI era. But it is nowhere near the frenzied euphoria that caused the Dot Com era bubble to burst…..for now.

Please comment or send an email if you have any questions.

Joe Baker, CFP®

Baker Asset Management, LLC

joebaker@bakerassemanagement.com

Interesting Economic Indicators

I thought that I would share some interesting charts and data that I saw this past week regarding the health of the U.S. economy.

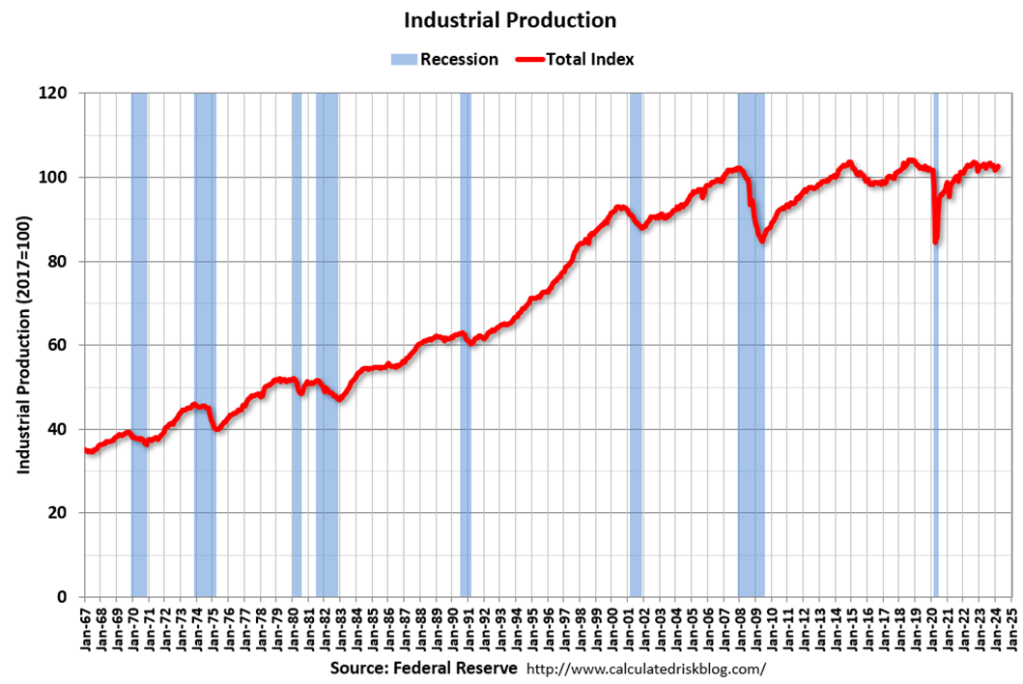
The following graph shows industrial production since 1967.

Industrial production is a measure of output of the industrial sector of the economy. The industrial sector includes manufacturing, mining, and utilities. The industrial sector is not as big a portion of our GDP as it once was but it’s still nice to see some increase in production in this area.


We are still spending like we just got out of a pandemic:

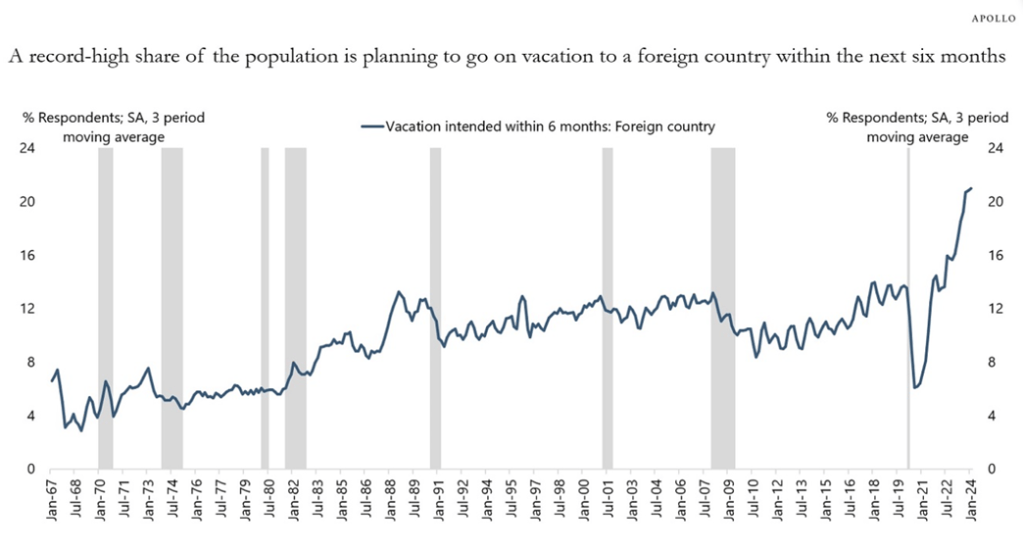
The Conference Board’s consumer confidence survey asks households if they plan to travel to a foreign country, and the chart below shows that a record-high share of US consumers is planning to go on vacation to a foreign country within the next six months.

Because of the significant rise in the stock market and significant cash flows from fixed income, US households have more money to travel on airplanes, stay at hotels, eat at restaurants, go to sporting events, amusement parks, and concerts, and that is why inflation in the non-housing service sector continues to be so high.


Apollo Academy


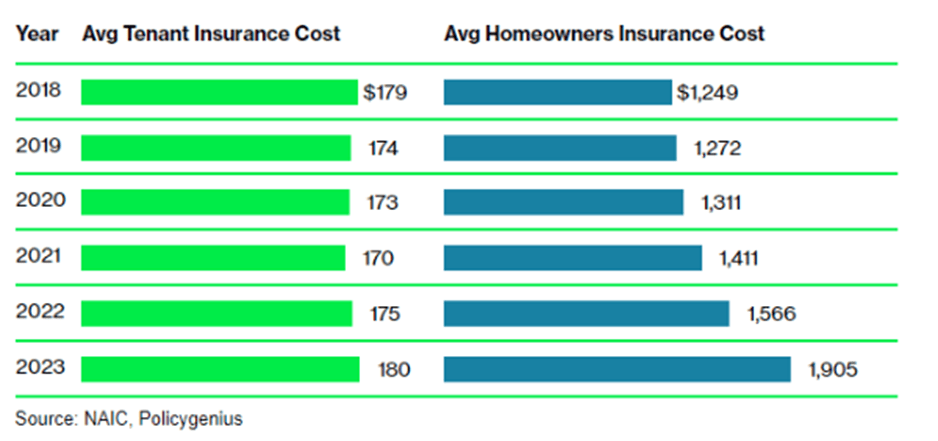
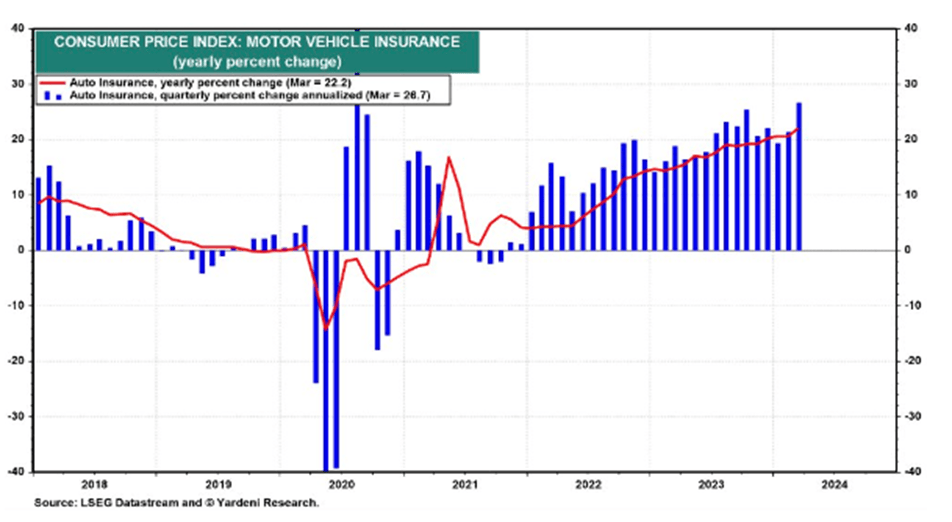
Homeowners and Auto Insurance Premiums are Surging

Regarding homeowners insurance, check this chart out which compares homeowners versus renters insurance over the last 5 years:


If you think that’s a big increase, look how much car insurance has jumped:


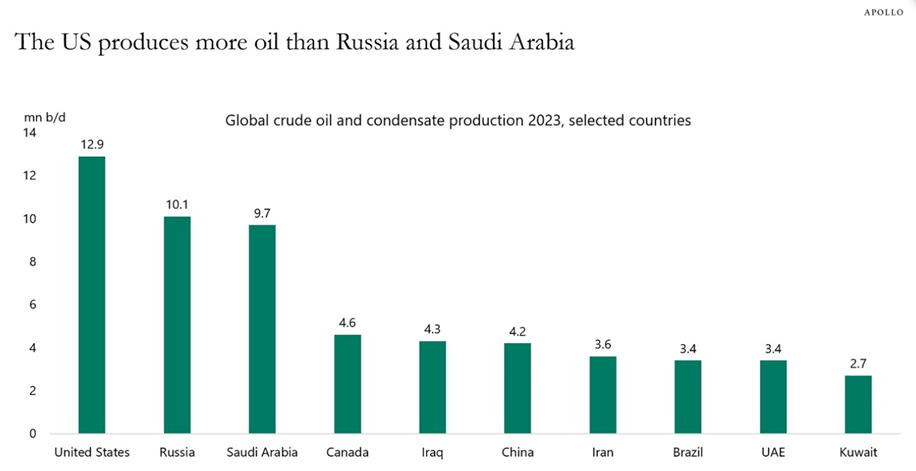
We are back on top of the world in oil production:

Apollo Academy


There’s a lot of good stuff happening in our economy. Unfortunately, one of the trade offs of a strong economy is inflation. Eventually, the high interest rate environment that we are currently in will help bring prices down but for now, the majority of U.S. consumers are keeping their wallets open. Hopefully, we can hit that soft landing that the Federal Reserve is aiming for so we don’t crash into a recession.

Please comment or send an email if you have any questions. Thanks!

Joe Baker, CFP®

Baker Asset Management, LLC

joebaker@bakerassemanagement.com