The Federal Open Market Committee (FOMC) just cut its benchmark interest rate, known as the federal funds rate, by a quarter-point (0.25%), bringing the target range to between 4.00% and 4.25%.
This can be considered a continuation of an easing cycle (period of lowering interest rates) that started back in September of 2024 but had been paused at the beginning of this year due to the uncertainty of how the new administration’s trade and immigration policies were going to affect prices and unemployment.
Since then, the data has shown that inflation has picked up mainly due to tariffs but not as much as expected. Our businesses are not passing on the full cost of the tariffs to their customers….for now. However, the labor market has weakened significantly in that same time span. Typically, when inflation picks up, raising rates helps cool it down. When unemployment increases, lowering rates is the standard response to help support employment. This dilemma of rising inflation and rising unemployment, aka stagflation, put the FOMC in a quandary for most of 2025.
Ultimately, at their last meeting, the FOMC chose to prioritize the battle against rising unemployment and restarted their easing cycle by cutting rates.
So, how will this affect the stock market? Historically, the market has performed well when interest rates are cut. The graph below illustrates the historical performance of the S&P 500 Index in the 12 months following the Federal Reserve’s first interest rate cut in a new cycle (since 1980). The returns vary significantly based on the underlying economic conditions, but they have always been good for stocks.
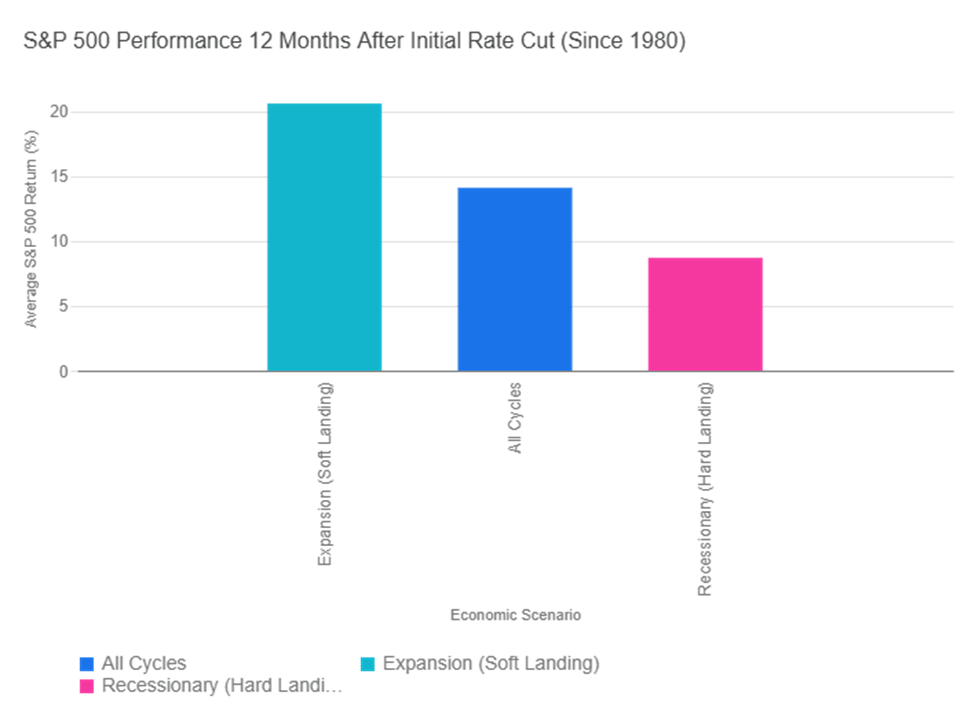
If we consider the start of the easing cycle to be September of 2024, we are now at a full year following the first rate cut. Interestingly enough, the S&P 500 has returned about 15.3% for that period, which coincides with its historical returns, as seen on the graph.
Does that mean we are due for a pullback? Not necessarily. If we continue on the trajectory of the soft landing that we were headed for at the beginning of this year, stock prices could continue to move higher. But, if inflation persists and unemployment continues to rise, we could be heading for a downturn.
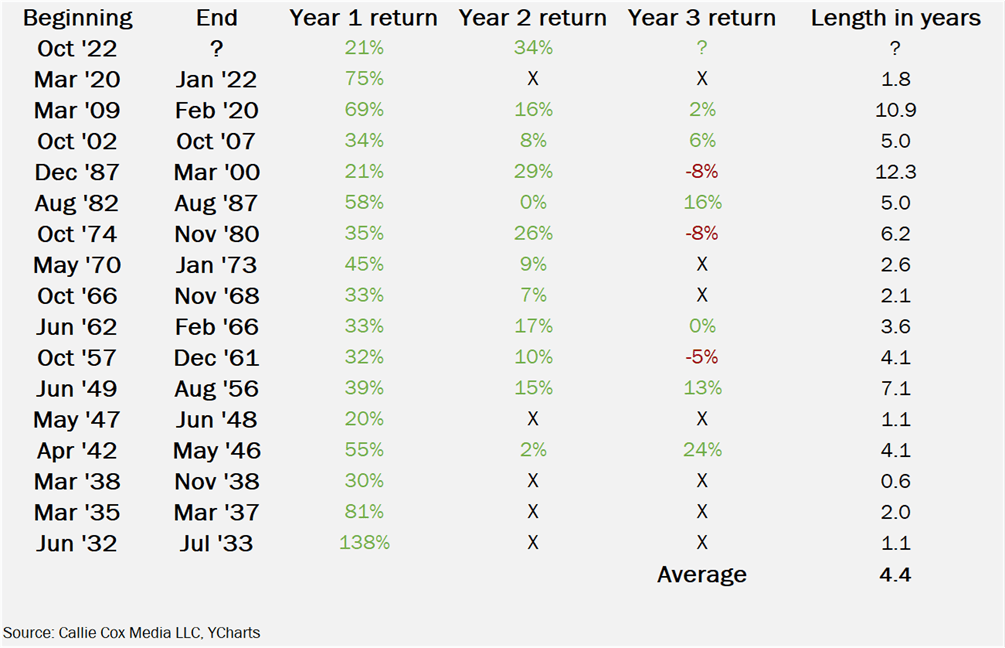
The S&P 500 is also approaching a significant milestone: 3 years of consecutive double-digit returns. Stringing together three or more years of positive double-digit returns is rare but it happens.
| Period (Start Year) | Length of Streak (Years) |
| Early 1930s (e.g., 1933–1936) | 4 |
| World War II / Post-War (e.g., 1942–1945) | 4 |
| Post-War Boom (e.g., 1949–1955) | 7 |
| Mid-1960s (e.g., 1963–1967) | 5 |
| 1990s Tech Boom (1995–1999) | 5 |
| Post-Financial Crisis (e.g., 2012–2014) | 3 |
| Post-Pandemic Era (2019–2021) | 3 |
We will see if stocks can make history as we head into the home stretch of 2025.
Please comment or send an email if you have any questions.
Joe Baker, CFP®
Baker Asset Management, LLC
joebaker@bakerassetmanagement.com