Why Global Shocks Hit Your Local Pump: The Strait of Hormuz and Your Wallet

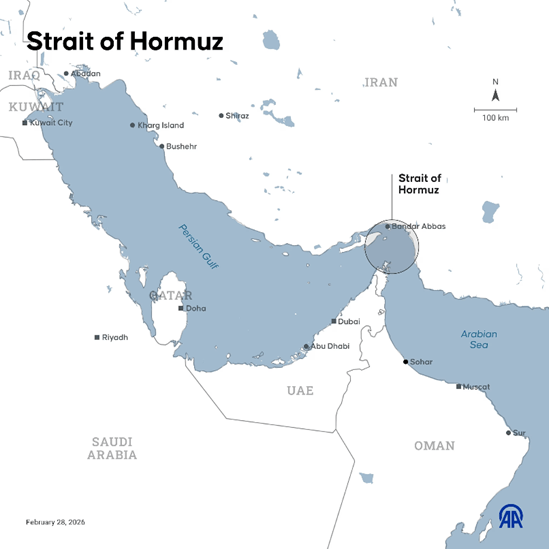
It’s a common question I hear from clients: “If the U.S. is producing record amounts of its own oil, why does a conflict thousands of miles away in the Middle East make it more expensive to fill up my SUV in suburbs?” It feels like a disconnect, but the answer lies in the fact that oil isn’t just a local resource—it’s a global currency. Even if not a single drop of oil from the Strait of Hormuz ever reaches a U.S. refinery, the closure of that vital waterway sends a shockwave through the global market that changes the price of every barrel on earth, including the ones produced right here in the U.S.

Why U.S. Oil Prices Are Rising

West Texas Intermediate (WTI) is the U.S. benchmark for oil. While it is produced domestically, its price is heavily influenced by global supply and demand.

  • Global Competition for Barrels: When 20% of the world’s oil supply is cut off at the Strait of Hormuz, countries that previously relied on Middle Eastern oil (like those in Asia and Europe) must find it elsewhere. They begin bidding on any available barrel, including those produced in the U.S., which drives up the price for everyone.
  • Market Interconnectivity: Traders look for the highest price globally. If global benchmarks like Brent crude spike, U.S. producers will sell to international buyers unless domestic prices rise to match.

Why U.S. Gas Prices Are Increasing

Retail gasoline prices respond to the replacement cost of fuel, not just the current supply.

  • Refining Realities: Although the U.S. produces more oil than it consumes, our refineries are often configured to process heavy crude imported from abroad rather than the “light sweet” crude produced in Texas. Disruptions in global shipping force refiners to pay more for suitable crude, a cost passed to the pump. Why our refineries aren’t configured to process U.S. oil is a whole other discussion.
  • Anticipating Future Costs: Gas station owners set prices based on what it will cost to buy their next shipment. If they see wholesale oil prices skyrocketing due to the Strait’s closure, they raise prices immediately to ensure they have enough cash to restock their tanks at the new, higher rate.
  • “Rockets and Feathers”: Economists note that gas prices typically rise quickly (like a rocket) when oil prices spike but fall slowly (like a feather) even after tensions ease, as retailers are cautious about lowering prices until they are sure their replacement costs have stabilized.

Ultimately, while we have achieved a high level of energy independence on paper, we are still tied to a global price tag. When 20% of the world’s oil supply is suddenly at risk, the “neighborhood” of global energy becomes a lot more expensive for everyone. Understanding this helps us look past the daily headlines and focus on the broader economic reality: in a connected world, a bottleneck in the Middle East is felt at every gas station in America.

Please comment or send an email if you have any questions.

Joe Baker, CFP®

Baker Asset Management, LLC

joebaker@bakerassetmanagement.com
Beyond the Barrel: Why the Strait of Hormuz is the Chokepoint for Global Industry

The Strait of Hormuz is often called the “world’s most important oil artery,” but its role in the global economy extends far beyond just crude oil. As of March 2026, the ongoing conflict involving the U.S., Israel, and Iran has effectively turned this narrow waterway into a “nightmare scenario” for global trade. Beyond the millions of barrels of crude, the Strait is the exit point for 20% of the world’s Liquefied Natural Gas (LNG), nearly a third of the global seaborne fertilizer trade, and a massive 8% of the world’s aluminum supply. From the essential chemicals like sulfur that power our mines and farms to the refined fuels that keep global shipping afloat, the blockade of Hormuz isn’t just an energy crisis, it is a total systemic disruption of the materials that build our cities, feed our populations, and power our technology.

Below are the main commodities that pass through the Strait and how the current war is impacting their supply and pricing.

1. Energy: The Lifeblood of the Global Economy

The Strait of Hormuz is the primary conduit for energy moving from the Persian Gulf to the rest of the world.

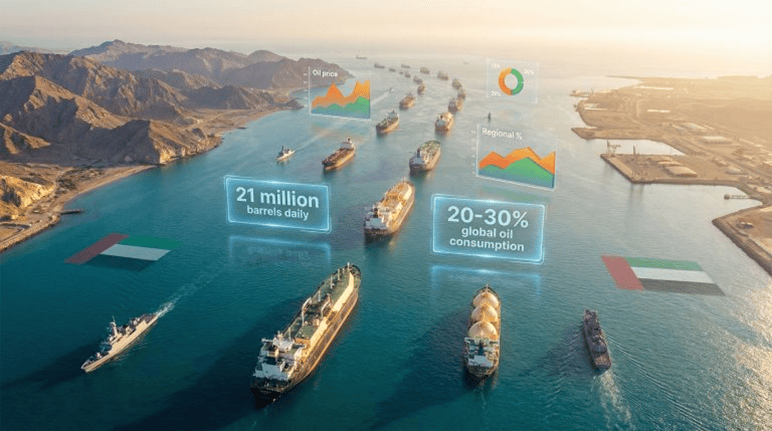
Crude Oil & Petroleum Liquids: Roughly 20–21 million barrels per day (bpd)—about 20% of global consumption—transit the Strait.

Impact: Since the escalation on February 28, 2026, oil prices have been highly volatile. Brent crude spiked from around $70 to a peak of nearly $120 per barrel before stabilizing near $90.

Supply: Most exports go to Asia (China, India, Japan, South Korea). With the Strait effectively under blockade, these nations are facing immediate supply shortages.

Liquefied Natural Gas (LNG): About 20% of the world’s seaborne LNG passes through the Strait, almost all of it from Qatar.

Impact: QatarEnergy recently declared force majeure and suspended production at its main facilities following regional attacks. This has caused European natural gas futures to jump by over 70% in early March.


2. Agriculture: The Fertilizer Crisis

While less discussed than oil, the Strait is a critical chokepoint for the materials that grow the world’s food.

Fertilizers (Urea, Ammonia, Phosphates): Between 25% and 33% of the global seaborne trade in fertilizer raw materials passes through the Strait.

Impact: Regional producers like Saudi Arabia and Iran are massive exporters of urea. The “soft closure” of the Strait has halted these shipments, causing benchmark Egyptian urea prices to rise by more than 25%.

Economic Ripple: Because half of global food production relies on synthetic fertilizers, this disruption is expected to push up the prices of household staples like bread, pasta, and animal feed globally.


3. Industrial Metals: The Aluminum Squeeze

The Gulf region has become a major hub for high-grade industrial metals, which are now trapped behind the blockade.

Aluminum: The Gulf produces about 8% of the world’s aluminum. Smelters in Bahrain, Qatar, and the UAE rely on the Strait for both exporting finished metal and importing raw materials like bauxite and alumina.

Impact: Qatari smelters (like Qatalum) have begun shutting down due to gas supply suspensions. This “dual squeeze”—blocking both raw material imports and finished metal exports—has sent aluminum prices soaring on the London Metal Exchange.


4. The Middle East: The World’s Sulfur Engine

The Persian Gulf region accounts for approximately 50% of the global seaborne sulfur trade. It is produced primarily as a byproduct of natural gas processing and oil refining at massive hubs like Ras Laffan (Qatar) and Ruwais (UAE).

Impact: Closing the Strait of Hormuz halts both the fuel and the feedstock for sulfuric acid—the most produced chemical on Earth. Without this acid, we lose the ability to extract copper and cobalt. No copper or cobalt means no EV batteries, no power transformers, and no data center hardware.


In summary, the crisis in the Strait of Hormuz is a stark reminder that our globalized economy is only as resilient as its most narrow corridor. We have long viewed this waterway through the lens of oil prices, but the events of March 2026 have proven that the stakes are far more complex. When the Strait closes, the world loses more than just fuel; it loses the LNG heating European homes, the aluminum framing our modern architecture, the fertilizers sustaining global agriculture, and even the airfreight capacity that moves our electronics and medicines. The ‘Hormuz Factor’ is not merely an energy shock—it is a systemic threat to the physical materials that build and feed our world. Let’s hope we can get a quick resolution to this ill-advised war.

Please comment or send an email if you have any questions.

Joe Baker, CFP®

Baker Asset Management, LLC

joebaker@bakerassetmanagement.com

Big Changes Coming To Social Security Benefits

Recently, the Social Security Fairness Act was signed into law. Its primary purpose is to provide more equitable Social Security benefits for public sector workers and their families.

The way that the new law will achieve this objective is by removing rules that reduce social security benefit payments to workers who receive pensions from employers that did not withhold Social Security taxes. This typically applies to public sector workers (like teachers, firefighters, and state employees) whose pensions were not funded by Social Security.

Here are the two rules that will be removed by the Social Security Fairness Law:

  • Windfall Elimination Provision (WEP) – Reduces Social Security benefits for individuals who receive pensions from employers that did not withhold Social Security taxes (like state and local governments).
  • Government Pension Offset (GPO) – Reduces or eliminates Social Security benefits for spouses of public sector retirees.

This is a major change and a huge increase in social security benefits for public sector workers. For many, it will be life changing, in a good way.

Of course, the downside is the higher funding costs which could accelerate the depletion of the social security fund. 2035 is the expected year that there won’t be enough money to pay 100% of the benefits. But I have a feeling that Congress will get that fixed right before the fund runs out of money.

Please comment or send an email if you have any questions.

Joe Baker, CFP®

Baker Asset Management, LLC

joebaker@bakerassetmanagement.com

How Long Will This Bull Market Last?

We recently hit the two-year anniversary of the current bull market in stocks. As a refresher, a bull market happens when stock prices have gone up 20% or more from the previous low for a sustained period of time. The current bull market started on October 12, 2022, and is being sustained by an expanding economy, low unemployment, and, most recently, falling interest rates.

Two years seems like a pretty long time for stocks to go up consistently, so how long can we expect this bull market to last? There’s no fool-proof way to determine the length of a bull market with any accuracy but we can look at historical data to see how long they have lasted in the past.

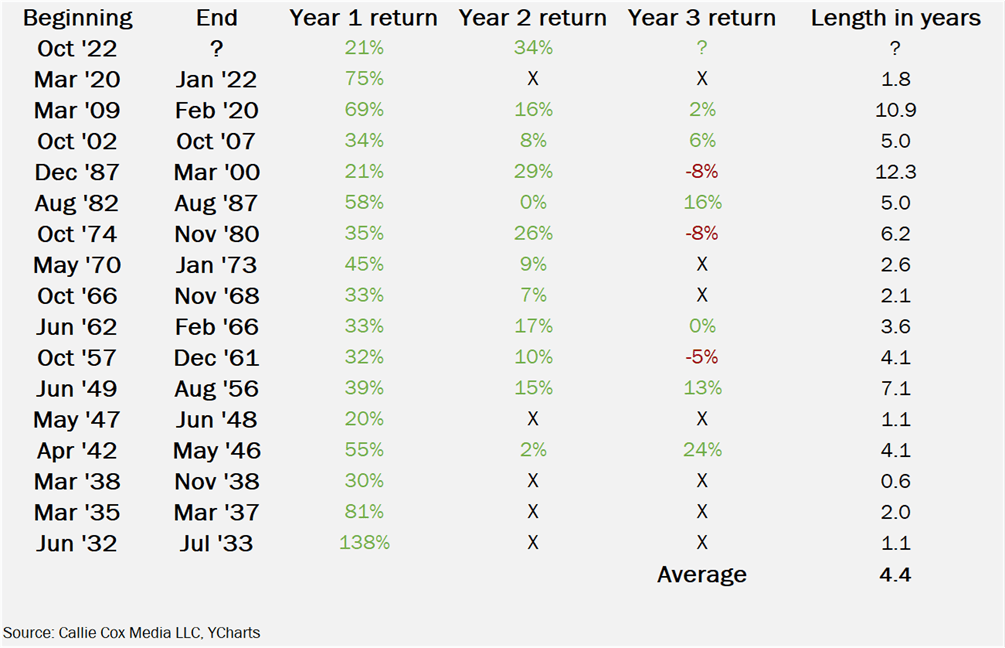
The table below shows all the bull markets of the S&P 500 index since the early 1930’s.

As you can see, bull markets have averaged almost 4.5 years in length so there’s a good chance that this bull market still has a ways to go. Of course, there are always unknown events that could throw a wrench into this bull, and don’t forget about an election that’s only a few weeks away that could stir up some volatility.

Please comment or send an email if you have any questions.

Joe Baker, CFP®

Baker Asset Management, LLC

joebaker@bakerassemanagement.com