Economic Headwinds: The Unnecessary Strain on U.S. Businesses and Consumers

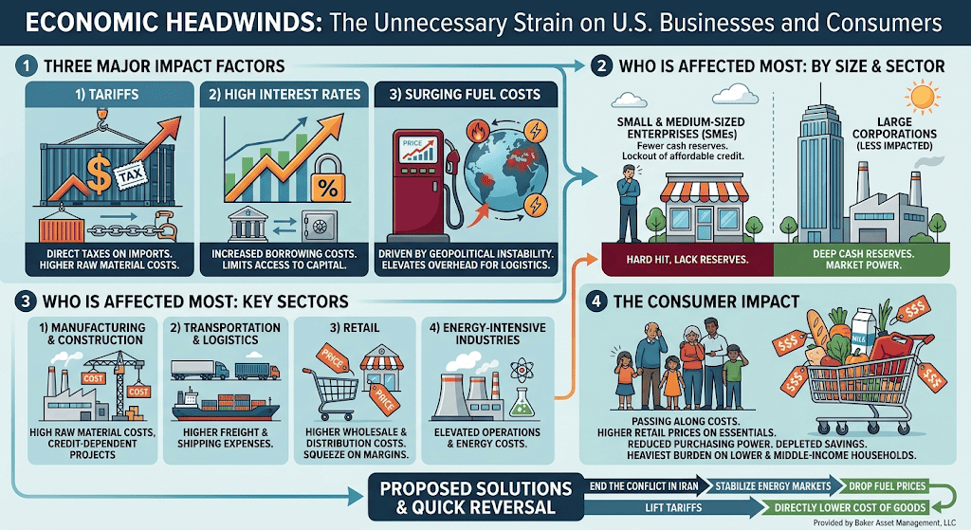
The U.S. economy has shown remarkable resilience, largely buoyed by a historic surge in productivity and investment driven by the artificial intelligence revolution. However, that underlying momentum is now in serious jeopardy due to three major self-inflicted pressures: high interest rates, trade tariffs, and surging inflation driven by skyrocketing fuel costs. These conditions create an unnecessary drag on economic expansion, but they could be reversed quickly by ending the conflict in Iran to stabilize global energy markets and removing trade tariffs.

Here is a breakdown of how these factors are impacting the market and who is bearing the brunt of the burden:

The Core Economic Pressures

  • Tariffs: Tariffs act as a direct tax on imported goods, raising the cost of raw materials and inventory. Businesses are forced to either absorb these losses or pass them on to consumers, driving inflation higher.
  • Surging Fuel Costs: Geopolitical conflict—specifically the war in Iran—has pushed fuel and energy prices up rapidly. This disproportionately increases overhead for any business reliant on physical operations, shipping, or manufacturing.
  • High Interest Rates: Elevated borrowing costs mean that securing capital for business expansion, equipment upgrades, or day-to-day cash flow management is now prohibitively expensive.

Who is Affected the Most?

  • By Business Size: Small and medium-sized enterprises (SMEs) bear the heaviest load. Unlike massive multinational corporations, SMEs lack the deep cash reserves and market power to absorb sustained cost increases, while high interest rates restrict their access to affordable working capital.

  • By Sector:
  • Manufacturing & Construction: Heavily reliant on raw materials subject to tariffs and credit-dependent for project financing.
  • Transportation & Logistics: Surging fuel costs act as an immediate hit to margins for any firm moving physical goods.
  • Retail: Retailers are squeezed on both ends—paying higher wholesale and transport costs while selling to consumers whose discretionary budgets are pinched by inflation.

  • By Consumer (Lower and Middle-Income Households): Ultimately, these corporate cost pressures spill over onto everyday households. As businesses pass along tariff taxes, elevated freight charges, and higher borrowing expenses, retail prices rise on essential goods like food, energy, and household staples. Lower and middle-income families—who spend a significantly larger portion of their take-home pay on basic necessities—bear the heaviest burden, facing reduced purchasing power and depleted savings as living costs climb.

The Solution

The clearest, most efficient path to economic relief requires straightforward policy changes. Ending the conflict in Iran would immediately ease energy market volatility and lower fuel prices at the pump, while lifting tariffs would directly reduce input costs for businesses and bring relief to consumer budgets across the board. By eliminating these primary drivers of inflation, the Federal Open Market Committee (FOMC) would have the leeway needed to lower interest rates without the risk of runaway prices, providing immediate relief to borrowing businesses and the broader economy.

Please comment or send an email if you have any questions.

Joe Baker, CFP®

Baker Asset Management, LLC

joebaker@bakerassetmanagement.com
Safeguarding Wealth: How to Protect Aging Family Members from Financial Fraud

The scale of modern elder financial exploitation is staggering. According to the FBI’s latest tracking, older Americans lose over $7.7 billion annually to fraudsters, with individual victims losing an average of $120,000. While sophisticated digital and artificial intelligence (AI) voice-cloning scams are rapidly escalating, data reveals that roughly 70% of financial abuse is actually committed by individuals known to the senior, such as predatory caregivers or dishonest family acquaintances.

As a fiduciary, I assess risk objectively. Protecting your family’s generational wealth means moving beyond reactive concern and implementing proactive, data-informed safeguards.

Step-by-Step Defense Protocol

Implementing structural guardrails across your family’s accounts creates an immediate barrier against bad actors. Follow this order of operations to establish maximum protection:

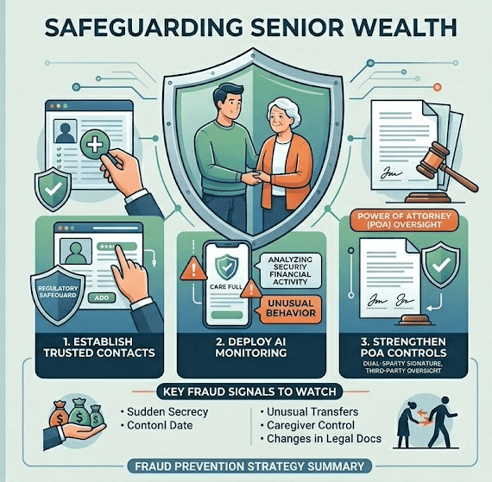
1.Establish Trusted Contacts: Immediate Priority.

Contact major financial custodians—such as Fidelity or Charles Schwab—to formally add a “Trusted Contact” to your family member’s accounts. Under FINRA Rule 2165, this provides institutions with a compliant regulatory framework to halt suspicious transactions and contact you directly without violating privacy laws.

2.Deploy Dedicated Monitoring Systems: Continuous Oversight.

Do not rely on standard bank alerts, which often miss specialized elder fraud patterns. Integrate a dedicated safety platform like Carefull. This AI-driven service links existing bank accounts to continuously analyze transactional data, flagging unusual cash-draining habits, missed bills, or home title changes.

3.Consolidate Fragmented Accounts: Streamline Administration.

Seniors with multiple accounts scattered across different institutions face significantly higher exposure. Consolidate these assets into a single primary custodian. This vastly simplifies oversight, limits data exposure, and allows you to establish unified security alerts.

4.Restructure Power of Attorney (POA) Controls: Legal Guardrails.

Review existing estate planning documents. A standard POA can inadvertently act as a license to steal if left unmonitored. Ensure your family’s legal documents include accountability provisions, such as requiring dual signatures or independent third-party CPA oversight for large asset liquidations.

Identifying the Behavioral Red Flags

Preventing loss requires recognizing changes in behavior before assets leave an account. Watch closely for these primary indicators:

  • Financial Anomalies: Uncharacteristic out-of-state wire requests, sudden ATM withdrawals by a companion, or sudden attempts to purchase untraditional retail assets like gift cards or cryptocurrency.
  • Social Isolation: A new “friend” or caregiver who insists on managing the senior’s schedule, acts as an intermediary during financial conversations, or encourages secrecy regarding financial decisions.

The Bottom Line: Fraudsters rely entirely on isolation and administrative complexity. By centralizing accounts at major custodians, adding verified trusted contacts, and utilizing automated tools like Carefull, you build a structural defense system that protects your family’s long-term financial health. Take the time to review these accounts with your loved ones and put these administrative blockades in place.

Please comment or send an email if you have any questions.

Joe Baker, CFP®

Baker Asset Management, LLC

joebaker@bakerassetmanagement.com
The IPO Reality Check: What History Tells Us About Post-Debut Performance

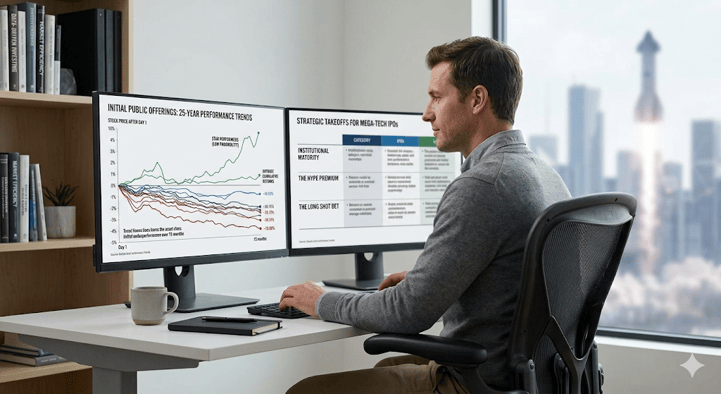
Just ran some numbers on historical initial public offerings (IPOs) to provide a data-driven perspective on what the future might hold for highly anticipated market debuts like SpaceX, OpenAI, and Anthropic. While the media buzz surrounding mega-tech listings often generates massive retail excitement, the historical data over the last 25 years tells a much more cautious story for the 12 months following a company’s public debut.

Data-Driven Insights: The 12-Month Post-IPO Track Record

When evaluating historical IPO performance over the past two and a half decades, the data consistently refutes the myth of guaranteed first-year gains. Financial studies reveal several critical trends regarding how companies perform in the 365 days after hitting the public markets:

  • The “First-Day Pop” vs. Long-Term Reality: Historically, IPOs are known for significant first-day underpricing, giving early institutional investors an average initial “pop” of roughly 15% (Lowry et al., 2017). However, for everyday investors buying shares on the open market after day one, the subsequent 12 months frequently see a reversal of fortune.
  • Systemic Underperformance: Extensive long-run historical data indicates that, on average, IPOs tend to underperform broad market benchmarks—such as the S&P 500 or industry-specific indices—during their first one to three years (Ang et al., 2006).
  • The Size and Age Factors: Performance varies wildly based on a company’s maturity at the time of the listing. Smaller, younger startups exhibit severe average underperformance, with cumulative average abnormal returns dropping significantly in the first year (Siev & Qadan, 2022). Conversely, large, heavily capitalized, and older firms tend to manage the transition to public markets with far less volatility, though they still frequently lag behind established market peers in the short term (Siev & Qadan, 2022).
  • The “Star Performer” Statistical Outliers: The broader average of IPO performance is heavily weighed down by a high failure rate. Statistically, the vast majority of IPOs underperform, while the overall asset class is propped up by a tiny minority (roughly 2%) of “star performers” that achieve monumental returns (Ang et al., 2006).

What This Means for upcoming IPOs such as SpaceX, OpenAI, and Anthropic:

Applying this decision-making framework to the dominant tech private giants of today yields specific strategic takeaways:

Risk & Valuation VariableStrategic Application to Upcoming Mega-Tech IPOs
Institutional MaturityUnlike the speculative tech listings of the 1999–2000 dot-com bubble, firms like SpaceX, OpenAI, and Anthropic will enter the public markets as massive, heavily capitalized enterprises with massive global footprints. According to historical trends, their large size and operational age should structurally protect them from the extreme 40%+ drop-offs seen in smaller, speculative IPOs (Siev & Qadan, 2022).
The Hype PremiumBecause these brands carry unprecedented cultural and technological visibility, their IPOs will likely face intense public demand. This historically leads to severe initial underpricing (to benefit institutional insiders) followed by a retail-driven valuation peak on day one, which frequently leads to a cooling-off period and negative market-adjusted returns over the subsequent 12 months.
The “Long Shot” BetInvestors backing OpenAI or Anthropic are implicitly betting that these firms will become the absolute “star outliers” of the decade (Ang et al., 2006). While the historical probability of any random IPO becoming a permanent market leader is low, companies with profound structural moats stand the best statistical chance of breaking the traditional 12-month underperformance trend.

The historical data over the last 25 years sends a clear warning to investors: buying into the immediate 12-month aftermath of a high-profile tech IPO is statistically a losing proposition compared to holding a broad-market index. While mega-cap innovators like SpaceX or OpenAI possess the scale to avoid the catastrophic first-year collapses of smaller startups, history dictates that the safest, most optimized administrative path for retail capital is often patience—waiting for the initial regulatory, insider lockup, and hype cycles to clear before establishing a long-term position.

Please comment or send an email if you have any questions.

Joe Baker, CFP®

Baker Asset Management, LLC

joebaker@bakerassetmanagement.com

References

Ang, A., Gu, L., & Hochberg, Y. V. (2006). Is IPO underperformance a peso problem? National Bureau of Economic Research. https://doi.org/10.3386/w12203

Cited by: 81

Lowry, M., Michaely, R., & Volkova, E. (2017). Initial Public Offerings: A synthesis of the literature and directions for future research. Foundations and Trends® in Finance, 11(3-4), 154-320. https://doi.org/10.1561/0500000050

Cited by: 334

Siev, S., & Qadan, M. (2022). Call me when you grow up: Firms’ age, size, and IPO performance across sectors. Journal of Risk and Financial Management, 15(12), 586. https://doi.org/10.3390/jrfm15120586

Cited by: 19

Why Global Shocks Hit Your Local Pump: The Strait of Hormuz and Your Wallet

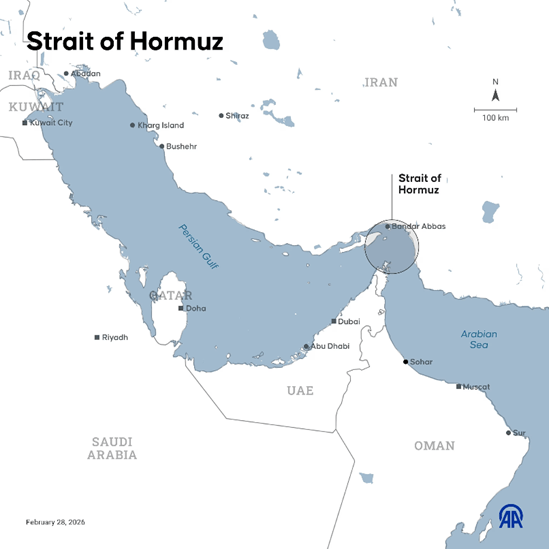
It’s a common question I hear from clients: “If the U.S. is producing record amounts of its own oil, why does a conflict thousands of miles away in the Middle East make it more expensive to fill up my SUV in suburbs?” It feels like a disconnect, but the answer lies in the fact that oil isn’t just a local resource—it’s a global currency. Even if not a single drop of oil from the Strait of Hormuz ever reaches a U.S. refinery, the closure of that vital waterway sends a shockwave through the global market that changes the price of every barrel on earth, including the ones produced right here in the U.S.

Why U.S. Oil Prices Are Rising

West Texas Intermediate (WTI) is the U.S. benchmark for oil. While it is produced domestically, its price is heavily influenced by global supply and demand.

  • Global Competition for Barrels: When 20% of the world’s oil supply is cut off at the Strait of Hormuz, countries that previously relied on Middle Eastern oil (like those in Asia and Europe) must find it elsewhere. They begin bidding on any available barrel, including those produced in the U.S., which drives up the price for everyone.
  • Market Interconnectivity: Traders look for the highest price globally. If global benchmarks like Brent crude spike, U.S. producers will sell to international buyers unless domestic prices rise to match.

Why U.S. Gas Prices Are Increasing

Retail gasoline prices respond to the replacement cost of fuel, not just the current supply.

  • Refining Realities: Although the U.S. produces more oil than it consumes, our refineries are often configured to process heavy crude imported from abroad rather than the “light sweet” crude produced in Texas. Disruptions in global shipping force refiners to pay more for suitable crude, a cost passed to the pump. Why our refineries aren’t configured to process U.S. oil is a whole other discussion.
  • Anticipating Future Costs: Gas station owners set prices based on what it will cost to buy their next shipment. If they see wholesale oil prices skyrocketing due to the Strait’s closure, they raise prices immediately to ensure they have enough cash to restock their tanks at the new, higher rate.
  • “Rockets and Feathers”: Economists note that gas prices typically rise quickly (like a rocket) when oil prices spike but fall slowly (like a feather) even after tensions ease, as retailers are cautious about lowering prices until they are sure their replacement costs have stabilized.

Ultimately, while we have achieved a high level of energy independence on paper, we are still tied to a global price tag. When 20% of the world’s oil supply is suddenly at risk, the “neighborhood” of global energy becomes a lot more expensive for everyone. Understanding this helps us look past the daily headlines and focus on the broader economic reality: in a connected world, a bottleneck in the Middle East is felt at every gas station in America.

Please comment or send an email if you have any questions.

Joe Baker, CFP®

Baker Asset Management, LLC

joebaker@bakerassetmanagement.com
Beyond the Barrel: Why the Strait of Hormuz is the Chokepoint for Global Industry

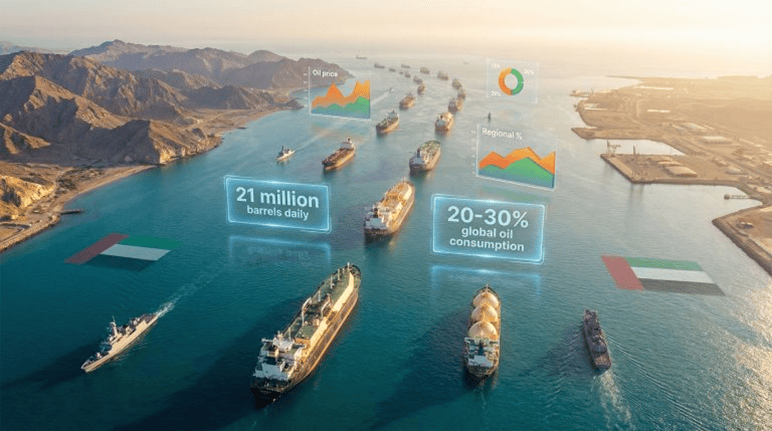
The Strait of Hormuz is often called the “world’s most important oil artery,” but its role in the global economy extends far beyond just crude oil. As of March 2026, the ongoing conflict involving the U.S., Israel, and Iran has effectively turned this narrow waterway into a “nightmare scenario” for global trade. Beyond the millions of barrels of crude, the Strait is the exit point for 20% of the world’s Liquefied Natural Gas (LNG), nearly a third of the global seaborne fertilizer trade, and a massive 8% of the world’s aluminum supply. From the essential chemicals like sulfur that power our mines and farms to the refined fuels that keep global shipping afloat, the blockade of Hormuz isn’t just an energy crisis, it is a total systemic disruption of the materials that build our cities, feed our populations, and power our technology.

Below are the main commodities that pass through the Strait and how the current war is impacting their supply and pricing.

1. Energy: The Lifeblood of the Global Economy

The Strait of Hormuz is the primary conduit for energy moving from the Persian Gulf to the rest of the world.

Crude Oil & Petroleum Liquids: Roughly 20–21 million barrels per day (bpd)—about 20% of global consumption—transit the Strait.

Impact: Since the escalation on February 28, 2026, oil prices have been highly volatile. Brent crude spiked from around $70 to a peak of nearly $120 per barrel before stabilizing near $90.

Supply: Most exports go to Asia (China, India, Japan, South Korea). With the Strait effectively under blockade, these nations are facing immediate supply shortages.

Liquefied Natural Gas (LNG): About 20% of the world’s seaborne LNG passes through the Strait, almost all of it from Qatar.

Impact: QatarEnergy recently declared force majeure and suspended production at its main facilities following regional attacks. This has caused European natural gas futures to jump by over 70% in early March.


2. Agriculture: The Fertilizer Crisis

While less discussed than oil, the Strait is a critical chokepoint for the materials that grow the world’s food.

Fertilizers (Urea, Ammonia, Phosphates): Between 25% and 33% of the global seaborne trade in fertilizer raw materials passes through the Strait.

Impact: Regional producers like Saudi Arabia and Iran are massive exporters of urea. The “soft closure” of the Strait has halted these shipments, causing benchmark Egyptian urea prices to rise by more than 25%.

Economic Ripple: Because half of global food production relies on synthetic fertilizers, this disruption is expected to push up the prices of household staples like bread, pasta, and animal feed globally.


3. Industrial Metals: The Aluminum Squeeze

The Gulf region has become a major hub for high-grade industrial metals, which are now trapped behind the blockade.

Aluminum: The Gulf produces about 8% of the world’s aluminum. Smelters in Bahrain, Qatar, and the UAE rely on the Strait for both exporting finished metal and importing raw materials like bauxite and alumina.

Impact: Qatari smelters (like Qatalum) have begun shutting down due to gas supply suspensions. This “dual squeeze”—blocking both raw material imports and finished metal exports—has sent aluminum prices soaring on the London Metal Exchange.


4. The Middle East: The World’s Sulfur Engine

The Persian Gulf region accounts for approximately 50% of the global seaborne sulfur trade. It is produced primarily as a byproduct of natural gas processing and oil refining at massive hubs like Ras Laffan (Qatar) and Ruwais (UAE).

Impact: Closing the Strait of Hormuz halts both the fuel and the feedstock for sulfuric acid—the most produced chemical on Earth. Without this acid, we lose the ability to extract copper and cobalt. No copper or cobalt means no EV batteries, no power transformers, and no data center hardware.


In summary, the crisis in the Strait of Hormuz is a stark reminder that our globalized economy is only as resilient as its most narrow corridor. We have long viewed this waterway through the lens of oil prices, but the events of March 2026 have proven that the stakes are far more complex. When the Strait closes, the world loses more than just fuel; it loses the LNG heating European homes, the aluminum framing our modern architecture, the fertilizers sustaining global agriculture, and even the airfreight capacity that moves our electronics and medicines. The ‘Hormuz Factor’ is not merely an energy shock—it is a systemic threat to the physical materials that build and feed our world. Let’s hope we can get a quick resolution to this ill-advised war.

Please comment or send an email if you have any questions.

Joe Baker, CFP®

Baker Asset Management, LLC

joebaker@bakerassetmanagement.com

Investing in the $630 Billion Race to Power AI

We often think of Artificial Intelligence as something ethereal—code floating in the “cloud.” But the reality of 2026 is grounded in steel, concrete, and energy supply. With Big Tech “hyperscalers” like Microsoft, Amazon, Meta, and Google projected to spend between $600 and $650 billion this year alone on infrastructure, we are witnessing an industrial buildout that economists argue now rivals the railroad expansion of the 1850s. While the first phase of the AI revolution was defined by who could design the smartest chip, the next phase will be defined by who can physically power it. The opportunity for investors is no longer just about the model; it is about the massive machine required to run it.

What is an AI Data Center?

Unlike traditional data centers that store files and run websites, AI data centers are designed for massively parallel computing. This creates unprecedented heat and power density. (Geek alert) While a standard server rack consumes 5–10 kW, a modern rack equipped with NVIDIA Blackwell or H100 GPUs demands 40 kW to over 100 kW. This physical constraint is forcing a complete redesign of the data centers needed in the AI world.

The Builders & Locations

The build-out is led by the “Hyperscalers”—Microsoft, Amazon (AWS), Google, and Meta—who are racing to secure land and power. Because these facilities consume gigawatts of electricity (enough to power small cities), they are moving away from congested hubs like Northern Virginia to regions with available power and land.

  • The Power Belt (Ohio, Indiana, Midwest): Emerging as a prime location due to grid capacity and land availability.
  • Texas: Attracting massive investment due to its independent energy grid and renewable abundance.
  • Nuclear Sites: Data centers are increasingly being built “behind the meter” at nuclear plants (e.g., Pennsylvania) to guarantee 24/7 zero-carbon power.

Investment Opportunities: The “Picks & Shovels”

Investors are looking beyond the chipmakers to the companies building the physical infrastructure. This includes thermal management (cooling), power distribution, and real estate.

TickerCompanyPrimary RoleInvestment Thesis
VRTVertiv HoldingsLiquid CoolingMarket leader in thermal management; essential for cooling NVIDIA’s hot chips.
ETNEaton CorpPower MgmtCritical electrical infrastructure (transformers, switchgear) for grid upgrades.
CEGConstellation EnergyNuclear PowerOwner of largest US nuclear fleet; prime partner for baseload AI power deals.
DLRDigital RealtyData Center REITGlobal landlord for data centers with strong hyperscaler relationships.
MODModine MfgThermal SystemsPivot from automotive cooling to high-growth data center thermal solutions.
ANETArista NetworksAI NetworkingProvides the ultra-fast ethernet switches needed to connect GPU clusters.

Investment Note: This list is for informational purposes only and does not constitute financial advice. Stocks in this sector, particularly pure plays like Vertiv, have seen significant volatility.


As the AI race accelerates, the primary bottleneck has shifted from silicon availability to energy reliability. With modern GPU racks consuming over 100 kW of power—ten times the standard of a decade ago—the digital economy is colliding with the physical limits of the power grid. For the astute investor, this signals a clear pivot: the most durable long-term value may not be found in the volatile software wars, but in the “picks and shovels” of the infrastructure supply chain—the liquid cooling systems, the copper interconnects, and the baseload nuclear power that keep the lights on. The code is written, but the concrete is just beginning to pour.

Please comment or send an email if you have any questions.

Joe Baker, CFP®

Baker Asset Management, LLC

joebaker@bakerassetmanagement.com
The Pros and Cons of a K-Shaped Economy

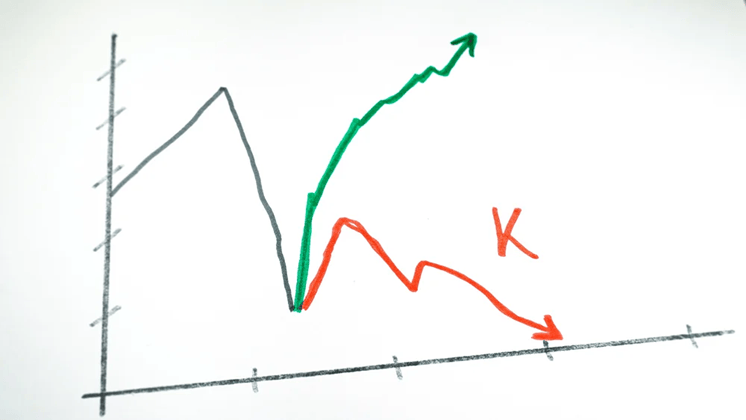
A K-shaped economy describes a situation where, following an economic downturn (pandemic), different parts of the economy recover at vastly different rates, resembling the two legs of the letter “K”. The key characteristic is the widening gap between the wealthy, who see their fortunes rise, and lower-income individuals and some industries, who continue to struggle. Looking back, this started shortly after the pandemic shutdown and the divergence between the upper- and lower-income legs became more evident once the federal government stopped the covid relief payments.

Let’s break it down.

Pros of the K-Shaped Economy (The Upper Leg)

The upper leg of the “K” highlights robust growth in certain areas, which can benefit the overall economy in specific ways:

  • Innovation and Productivity: Sectors that thrive, often driven by technology and large-scale investment, experience rapid innovation and high productivity. This leads to strong corporate profits and stock market performance.
  • Targeted Investment: The success of leading industries attracts significant investment, which further fuels growth in those areas (e.g., AI infrastructure and data centers).
  • Economic Resilience (for some): High-income households benefit from appreciating assets (stocks, real estate) and can maintain high consumer spending, which props up a significant portion of the overall economy.

Examples of the Upper Leg:

  • Technology Companies: Firms involved in software, artificial intelligence, and cloud computing (e.g., the “Magnificent 7” tech stocks) have seen immense revenue and stock price growth.
  • Wealthy Households: Individuals with significant financial investments see their net worth climb due to strong market performance and asset appreciation.
  • Premium Goods/Services: Companies selling high-end products, like luxury cars or premium airline seating, experience strong demand from affluent consumers. 
  • High-skill Professionals: These individuals often maintain job security and can benefit from remote work flexibility and rising wages.

Cons of the K-Shaped Economy (The Lower Leg)

The lower leg reveals significant challenges, primarily centered around growing disparity and economic strain:

  • Widening Inequality: The most significant downside is the exacerbation of the gap between the rich and poor, leading to a less equitable society.
  • Financial Strain: Lower-income individuals face immense pressure from stagnant wages, high inflation, surging debt, and rising costs for essential goods like housing and groceries.
  • Unsustainable Growth: An economy propelled largely by the wealthiest 10% (who account for about half of all spending) may not be sustainable long-term. If the struggling majority cuts back spending significantly due to financial distress, it could pull the entire economy into a recession.
  • Policymaking Challenges: The K-shape makes it difficult for policymakers to implement broad stimulus actions, as measures that help the struggling lower leg (e.g., low interest rates) might overheat the booming upper leg, and vice versa.

Examples of the Downward Leg:

  • Service & Hospitality Industries: Businesses like restaurants and hotels have struggled with recovery, job losses, and revenue drops.
  • Lower-Income Households: This group faces increasing debt, stagnant real wage growth, and higher rates of loan delinquencies.
  • Younger Generations: This group often face greater challenges, grappling with student loans and high costs for necessities like housing and groceries.
  • Small Businesses: Many small, brick-and-mortar retailers and other local firms have been hit hard, lacking the capital and digital infrastructure of larger corporations.

It is also important to note that the current administration’s trade policies, particularly the tariffs, have made this situation so much worse for lower income households and small businesses.


To summarize, the K-shaped economy creates a significant increase in wealth inequality. While overall economic indicators like GDP or the stock market may appear strong, they don’t tell the full story, as many people are left behind. This divergence can create an economy that relies heavily on the spending of a small, wealthy segment of the population, which is not sustainable in the long term.

Please comment or send an email if you have any questions.

Joe Baker, CFP®

Baker Asset Management, LLC

joebaker@bakerassetmanagement.com

A Little Known IRS Program That Can Make Tax Season Less Taxing

There is a program offered by the IRS that allows you to file your federal taxes through an associated tax preparer for free! The IRS Free File program is a public-private partnership between the IRS and a group of tax software companies called the Free File Alliance. It allows eligible taxpayers to prepare and file their federal income tax returns online for free. Here’s how it works:

1. Eligibility:

  • Income: The main requirement is your Adjusted Gross Income (AGI). For the 2024 tax year (filing in 2025), the AGI limit is $84,000. This applies to all filing statuses (single, married filing jointly, etc.).
  • Other factors: Some participating companies may have additional eligibility requirements, such as age or state residency.

2. Accessing Free File:

3. Preparing and Filing:

  • Create an account: Once you’ve chosen a provider, you’ll be redirected to their website to create an account.
  • Follow the instructions: The software will guide you through the process of entering your tax information.
  • File electronically: When you’re finished, the software will transmit your return electronically to the IRS.

Key Features of IRS Free File:

  • Free federal return: Participating companies cannot charge you to prepare and e-file your federal tax return if you qualify.
  • Guided experience: The software uses a question-and-answer format to help you complete your return accurately.
  • Error checks: Built-in checks help catch mistakes and ensure your return is complete.
  • Direct deposit: You can choose to receive your refund via direct deposit for faster processing.

Important Notes:

  • State taxes: While federal filing is free, some providers may charge for state tax preparation.14 Check with your chosen provider for details.
  • Support: The level of customer support offered may vary between providers.
  • Accuracy: Always review your return carefully before filing, even with the help of software.

This is a great service that is most certainly underutilized by eligible tax filers and can potentially save you some hard-earned cash.

Please comment or send an email if you have any questions.

Joe Baker, CFP®

Baker Asset Management, LLC

joebaker@bakerassetmanagement.com

The Pros and Cons of Living Trusts

This is always a great time of the year to review your financial picture.

One of the items that you might be considering, or have considered before, is whether or not to establish a revocable living trust to hold your assets.

A revocable living trust is a legal document created by you (the grantor) while you are alive and of sound mind and body. Just like a will, a living trust spells out exactly what your desires are with regard to your assets, your dependents, and your heirs. But a won’t go into effect until after you die, whereas a living trust is already in effect.

There is little difference to owning your assets in your name or in your living trust’s name while you are alive and well. The benefits occur after you die or if you become incapable of handling your own affairs.

Here is a list of some of the benefits of having a living trust:

  • Avoids probate – This is probably the biggest reason people have a living trust. The trust bypasses the costly and time-consuming process of probate, which is conducted by the state courts of your residence when you die and has the authority to decide how to divvy up your assets.
  • Provides privacy – a living trust is not made public, so upon your death, your estate will be distributed in private. A will, on the other hand, is public record and so all transactions will be public as well.
  • Maintains control – If you become incapacitated in a way that you can no longer manage your assets, your handpicked successor trustee can manage your affairs without court intervention, and since the trust is revocable, if you dispute your incapacity, you can retain control yourself.

There are disadvantages as well:

  • Cost – A living trust can cost anywhere between $500 – $4,000, depending on the complexity. This is the price that you pay for the money saved by avoiding probate, which can typically run around 4% of your total estate value.
  • Bookkeeping – In order for your living trust to be of use, you have to transfer your assets into it. That means opening new accounts with the trust as owner for your bank and investment accounts. Also, transferring deeds and title for property into the trust name, which can be time consuming.

In summary, if you have a large family and/or a large number of assets, you may want to consider establishing a revocable living trust. It could save you and your family not just a lot of money, but also a ton of undue stress and strain on you and your family during difficult times.

If you have questions or want to know if you should establish a living trust, just shoot me an email.

Joe Baker, CFP®

Baker Asset Management, LLC

joebaker@bakerassetmanagement.com

How Long Will This Bull Market Last?

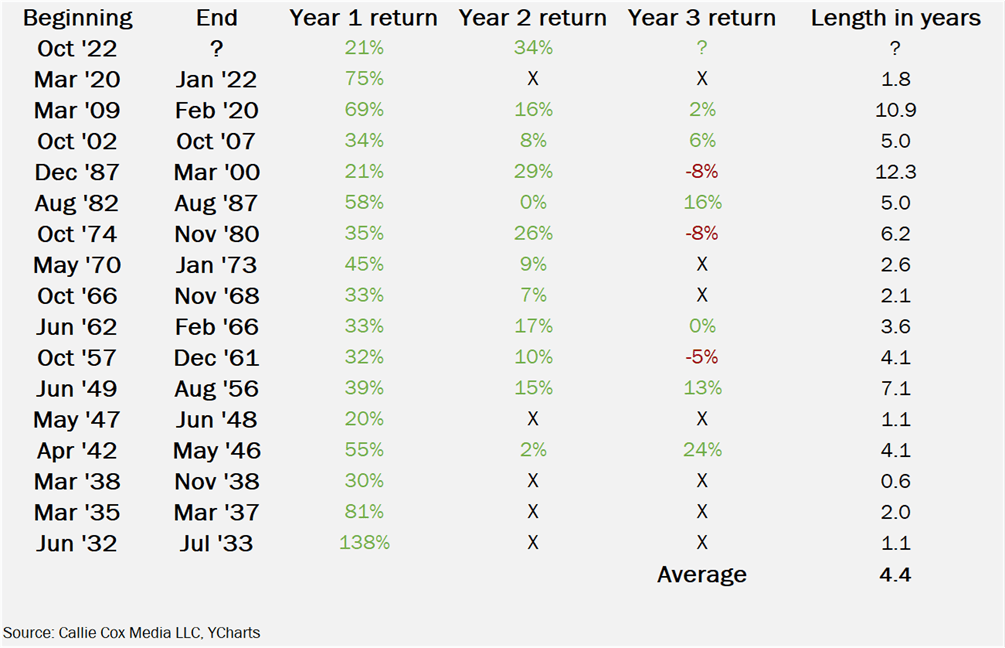
We recently hit the two-year anniversary of the current bull market in stocks. As a refresher, a bull market happens when stock prices have gone up 20% or more from the previous low for a sustained period of time. The current bull market started on October 12, 2022, and is being sustained by an expanding economy, low unemployment, and, most recently, falling interest rates.

Two years seems like a pretty long time for stocks to go up consistently, so how long can we expect this bull market to last? There’s no fool-proof way to determine the length of a bull market with any accuracy but we can look at historical data to see how long they have lasted in the past.

The table below shows all the bull markets of the S&P 500 index since the early 1930’s.

As you can see, bull markets have averaged almost 4.5 years in length so there’s a good chance that this bull market still has a ways to go. Of course, there are always unknown events that could throw a wrench into this bull, and don’t forget about an election that’s only a few weeks away that could stir up some volatility.

Please comment or send an email if you have any questions.

Joe Baker, CFP®

Baker Asset Management, LLC

joebaker@bakerassemanagement.com