
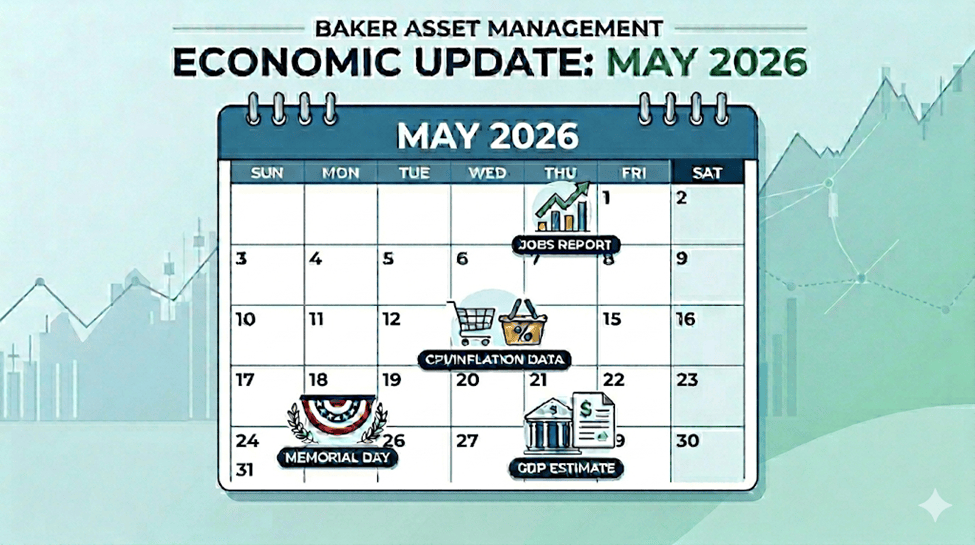
Calendar Notes
- May 25th, Monday – Memorial Day. Stock market is closed.
Stocks bounced back aggressively in April as investors jumped on the AI train once again. It was even more impressive that it occurred while our war with Iran continues to keep the Strait of Hormuz closed.
For the month of April, the S&P 500 had its best monthly performance since November of 2020, finishing with a gain of 10.40%, well above its historical average over the last thirty years of +2.40%. To put it simply: the index delivered nearly a full year’s worth of “average” returns in just 30 days. For the year, the index is now up 5.31%. Not bad, considering the circumstances.
Looking ahead, potential catalysts to move stocks this April continue to be Q1 earnings announcements and the hope that the Iran war is coming to an end. Recent economic data shows the job market is still in a low hire, low fire pattern and inflation is still on the rise, mainly due to higher energy prices caused by the war. This data provides little fuel to extend this market rally. However, if we could get out of this war and open the Strait, now that would be the boost the stock market needs to continue higher.
Historically, the performance of the S&P 500 index in May has been impressive. Over the last thirty years, it has had a return of approximately +1.35% return, on average. As I said, if we can get out of this war, we should have no problem beating that number.
Take a look at the Outlook section below to see what events could move the markets over the short term.
Bond prices continued to drop throughout April, as yields rose across most bond categories due to inflation fears caused mainly by the ongoing shutdown of the Strait of Hormuz. In fact, economic data just released showed that the PCE (Personal Consumption Expenditures) Price Index hit 3.2%. The PCE Price Index is essentially the “Fed’s Favorite Yardstick” for measuring inflation. While you probably hear about the CPI (Consumer Price Index) more often in the news, the PCE is the metric I watch most closely because it is what the Federal Reserve uses to set interest rate policy. With the PCE at a 3-year high, the Fed will be hard pressed to lower interest rates anytime soon.
The 10-year US Treasury note yield finished higher in April, settling at 4.38%, just above the 4.32% yield that it was at the beginning of the month. The 30-year bond yield closed out the month at 4.97%, 5 basis points higher than a month ago.
Checking the current high yield credit spread (HYCS) of 2.85%, it has dropped about 60 basis points from a month ago and continues to remain well below the long-term average of 5.20%. This suggests that high yield, aka junk bonds, are currently expensive relative to their historical risk-reward profile. I like to monitor this metric because if it gets above 5%, historically this has not been a good sign for the markets.
Bond investors will be waiting anxiously for the next FOMC meeting with a new Fed chairman, scheduled for June 17th. Expectations are changing daily so get ready for a very interesting meeting this June.
I continue to like bonds with maturities up to two years but plan on holding them until they mature.
Savings rates dipped slightly this past month despite the Federal Reserve keeping short-term interest rates unchanged. Regardless, rates are currently still attractive to risk-averse investors, especially if you take time to do some research. Just have a look at the table below to see the massive disparity between the national averages and highest rates available.
I am grateful that rates are remaining this high, considering there is so much demand: total assets in U.S. money market funds are sitting near all-time highs, hovering around $7.64 trillion, up 11% year-over-year. When will this trend reverse and see some of this cash rotate into the stock or bond markets? Probably not until rates for MMA, HYSA, and short-term CDs drop below 3.5%. This is another reason why the next FOMC meeting will be watched intently.
| Account Type | Average Rate (APY) | Highest Rate (APY) |
| Money Market Account | 0.48% | 4.22% |
| High-Yield Savings Account | 0.59% | 4.21% |
| 1-Year CD | 1.93% | 4.10% |
| 3-Year CD | 1.65% | 4.04% |
| 5-Year CD | 1.70% | 4.07% |
For now, CDs and MMAs are still a great place to put your cash and your emergency funds. Knowing this, it makes sense in most situations to put cash that you don’t immediately need into CDs with up to 2-year maturities. For emergency cash, stick to high yielding money market and savings accounts, of which the best are yielding about 4.2%. As always, keep the total under $250,000 per person at any one bank to ensure you are fully covered by the FDIC.
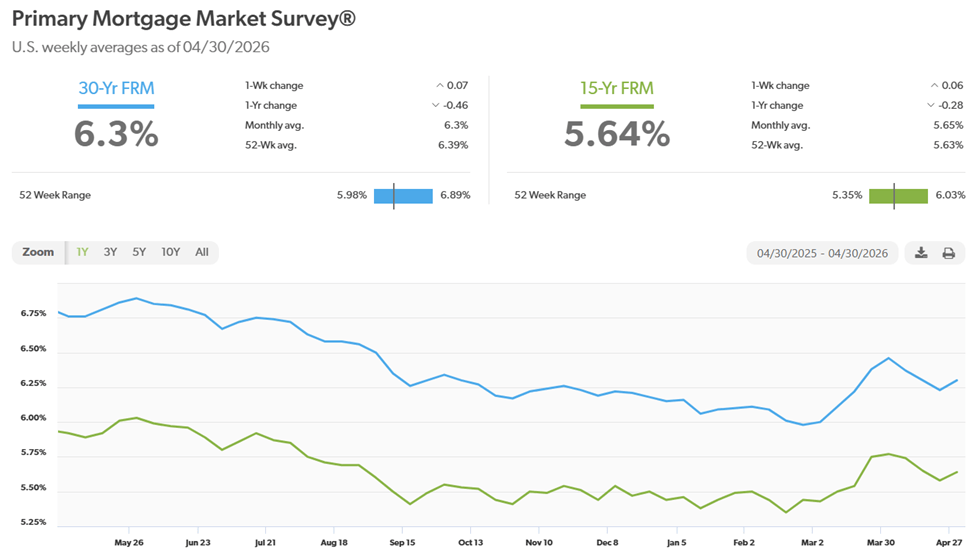
Mortgage rates dropped just a bit this past April, but still holding above the 6% level. This doesn’t help the refi market that much, but it appears to have spurred home builders, at least in the southeast region of the country. After talking to some home builder firms in my area, business seems to have picked up since earlier in the year, which is good news. Lumber prices are low, but prices of most other building materials have risen due to tariffs and the closure of the Strait of Hormuz. Still, any increase in inventory is better than none.
The 30-year fixed rate finished the month at 6.30%, down just 8 bps from last month. Looking ahead, rates will most likely remain in their current range and track the 10-year bond rate until inflation subsides (currently at 3.2%, highest since 2023).
Here is a look at the one-year chart of the 15- and 30-year mortgage rates from Freddie Mac.
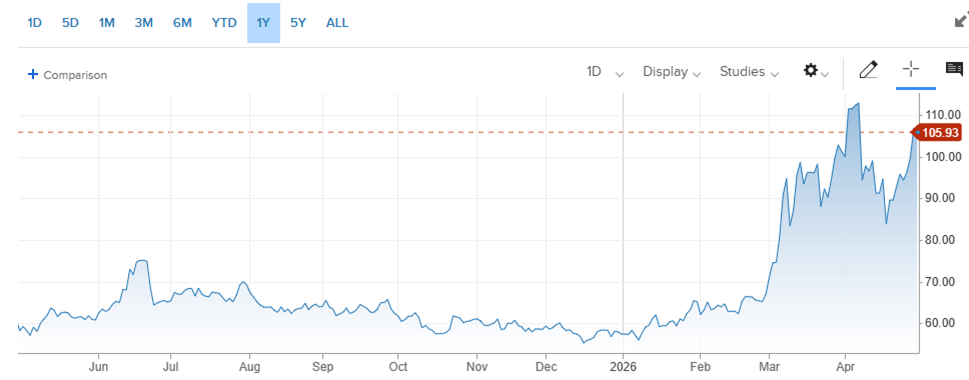
Oil prices had another very volatile month in April, jumping up and down as hopes of the war ending rose and fell almost daily. In the end, unfortunately, prices were higher across the globe with no resolution in sight. Not everyone is hurting: Oil drillers outside of the Middle East are making money hand over fist right now with prices nearly double what they were at the beginning of the year.
For the month of April, the price for a barrel of West Texas Intermediate (WTI) oil started at $101.94 and ended at $105.93, up about $4 for the month. FYI, it peaked at about $113 at the beginning of the month. For the year, it is now up $48.51 a barrel, almost 85%.
As expected, the International Energy Agency (IEA) nations have drained nearly 700 million barrels of oil from reserves to prevent reaching the $120/barrel peak hit in March. By the way, the IEA consists of 31 member countries, primarily advanced, industrialized economies. Key members include the United States, Japan, Germany, France, Canada, and the UK.
The Price Floor: As trade “normalizes,” these governments will become the world’s largest buyers to refill their stocks. This massive state-sponsored demand will act as a “permanent floor” under energy prices, preventing a return to the pre-war $60 level until at least mid-2027.
Looking ahead, if the war ends this May, we could see oil prices below $90 by the end of the year. As far as getting back to pre-war price levels, that could take quite a while due to the extensive infrastructure damage, the time it takes to restart oil fields that were shut in due to the war, and the lingering risk premium on oil prices for fear that the war will reignite.
Here’s a look at the one-year chart for U.S. oil:
Gasoline prices continued their historic climb, reaching a four-year high, as energy markets continue to suffer due to the current blockade of the Strait of Hormuz. The national average price hit $4.30 per gallon to end the month. Diesel is now at $5.50 per gallon, about $0.30 off of its all-time high reached back in June of 2022. It’s way worse in other parts of the world, particularly Europe and Asia. Oklahoma has the cheapest gas currently, checking in at $3.71 a gallon. California has the most expensive gasoline at $6.01 per gallon. FYI, a year ago, we were paying $3.18.
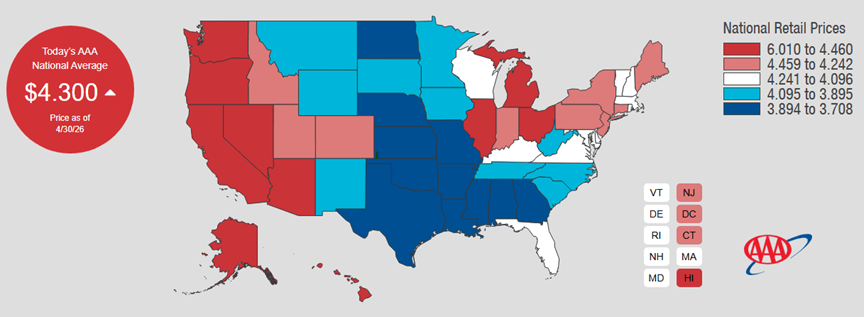
Check out the prices at the pump in your area: AAA Gas Prices.
Outlook
Events on the horizon that could move the markets in the near term:
- Fed, Rates, & Inflation: The Federal Open Market Committee (FOMC) met a few days ago and kept bank overnight lending rates unchanged, as expected. Stubborn inflation, aided by the ongoing war with Iran, has kept the FOMC in a steady-as-she-goes path. Another reason for the no change decision includes the low hire, low fire labor market, keeping unemployment in check. Also, wage growth has remained solid, largely due to the immigration restrictions causing labor shortages, providing more justification to keep interest rates elevated.
The next time the FOMC meets, it will be with a new chairman, and that is reason enough for investors to monitor the Fed closely over the next few months.
- Trump Administration Policies:
Trade – The refund process has begun for importers to reclaim the tariffs that they paid to U.S. Customs that were deemed illegal by SCOTUS. There are approximately 330,000 companies that are due an estimated $166 billion in overpaid duties. Because these funds were collected under an invalidated law, the outstanding balance is accruing roughly $650 million in interest each month ($22 million per day), creating significant pressure on the Treasury to expedite payments. This was an easily avoidable blunder on the part of the Trump administration that really hurt small businesses and lower income people the most. These refunds should show up on companies’ financial statements by the end of the year, hopefully.
Immigration – The administration’s immigration policies have had some positive impacts on the U.S. economy. The biggest has been wage growth. The scarcity of workers has forced employers to raise wages to attract native-born labor. Of course, the downside to higher wages is inflation, as companies pass on these higher input costs to consumers. Also, because the population is no longer growing via immigration, the economy now only needs to add about 20,000 to 50,000 jobs per month to keep the unemployment rate stable, a massive drop from the 100,000+ jobs required during the previous administration. Automation could replace many of these jobs that were vacated by immigrants, which would help keep the unemployment rate stable as well. Finally, the brain drain caused by some of these immigration policies could be remedied with the implementation of AI. A positive for both companies and investors.
- Iran Conflict: As this war drags on, its effect on the global economy continues to worsen. Even if it ended today, global trade would likely require 12 to 18 months to fully normalize. While the initial “peace dividend” would trigger an immediate rally in financial markets, the physical and structural damage to the global supply chain is far too deep for a quick fix.
Since there was no imminent nuclear threat from Iran, according to our intelligence services, and there certainly isn’t one now after our bombings, we should cut our losses and get the Strait of Hormuz opened back up as quickly as possible to let things get back to normal. The longer this goes on, the longer it’s going to take to normalize global trade, prices, alliances, etc.
Joe Baker, CFP®
Baker Asset Management, LLC
joebaker@bakerassetmanagement.com

