
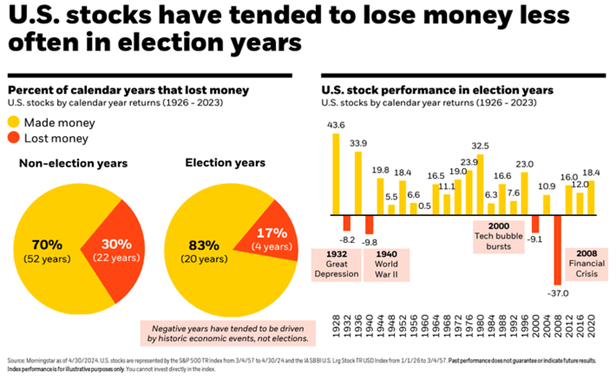
I saw some interesting charts in the past week that illustrate stock performance in a presidential election year.
First, in the chart above, you can see that stocks have performed well in past presidential election years. The four years that stocks had negative returns included some very significant economic and geopolitical events that contributed to their poor performance.
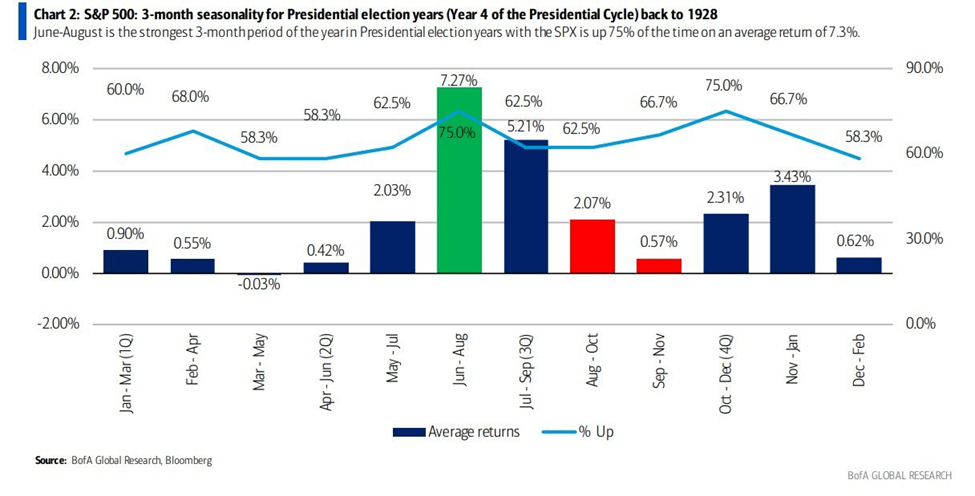
This next chart shows how stocks performed during every rolling three month stretch in an election year going all the way back to 1928. As you can see, the June, July, and August stretch is the best performing with a positive return 75% of the time and an average return of almost 7.3%.
The last chart simply shows the performance of stocks during each month of a presidential election year going back to 1928.
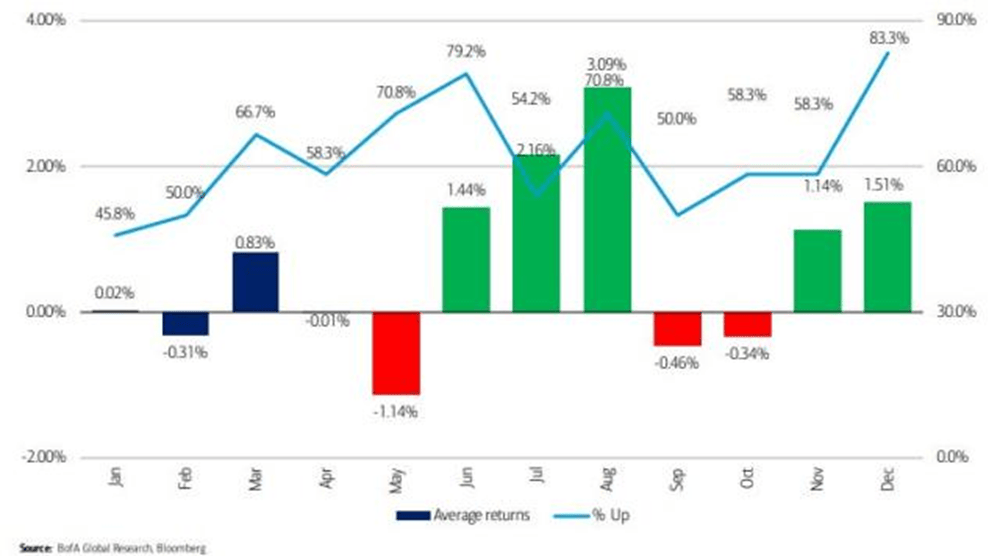
So, it seems that summertime is the best time to be invested in the stock market during a presidential election year. However, we are currently at or near all-time highs in most stock indices and appear to be ripe for a pullback in stock prices. It will be interesting to see if this historical trend can hold up with such a positive return in stocks preceding it over the last eighteen months.
Please comment or send an email if you have any questions.
Joe Baker, CFP®
Baker Asset Management, LLC
joebaker@bakerassemanagement.com

