
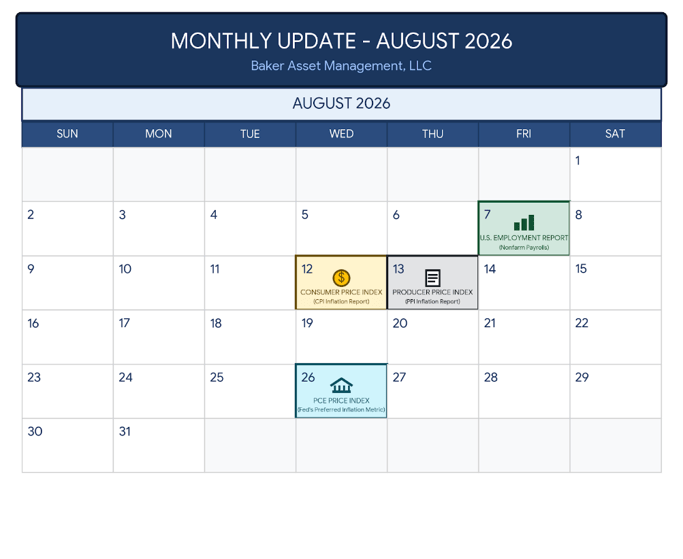
Calendar Notes
- August has no Federal holidays. Markets will remain open standard hours throughout the month.
Stocks spent July navigating the crosscurrents of strong artificial intelligence momentum and a “higher-for-longer” interest rate environment anchored by the Federal Reserve. With structural inflation pressures persisting due to geopolitical conflicts in the Middle East and the ongoing restriction of maritime transit through the Strait of Hormuz, macroeconomic headwinds continue to cap runaway market gains.
For the month of July, the S&P 500 finished down just a bit, -0.09%, falling well short of its historical 30-year June average of +1.40%. Year-to-date, the index is now up 9.38%. Tech sector leaders continue to act as the primary engine for market performance, supported by robust corporate earnings, while broader market participation adjusts to delayed rate cut expectations following Fed Chairman Kevin Warsh’s hawkish stance.
On the corporate front, bottom lines are beginning to absorb the positive liquidity windfall from the tariff refund process for U.S. companies, helping offset higher input costs due to renewed tariffs and the ongoing closing of the Strait of Hormuz. While tech sector valuations reflect enthusiastic market sentiment, today’s AI leaders present a starkly different fundamental profile than past speculative rallies. Rather than relying on debt-fueled projections, today’s mega-cap tech companies are funding massive infrastructure deployments directly out of record free cash flows and fortress balance sheets.
Historically, August typically presents a more challenging environment for equities. Over the past three decades, August has been one of the weakest months for the S&P 500 index, with an average return of -0.01%, essentially flat. This late-summer stretch often features thinner trading volumes and cautious pre-announcements from companies adjusting their full-year guidance. However, if diplomatic efforts yield a definitive resolution to the Middle East conflict and safely reopen global shipping lanes, the market possesses the underlying fundamental strength to easily defy this seasonal slump.
Take a look at the Outlook section below to see what events could move the markets over the short term.
Bond prices continued to reflect the Federal Reserve’s hawkish stance throughout July as fixed-income markets adjusted to persistent cost-push inflation pressures. Safe-haven U.S. Treasuries saw yields push higher as 2026 rate-cut expectations were erased, while corporate credit held steady on the back of strong balance sheets.
- 10-Year U.S. Treasury Note Yield: Finished July at 4.75% (compared to 4.45% in June).
- 30-Year U.S. Treasury Bond Yield: Closed July at 5.28% (compared to 4.94% in June).
I continue to track the High-Yield Credit Spread (HYCS), which settled July at 2.87%. After hovering near tight historical lows earlier this summer, this narrow spread signals that credit markets continue to price in a near-frictionless macroeconomic environment. Given active Middle East supply chain bottlenecks and domestic import tariff pressures, pricing in absolute perfection demands extreme prudence. I am maintaining a strict stance against taking unnecessary risks in lower-quality “junk” bonds, as current spreads do not offer sufficient compensation for credit risk.
At the July 28–29 meeting, the Federal Open Market Committee voted to keep the benchmark federal funds rate anchored at 3.50%–3.75%. However, Chairman Kevin Warsh delivered a hawkish tone, emphasizing that elevated shipping and energy overhead must not anchor higher long-term inflation expectations. Notably, three committee members dissented in favor of an immediate rate hike, highlighting a growing willingness within the Fed to tighten further if inflation prints accelerate.
The next FOMC meeting is scheduled for September 15–16, 2026. Investors should expect policymakers to reiterate their restrictive stance. Rate cuts remain off the table for the remainder of 2026, and a defensive rate increase remains a distinct possibility if upcoming CPI and PCE reports show sticky inflation.
Savings rates remained elevated throughout July following the Federal Reserve’s decision to keep the benchmark federal funds rate anchored at 3.50%–3.75%. As highlighted in the updated table below, a significant yield gap continues to divide traditional brick-and-mortar institutions from competitive online platforms. Investors who actively manage their liquid cash can secure returns roughly ten times higher than standard retail account averages. Allocating a few minutes to evaluate your cash placement remains one of the simplest ways to optimize short-term returns.
| Account Type | Average Rate (APY) | Highest Rate (APY) |
| Money Market Account | 0.45% | 3.90% |
| High-Yield Savings Account | 0.62% | 4.15% |
| 1-Year CD | 2.01% | 4.11% |
| 3-Year CD | 1.67% | 4.15% |
| 5-Year CD | 1.73% | 4.20% |
Total capital parked on the sidelines in U.S. money market funds remains near historic highs, holding firm in the $7.86 trillion range. This substantial cash balance is unlikely to shift significantly back into equities or longer-duration bonds until short-term yields experience a meaningful Fed rate cut—a scenario Chairman Warsh has effectively ruled out for the rest of 2026. In the meantime, certificates of deposit (CDs) and liquid High-Yield Savings Accounts (HYSAs) serve as ideal vehicles for short-term liquidity and emergency reserves. As a quick safeguard, please verify that your liquid cash deposits remain below the $250,000 per-person limit per institution to ensure full FDIC coverage.
Mortgage rates trended modestly higher throughout July, mirroring the upward pressure on 10-year Treasury yields amid persistent “higher-for-longer” inflation concerns. While elevated borrowing costs continue to keep the refinancing market subdued and present headwinds for prospective buyers, expanding home inventory levels are providing prospective buyers with more options and slightly improved negotiating leverage compared to last year.
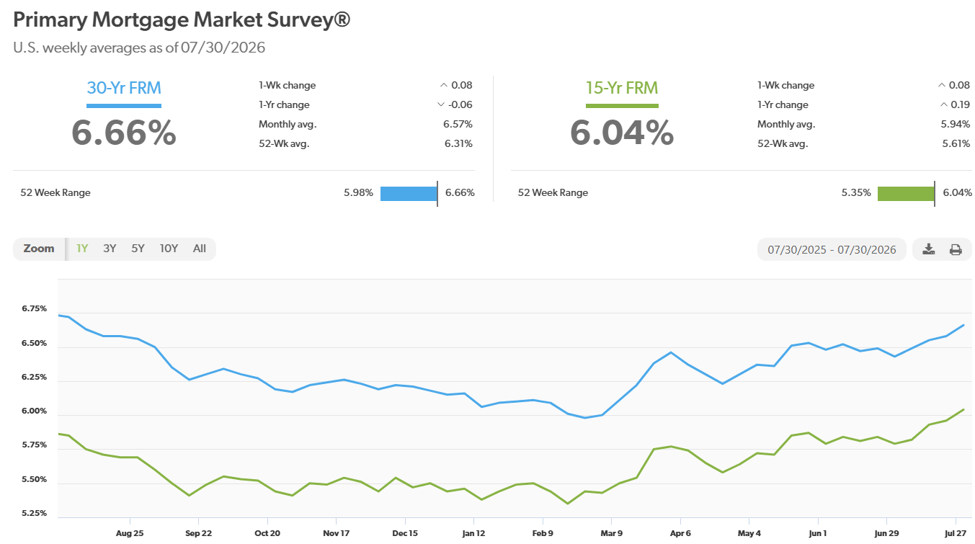
According to Freddie Mac, the 30-year fixed-rate mortgage closed out the final week of July averaging 6.66%, up from the 6.49% average at the end of June. The 15-year fixed-rate mortgage averaged 6.04% over the same period, compared to 5.84% a month ago. Looking into August, residential borrowing costs are projected to fluctuate within the 6.50% to 6.85% range until underlying inflation trends and geopolitical supply bottlenecks show meaningful signs of cooling.
Here is a look at the one-year chart of the 15- and 30-year mortgage rates from Freddie Mac.
Oil prices continued to be heavily influenced by geopolitical developments in the Middle East and ongoing supply bottlenecks throughout July. With commercial maritime transit through the Strait of Hormuz remaining severely restricted and war-risk insurance premiums elevated, a persistent risk premium remains embedded in every barrel.
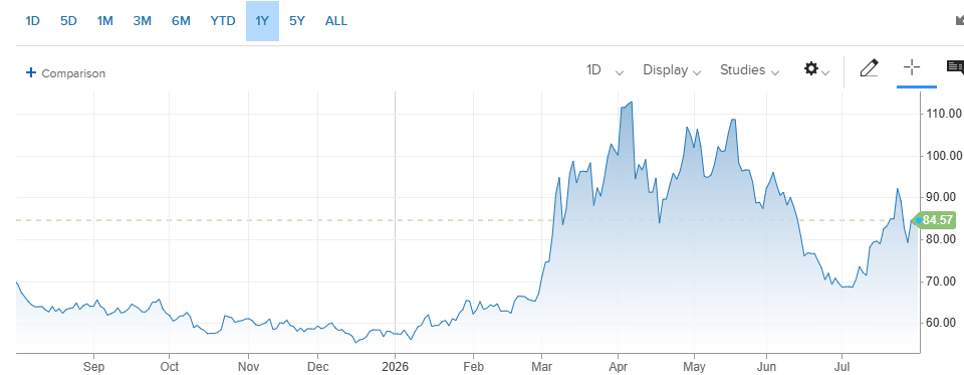
- WTI Crude Settlement: West Texas Intermediate (WTI) crude settled July at $84.57 per barrel (compared to $70.10 at the end of June).
- Year-to-Date Performance: WTI is currently up 23.67% for 2026.
Here’s a look at the one-year chart for U.S. oil:
While short-term technical fluctuations provide temporary volatility, underlying supply constraints continue to feed cost-push inflation across corporate supply chains. Strategic reserves remain low, and until maritime channels safely reopen with guaranteed commercial security, energy overhead will continue to pressure corporate profit margins and complicate the Federal Reserve’s inflation fight.
Retail gasoline prices continued to reflect the broader volatility of crude markets throughout July. While fluctuating international oil benchmarks offered occasional temporary relief at the pump, structural supply pressures stemming from ongoing transit restrictions through the Strait of Hormuz continue to maintain a firm floor under fuel costs. Elevated pump prices remain a direct headwind for consumer budgets and small business logistics overhead heading into the final stretch of the peak summer driving season.
The national average for a gallon of regular unleaded closed out July at $4.11, compared to the $3.85 average seen at the end of June. Indiana currently has the cheapest gasoline in the nation at $3.63 per gallon, while California now has the most expensive at $5.65 per gallon. As a point of comparison, drivers were paying an average of $3.15 per gallon one year ago. Barring a verifiable diplomatic breakthrough to restore secure commercial transit in the Middle East, pump prices are expected to remain range-bound and elevated through late summer.
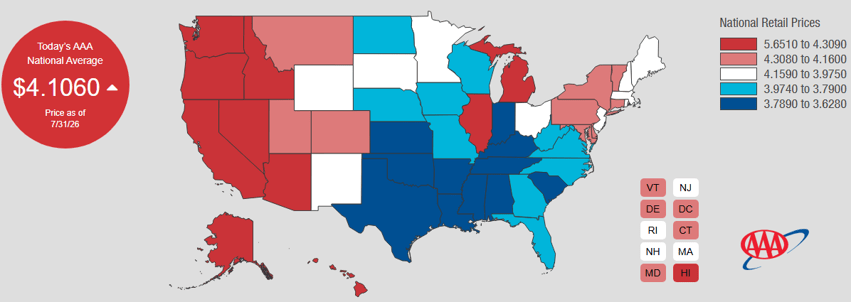
Check out the prices at the pump in your area: AAA Gas Prices.
Outlook
Events on the horizon that could move the markets in the near term:
- Fed, Rates, & Inflation: The Federal Open Market Committee (FOMC) concluded its July meeting on Wednesday by maintaining the target range for the federal funds rate at 3.50% to 3.75%. As a refresher, this is the interest rate range set by the Federal Reserve at which commercial banks borrow and lend their extra money to each other overnight. In its statement, the Fed noted that while economic activity continues to expand at a solid pace, inflation remains elevated relative to its 2% goal, largely driven by energy supply shocks stemming from the conflict in the Middle East. During his press conference, Chairman Kevin Warsh reiterated his firm stance against persistently high inflation. Three FOMC members notably dissented, preferring an immediate rate hike, signaling that a defensive increase later this year remains a distinct possibility if inflation pressures do not subside. In fact, the combination of tariff-driven goods inflation and war-driven energy costs completely eliminates the possibility of 2026 rate cuts. This combo is a headwind for stocks and bonds but can be remedied quickly since they are both self-inflicted.
- Trump Administration Policies: Tariffs are back. In July, the administration implemented sweeping new Section 301 global tariffs of 10% to 12.5% on 60 trading partners, targeted 50% duties on specific Canadian goods, and a 25% levy on select Brazilian imports. The newly implemented tariffs, combined with the volatile Strait of Hormuz shipping disruptions create an inflationary quadruple whammy: both the tariffs and the shipping blockades deal a distinct two-pronged blow—one hitting the supply side (raising costs) and one hitting the demand side (slowing down growth). This severely complicates the Federal Open Market Committee’s (FOMC) ability to steer inflation down to its 2% target. Once again, these will increase costs for our importers and ultimately, lighten the wallets of U.S. consumers through higher prices, i.e., inflation. Not good for the economy or the markets.
- Iran Conflict: Now stretching into its sixth month, the geopolitical crisis in the Middle East remains a central macro headwind capping equity upside. The core economic bottleneck continues to center on the Strait of Hormuz, where restricted maritime transit affects roughly 20% of global petroleum and vital raw materials. Here is a detailed breakdown:
- Logistics & Cost-Push Inflation: Beyond crude oil benchmarks, global shipping routes are absorbing elevated war-risk insurance premiums and costly maritime detours around the Cape of Good Hope. These added transit fees filter directly into intermediate wholesale goods and retail shelf prices, creating persistent cost-push inflation across the real economy.
- Monetary Policy Constraints: This geopolitical energy shock directly restricts the Federal Reserve’s flexibility. Because monetary policy cannot physically clear maritime chokepoints, Chairman Warsh and the FOMC are forced to keep interest rates elevated to suppress demand, eliminating near-term rate cuts and maintaining defensive rate hike risks.
- The Asymmetric Upside: Despite these persistent drag factors, underlying corporate earnings and AI-driven growth have kept markets resilient. Because this supply constraint is geopolitical rather than structural, a resolution presents a powerful positive trigger. A verified diplomatic breakthrough or safe restoration of commercial shipping lanes would immediately dismantle the geopolitical risk premium, slashing transport and energy overhead while providing a massive tailwind for global equities.
In the near term, expect stock prices to remain largely range-bound with elevated, headline-sensitive volatility as markets continue to balance solid corporate fundamentals against persistent geopolitical drag.
Please comment or send an email if you have any questions.
Joe Baker, CFP®
Baker Asset Management, LLC
joebaker@bakerassetmanagement.com

