
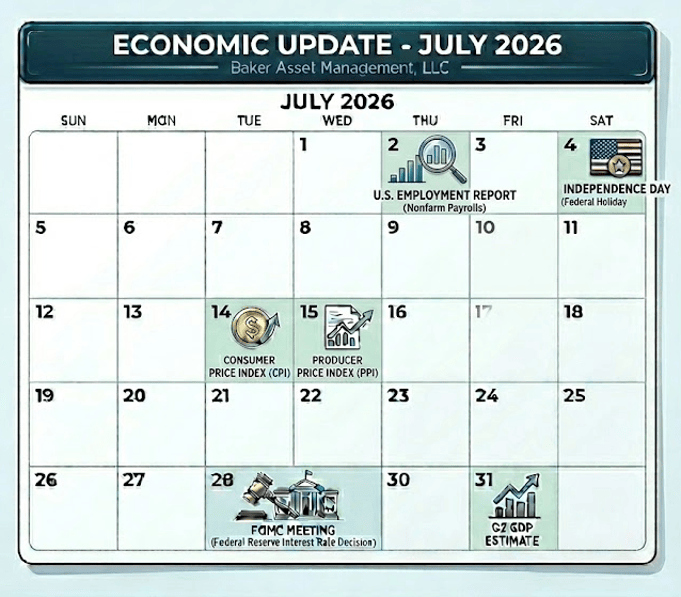
Calendar Notes
- July 3rd, Friday – Independence Day observed. Stock market is closed.
Stocks experienced a volatile tug-of-war throughout June as unstoppable AI momentum squared off against a hawkish Federal Reserve. While corporate earnings and massive capital deployments into tech infrastructure continue to provide a solid floor for equities, macroeconomic headwinds kept a tight lid on runaway gains. Investors spent most of the month parsing every headline coming out of the Middle East peace talks and digesting the policy tone from our first FOMC meeting under new Fed Chairman Kevin Warsh.
For the month of June, the S&P 500 finished down 1.10%, a performance that fell short of its historical 30-year June average of +0.70%. Year-to-date, the index is now up 9.50%. This resilience remains highly impressive given the structural inflation pressures the economy is navigating as well as weathering the geopolitical fallout from the war with Iran. Tech leaders continue to drive the train, but we are starting to see minor cracks in broader market participation as the realization sets in that interest rates are going to remain “higher-for-longer” due to persistent inflation, mainly due to tariffs and the ongoing closure of the Strait of Hormuz.
The biggest news of the month was the June FOMC meeting. As expected, Chairman Warsh kept interest rates unchanged, but his post-meeting commentary leaned hawkish. He made it clear that until the geopolitical chaos subsides and supply chains normalize, the Fed’s primary mandate is to suppress the accelerating inflation caused by spiked shipping and energy costs. The market is completely erasing any remaining hopes for a rate cut in 2026, and a defensive rate hike later this year remains a distinct possibility if oil spikes again.
On the policy front, corporate earnings are starting to absorb the positive windfall from the tariff refund process for U.S. companies. Major logistics providers returning passed-through costs to small businesses has added clean liquidity to corporate balance sheets, which helped offset some of the anxiety surrounding the administration’s strict USCIS green card mandate. While the tech sector still feels a bit like 1999 with its rampant FOMO, the underlying corporate revenues are vastly superior today. I am keeping a close eye on historical valuations, but the AI structural thesis remains the core driver of stock market gains for the foreseeable future.
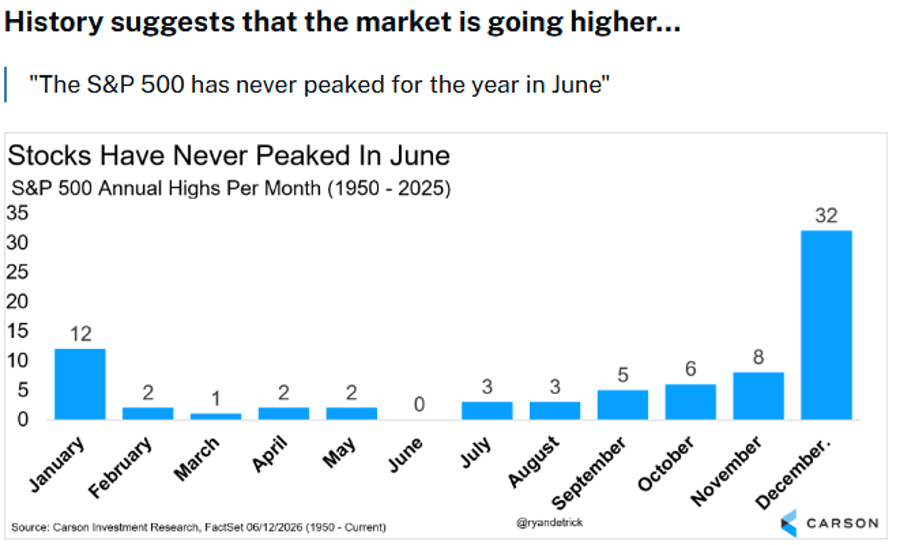
Historically, the performance of the S&P 500 index in July has been one of the strongest seasonal windows of the year. Over the last thirty years, it has delivered an average monthly return of approximately +1.40%. Once again, if we can find a definitive exit from this war and get the shipping lanes safely reopened, stocks should have a fantastic tailwind to beat that historical average. Finally, here’s an interesting historical tidbit that looks promising for more stock gains this year:
Take a look at the Outlook section below to see what events could move the markets over the short term.
Bond prices spent most of June adjusting to the reality of a hawkish Federal Reserve. Following the June FOMC meeting, where new Fed Chairman Kevin Warsh signaled a “higher-for-longer” interest rate environment to combat war-driven inflation, bond yields experienced renewed upward pressure. The divergence between sectors persisted, with safe-haven government bonds feeling the brunt of the Fed’s tone, while corporate credit held relatively steady on the back of stable corporate balance sheets.
The 10-year US Treasury note yield finished the month of June at 4.45%, about the same as the 4.44% yield we tracked at the end of May. Meanwhile, the 30-year Treasury bond yield closed out June at 4.94%, again, about the same as May’s close of 4.97%.
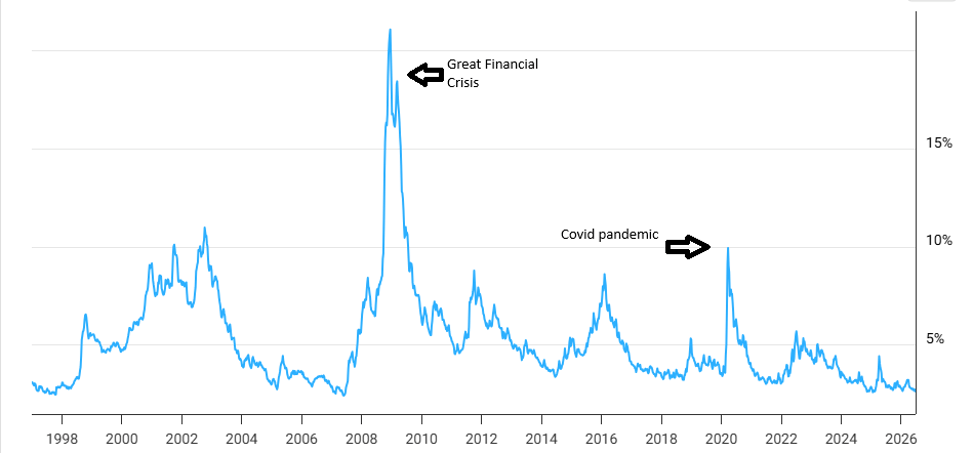
I continue to monitor the high-yield credit spread (HYCS), which finished June at 2.78%. After compressing to an ultra-tight 2.71% in May—a level completely unseen since 2007 right before the Great Financial Crisis—the metric continues to flash a massive warning sign for long-term asset valuations. Although the spread widened slightly this month, the broader message remains unchanged: the credit market is still pricing in near perfection. In a world with an active conflict in the Middle East and structural inflation, pricing in absolute perfection demands extreme caution. I would avoid taking unnecessary risks in the high-yield “junk” bond space right now. For reference, here is HYCS chart since 1997:
With the first FOMC meeting under Chairman Warsh now behind us, the path forward for fixed income is clear. Rate cuts are off the table for the foreseeable future, and short-term yields will remain highly attractive. I continue to favor high-quality bonds and CDs with short-term maturities up to two years. This can lock in yields in the 4% range without being exposed to the heavy price volatility affecting longer-term bonds—provided they are held until maturity.
Savings rates remained highly attractive throughout June, driven entirely by the Federal Reserve’s confirmed stance to hold the federal funds rate steady at 3.50%–3.75%. As you can see from the updated table below, the massive disparity between traditional brick-and-mortar institutions and specialized online platforms persists. Savers who take a few minutes to optimize their cash placement are earning roughly 10 times more yield than those leaving cash in standard retail accounts. Make the time to do the research so you can find the best rates.
| Account Type | Average Rate (APY) | Highest Rate (APY) |
| Money Market Account | 0.45% | 3.90% |
| High-Yield Savings Account | 0.38% | 4.21% |
| 1-Year CD | 1.98% | 4.11% |
| 3-Year CD | 1.66% | 4.25% |
| 5-Year CD | 1.71% | 4.20% |
Total assets sitting on the sidelines in U.S. money market funds continue to hover near historic highs, holding strong in the $7.90 trillion range. This massive cash hoard is unlikely to rotate back into equities or longer-duration bonds until short-term yields face down a meaningful Fed cut, which Chairman Warsh has effectively ruled out for the remainder of 2026. For now, CDs and liquid High-Yield Savings Accounts (HYSAs) remain excellent tools for emergency reserves and short-term cash needs. As a reminder, ensure all liquid cash holdings remain under the $250,000 per-person threshold at any single banking institution to remain fully covered by FDIC insurance.
Mortgage rates hovered tightly within the mid-6% range throughout June, tracking the broader stability of the 10-year U.S. Treasury note. While the slight relief from the 7% highs of previous cycles is welcome, the persistent “higher-for-longer” macroeconomic environment continues to suppress the home refinancing market and challenge first-time buyers. A silver lining remains with an expanding inventory of new construction homes, which is gradually giving active buyers slightly more negotiating leverage than they held last year.
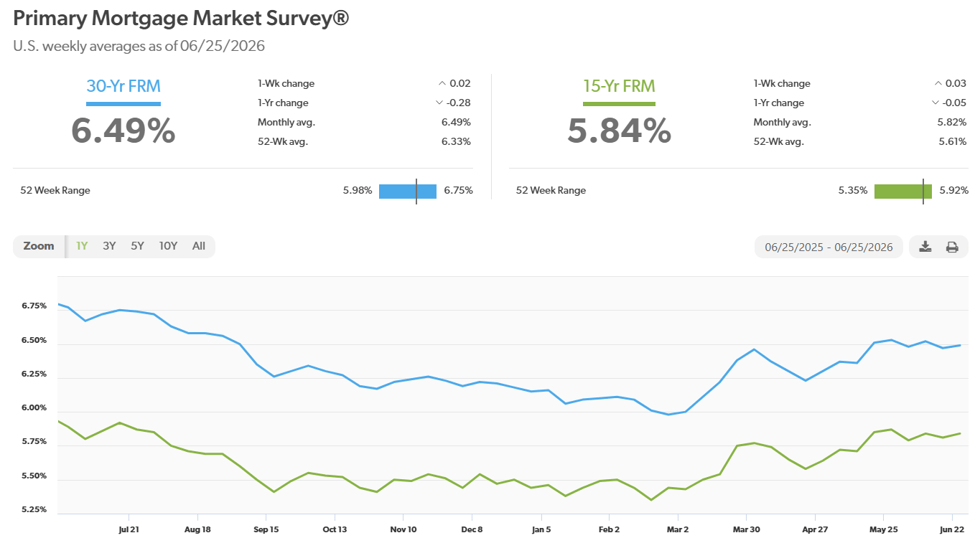
According to Freddie Mac, the 30-year fixed-rate mortgage closed out the final full week of June averaging 6.49%, a minor dip from the 6.53% seen at the end of May. The 15-year fixed-rate mortgage averaged 5.84% over the same period. Looking forward to July, expect residential borrowing costs to remain locked between 6.25% and 6.75% until a structural resolution to the Middle East supply chain crisis begins to cool underlying inflation data.
Here is a look at the one-year chart of the 15- and 30-year mortgage rates from Freddie Mac.
Oil prices continued to be heavily influenced by geopolitical developments in the Middle East throughout June. While the market experienced brief periods of optimism surrounding localized cease-fire discussions, the underlying reality remains a heavily choked supply chain. Global energy infrastructure repairs remain stalled due to active conflict risks, and the fear of ship owners transiting the Strait of Hormuz keeps a heavy risk premium embedded in every barrel.
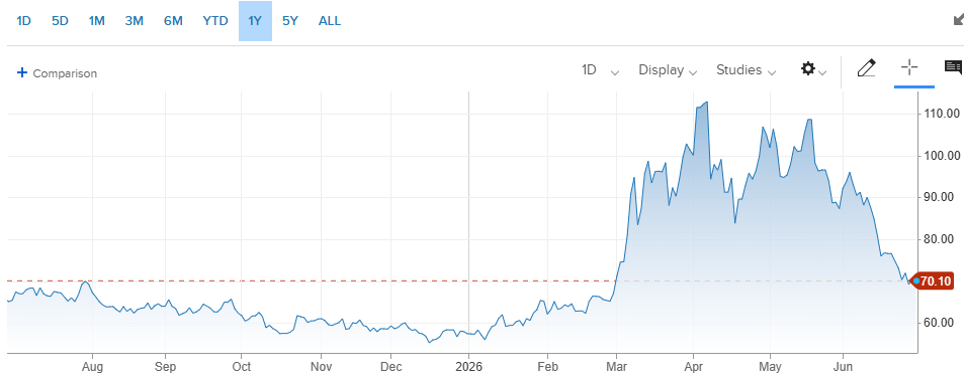
For the month of June, West Texas Intermediate (WTI) crude settled at $70.10 per barrel, down significantly from the $87.36 price at the end of May. For the year, it is still up $13 a barrel, or just over 22%. While global strategic reserves remain low, this near-term technical drop offers breathing room. However, until shipping channels safely reopen and long-term production restarts without fear of military intervention, underlying energy volatility will continue to affect corporate profit margins.
Here’s a look at the one-year chart for U.S. oil:
Drivers found welcome relief at the pump in June as retail gasoline prices experienced a significant drop, mostly due to geopolitical tensions easing in the Middle East. This sharp decline mirrors the recent cooling in international crude costs and provides a much-needed break for consumer wallets and small business logistics overhead. While structural pressures from the ongoing closure of the Strait of Hormuz still linger in the background, this notable pullback provides a great cushion as we enter the peak summer driving season.
The national average for a gallon of regular unleaded closed out June at $3.85, compared to the $4.39 average at May’s conclusion, a welcomed drop. Indiana has the cheapest gas currently, checking in at $3.18 a gallon. Hawaii has the most expensive gasoline at $5.47 per gallon. FYI, a year ago, we were paying $3.19. Barring a swift breakthrough in Middle East international relations to normalize global crude delivery, pump prices are expected to remain elevated throughout the peak summer driving season.
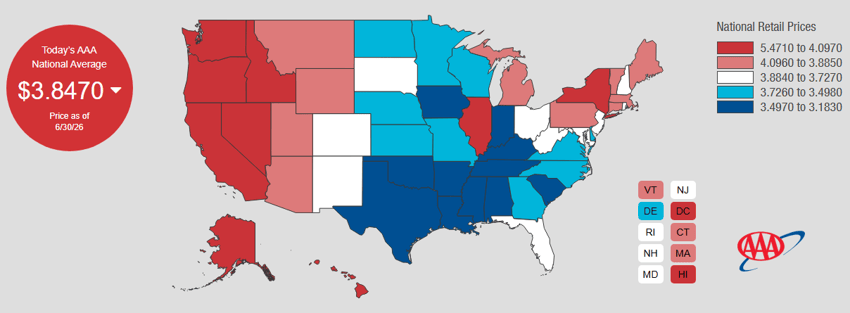
Check out the prices at the pump in your area: AAA Gas Prices.
Outlook
Events on the horizon that could move the markets in the near term:
- Fed, Rates, & Inflation: The battle between a resilient economy and sticky inflation will take center stage in July. We will get critical snapshots of economic health this Thursday with the U.S. Employment Report and July 30th with the first Q2 GDP estimate. These reports will reveal if corporate America is successfully weathering restrictive monetary policy or if economic growth is beginning to cool.
More importantly, the mid-July CPI and PPI reports will show whether supply chain choke points are continuing to accelerate consumer and raw material costs. With any remaining hopes for a 2026 rate cut completely erased, the market is bracing for a “higher-for-longer” environment. All eyes will be on New Fed Chairman Kevin Warsh during the next FOMC meeting at the end of July. While rates are expected to hold steady, Wall Street will parse every word of his press conference to gauge just how close the committee is to pulling the trigger on a defensive rate hike if inflation prints remain hot.
- Trump Administration Policies: On the domestic policy front, we are monitoring two separate issues impacting corporate balance sheets and labor markets. First is the ongoing tariff refund process for roughly 330,000 U.S. companies reclaiming illegal duties. We are starting to see major logistics providers pass these refunds down to small businesses, injecting clean liquidity back onto corporate balance sheets and helping to buffer profit margins against higher energy overhead. Second, the corporate world remains highly anxious over the strict USCIS mandate forcing foreign workers to leave the U.S. to process their green cards. District courts have ruled this mandate illegal but is being appealed by the Trump administration. If the courts ultimately fail to rule this mandate illegal, companies face the threat of sudden and disruptive employment losses. I am watching the ongoing legal challenges closely, as a negative ruling could create structural headwinds for industries reliant on high-skilled foreign talent.
- Iran Conflict: The war with Iran is entering its fifth month, and its economic ripple effects continue to act as the primary headwind against runaway stock market gains. The structural deficit created by the ongoing restriction of roughly 20% of the world’s oil supply and other raw materials is keeping a stubborn risk premium embedded in energy and shipping costs, filtering directly down to higher prices for consumers.
Despite the near-term drag, the silver lining remains that this economic damage was self-inflicted and is entirely reversible. The moment we see a definitive breakthrough or peace deal that safely reopens the Strait of Hormuz, global supply chains will normalize, and energy-driven inflation should cool rapidly. Resolving this conflict remains the single greatest potential catalyst to remove the market’s defensive posture and provide a fantastic tailwind for stocks to beat their historical averages.
Please comment or send an email if you have any questions.
Joe Baker, CFP®
Baker Asset Management, LLC
joebaker@bakerassetmanagement.com

