Monthly Update – June 2026

Calendar Notes

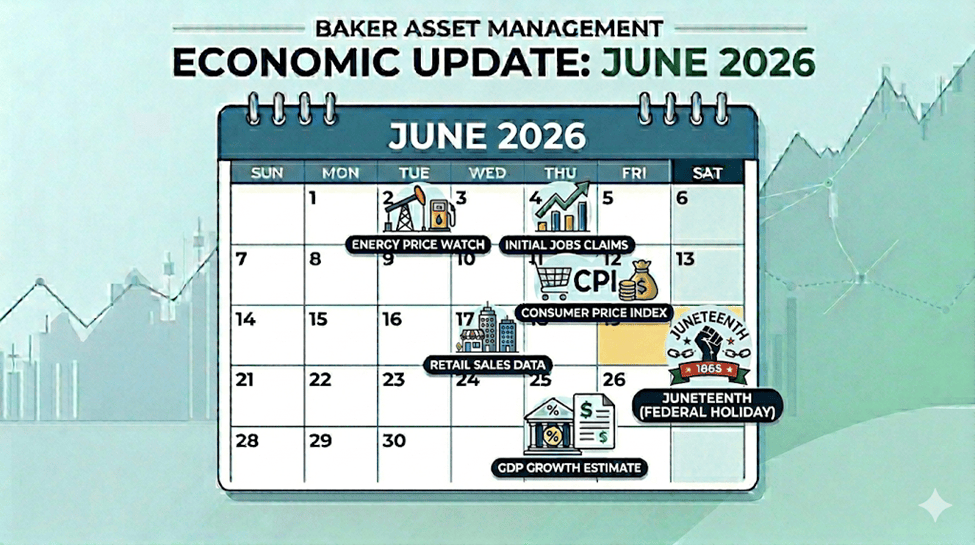
  • June 19th, Friday – Juneteenth National Independence Day. Stock market is closed.

Stocks continued to defy gravity as more and more investors hopped on the AI express. Stocks also got a boost from the possibility of a peace deal with Iran or at least an extended cease fire. In the tech space, insane amounts of capital are being deployed by companies, both big and small, into AI adoption, benefiting chip makers and data center infrastructure providers, just to name a few sectors. This is providing a solid floor of support for stocks.

The old Wall Street adage “Sell in May and go away” did not hold true this year. For the month of May, the S&P 500 had one of its best Mays of this century, finishing with a gain of 5.15%, well above its historical average over the last thirty years of +1.35%. For the year, the index is now up nearly 11%. Very impressive, considering some of the headwinds that it is facing this year.

Speaking of headwinds, the on again, off again peace deal with Iran has been making waves in the markets but is starting to have less and less of an effect. Supply chains are doing what they can to reroute materials away from the Strait of Hormuz and companies and countries are sourcing goods and materials from other parts of the world. The bad news is that inflation continues to accelerate due to this chaos. This is making the likelihood of a rate cut this year very slim and a rate hike more probable. A rate hike could put the brakes on the amazing run that we are having in the stock market. Let’s hope we get a resolution to the strait closure soon.

Historically, the performance of the S&P 500 index in June has been modest, at best. Over the last thirty years, it has had a return of approximately +0.70%, on average. Once again, if we can get out of this war, we should have no problem beating that number.

Take a look at the Outlook section below to see what events could move the markets over the short term.

Bond prices continued to drop again in May, as higher inflation data pushed yields higher. However, there was some price divergence across different sectors. While safe-haven government bonds faced headwind pressures that drove prices down, corporate and high-yield (“junk”) bonds showed immense resilience, heavily protected by robust corporate earnings and tightening credit spreads.

The 10-year US Treasury note yield finished slightly higher in May, settling at 4.44%, above the 4.38% yield that it was at the beginning of the month. The 30-year bond yield closed out the month at 4.97%, the same as a month ago.

Checking the current high yield credit spread (HYCS) of 2.71%, it has compressed further from a month ago and continues its downward trend that started back in May 2025. In fact, this current drop to the 2.7% level has not been seen since 2007, about a year before the Great Financial Crisis. Here’s what this means for the markets: In the short term, this is a very good sign for the current momentum of the economy, but it serves as a warning sign for future bond returns and long-term stock valuations. When high-yield spreads compress to ultra-tight levels like 2.7%, it means the market is pricing in near-perfection: robust corporate health, low default expectations, and smooth economic growth. Caution is most certainly warranted at this time, particularly in the high yield bond space.

Bond investors will be waiting anxiously for the next FOMC meeting with a new Fed chairman, scheduled for June 17th. Expectations are changing daily so get ready for a very interesting meeting this month.

I continue to like bonds with maturities up to two years, but you should plan on holding them until they mature.

Savings rates headed higher this past month as talk of rate cuts by the Fed faded away due to inflation continuing to stay elevated. As you can see from the table below, there is still a huge disparity between the rates offered by traditional banks and those offered by online-only banks. You can earn roughly 10 times more yield by utilizing top-tier online platforms. It is so worth taking some time to research where you can find the best rates.

I am grateful that rates are remaining this high, considering there is so much demand: total assets in U.S. money market funds are sitting near all-time highs, hovering around $7.64 trillion, up 11% year-over-year. When will this trend reverse and see some of this cash rotate into the stock or bond markets? Probably not until rates for MMA, HYSA, and short-term CDs drop below 3.5%. This is another reason why the next FOMC meeting will be watched intently.

Account TypeAverage Rate (APY)Highest Rate (APY)
Money Market Account0.45%4.22%
High-Yield Savings Account0.38%4.21%
1-Year CD2.30%4.11%
3-Year CD2.07%4.04%
5-Year CD2.09%4.30%

For now, CDs and MMAs are still a great place to put your cash and your emergency funds. Knowing this, it makes sense in most situations to put cash that you don’t immediately need into CDs with up to 2-year maturities. For emergency cash, stick to high yielding money market and savings accounts, of which the best are yielding about 4.2%. As always, keep the total under $250,000 per person at any one bank to ensure you are fully covered by the FDIC.

Mortgage rates continued their slow but steady rise since the start of the Iran war in the beginning of March. This has hurt the refi market as well as deterring first-time home buyers. The good news is that new home inventory is increasing enough to offset the lack of existing home inventory. This is giving buyers a little more leverage than they had a year ago.

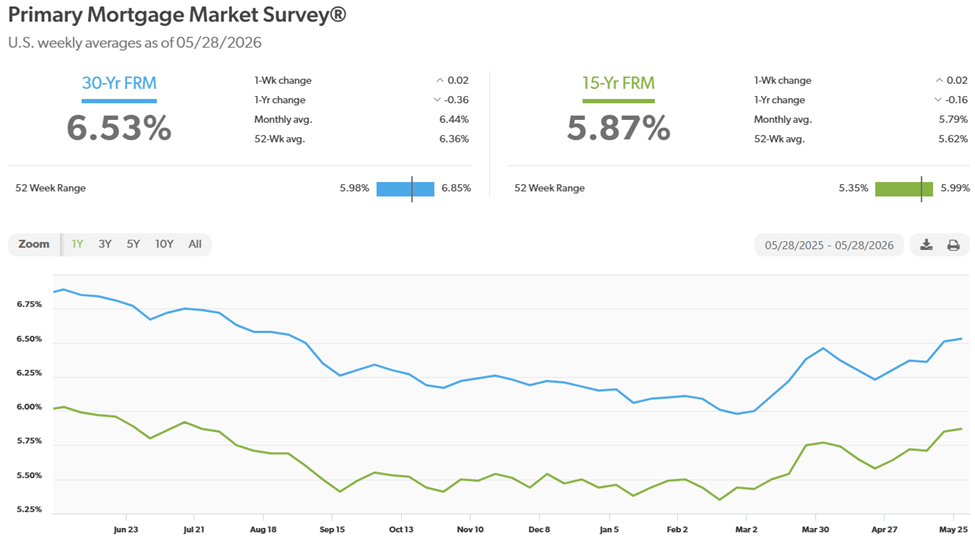
The 30-year fixed rate finished the month at 6.53%, up 23 bps from last month. Looking ahead, rates will most likely remain below the 7% level and track the 10-year bond rate until inflation subsides, which could be a while with no resolution in the Middle East as of yet.

Here is a look at the one-year chart of the 15- and 30-year mortgage rates from Freddie Mac.
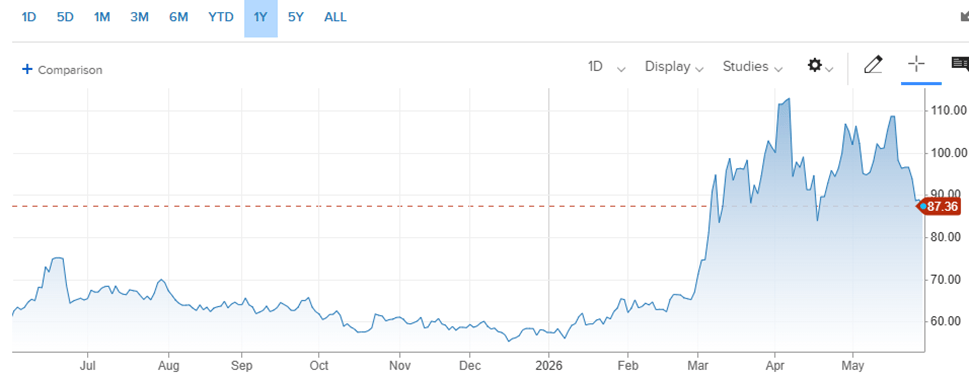
Oil prices had a wild ride once again in May, swinging up and down for the third month in a row as talks of a peace deal between Iran dn the U.S. rise and fall daily. Fortunately, there seems to be enough hope out there for a resolution and that has forced oil prices lower since the beginning of May.

For the month of May, the price for a barrel of West Texas Intermediate (WTI) oil started at $105.93 and ended at $87.36, down about $19 for the month. For the year, it is still up $30 a barrel, or just over 52%.

Oil reserves continue to get tapped by countries worldwide. More measures across the globe to curb demand, such as work-from-home, virtual learning, and cancelling flights are being implemented. However, if oil reserves continue to get depleted across the globe, it will push oil prices even higher than they already are, impacting corporate profits and accelerating inflation significantly.

For now, prices for oil across the world have come down quite a bit this past month, which is great news. As far as getting back to pre-war price levels, that could take quite a while due to the extensive infrastructure damage, the time it takes to restart oil fields that were shut in due to the war, and the lingering risk premium on oil prices for fear that the war will reignite.

Here’s a look at the one-year chart for U.S. oil:
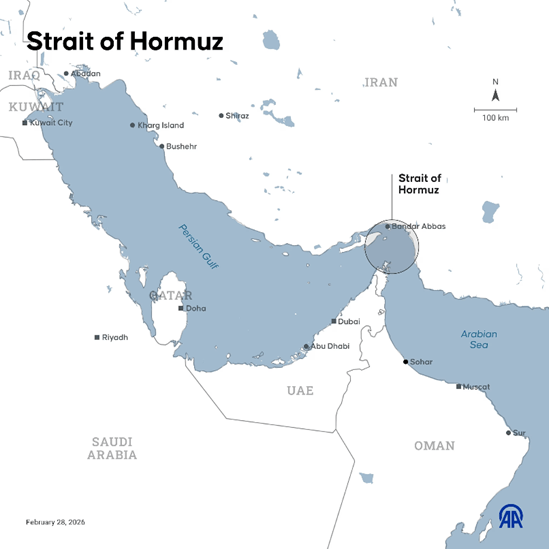
Gasoline prices cruised higher once again this past month, hitting their highest national average since the post-pandemic surge in the summer of 2022. This increase over the last three months has been almost entirely due to the war with Iran, which caused the Strait of Hormuz to essentially close, cutting off about 20% of the world’s oil supply. The national average price hit $4.39 per gallon to end the month. It’s even more devastating in the parts of the world that are more dependent on this supply source. Indiana has the cheapest gas currently, checking in at $3.77 a gallon. California has the most expensive gasoline at $6.06 per gallon. FYI, a year ago, we were paying $3.17.
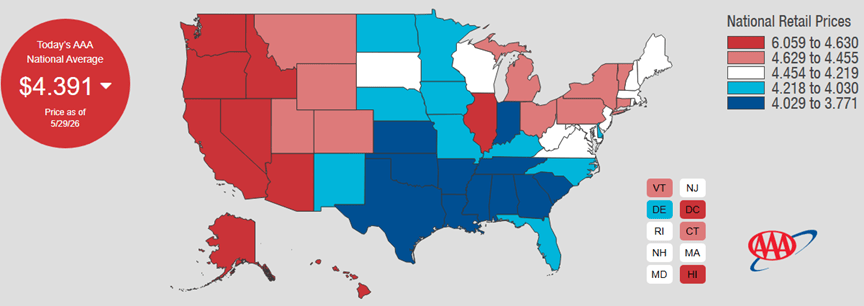
Check out the prices at the pump in your area: AAA Gas Prices.

Outlook

Events on the horizon that could move the markets in the near term:

  • Fed, Rates, & Inflation: The Federal Open Market Committee (FOMC) meets in a few weeks and is widely anticipated since it is the first meeting with the new chairman, Kevin Warsh. That said, it is still likely that the Fed will keep interest rates unchanged. Inflation is still rising due to the closure of the Strait of Hormuz. Barring any breakthroughs in the geopolitical friction in the Middle East, expectations are for a “higher-for-longer” interest rate environment for the remainder of 2026. Plus, with employment numbers steady and consumer spending resilient, the focus will be on getting inflation under control, which means higher interest rates for now.
  • Trump Administration Policies:

Trade – The refund process is in full swing for the roughly 330,000 U.S. companies that had to pay levies that were eventually deemed illegal. This corporate windfall will boost earnings for many companies in 2026. Some have offered to return all of this money to their customers, mostly shippers like FedEx and UPS, since they were the importers (getting the refund) who paid the tariffs for hundreds of thousands of small businesses and passed that cost onto them. This boost to earnings should be already priced into stocks.

Immigration – The administration’s new United States Citizenship and Immigration Services (USCIS) mandate, forcing foreign applicants to leave the U.S. to process green cards, will begin to hit our economy in a big way unless the courts deem this illegal. If they don’t, we could see tens of thousands of people forced to leave the U.S., creating a massive loss of employment. I expect the courts to rule this order illegal because the damage to our country would be unprecedented.

  • Iran Conflict: We have entered our fourth month in this conflict and the damage to the global economy continues to worsen. This war has had a similar effect on our economy as the tariffs have had, both self-inflicted. That means, similar to the tariff chaos, the damage from this war can be somewhat reversed by simply getting out of there. The sooner we do that, the sooner that the Strait can reopen and the flow of oil and other materials can normalize. We have the powerful winds of the AI revolution at our backs and once we stop hurting ourselves and mend our international relationships, we could really see our economy accelerate.

Joe Baker, CFP®

Baker Asset Management, LLC

joebaker@bakerassetmanagement.com
Beyond the Beach: Why “Sell in May and Go Away” Is a Costly Myth

Beyond the Beach: Why “Sell in May and Go Away” Is a Costly Myth

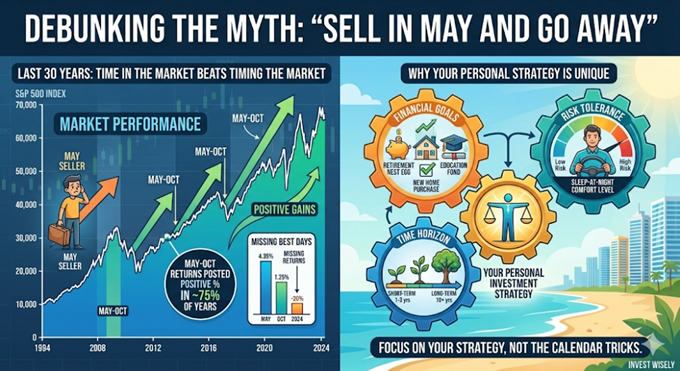
Every spring, Wall Street dusts off one of its oldest and most repeated clichés: “Sell in May and go away.” The theory goes that stock market returns are historically dismal between May and October, so you should cash out, enjoy your summer at the beach, and reinvest in November. It sounds cozy, low-stress, and delightfully simple.

There’s just one glaring problem: Over the last 30 years, following this advice would have cost you a fortune.

Let’s unpack why this old adage has broken down, and why a cookie-cutter calendar trick is no substitute for a personalized investment strategy.

The Reality Check: The Last 30 Years

The idea of the “summer doldrums” used to hold some weight decades ago when trading volume slowed to a crawl during vacation season. But the modern financial world doesn’t take a summer vacation.

If you actually “went away” every May over the last three decades, you would have missed out on massive market gains.

1. Positive Returns Are the Norm, Not the Exception

While it’s true that the winter months (November to April) have historically shown stronger average gains, the May-to-October period has still been overwhelmingly positive. Over the last 30 years, the S&P 500 has posted positive returns during the summer/fall block roughly 70% to 80% of the time. By sitting on the sidelines, you aren’t avoiding a crash; you’re usually just missing a rally.

2. The Cost of Missing the “Best Days”

Market gains are often concentrated in a few explosive days. If you are sitting in cash, missing just a handful of the market’s best days can permanently stunt your portfolio’s compounding growth.

3. Frictional Costs Eat Your Wealth

Every time you sell and buy back in, you trigger a chain reaction of wealth-killers:

  • Taxes: If you operate in a taxable account, selling every May triggers short-term capital gains taxes, which are taxed at a much higher rate than long-term gains.
  • Transaction Costs: Even in an era of zero-commission trades, bid-ask spreads can quietly chip away at your principal.

The Bottom Line: Trying to time the market based on a calendar rhyme is a losing game. As the legendary investor Peter Lynch once said, “Far more money has been lost by investors preparing for corrections, or trying to anticipate corrections, than has been lost in corrections themselves.”

Why “One-Size-Fits-All” Strategies Fail You

The biggest flaw in “Sell in May” isn’t just the math—it’s that it treats every investor like a monolith. Wall Street clichés assume everyone has the exact same bank account, the same nerves, and the same expiration date.

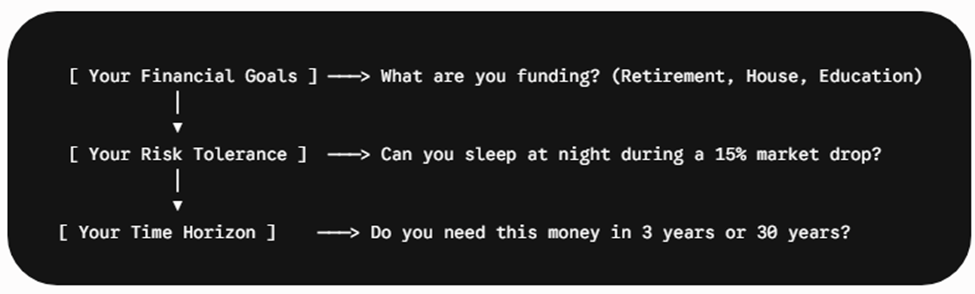
In reality, successful investing requires a strategy tailored uniquely to you across three critical pillars:

1. Your Unique Financial Goals

Are you investing to buy a house in three years, or are you building a nest egg for a retirement that is three decades away? A 25-year-old building long-term wealth shouldn’t care about a minor summer dip. A 63-year-old nearing retirement might need a smoother ride—but they achieve that through a balanced asset allocation (stocks, bonds, cash equivalents), not by completely exiting the stock market every May.

2. Your Personal Risk Tolerance

Risk tolerance isn’t just a math problem; it’s a psychological one. If selling in May makes you feel safe, but causes you to panic-buy back in at higher prices in November, the strategy has failed your psychology. A personalized portfolio is designed to keep you comfortably invested through all seasons, preventing the emotional decisions that derail wealth.

3. Your Time Horizon

Time is the ultimate equalizer in investing. If your time horizon is long, the seasonal squiggles of the stock market become irrelevant background noise. The historical data proves that time in the market beats timing the market every single time.

Focus on Your Blueprint, Not the Calendar

The next time you see a financial news headline warning you to “Sell in May,” turn off the TV and check in on your personal financial plan instead.

Market myths make for great headlines, but personalized strategies build generational wealth. Stick to your goals, respect your time horizon, and leave the calendar tricks behind. Your future self will thank you.

Please comment or send an email if you have any questions.

Joe Baker, CFP®

Baker Asset Management, LLC

joebaker@bakerassetmanagement.com
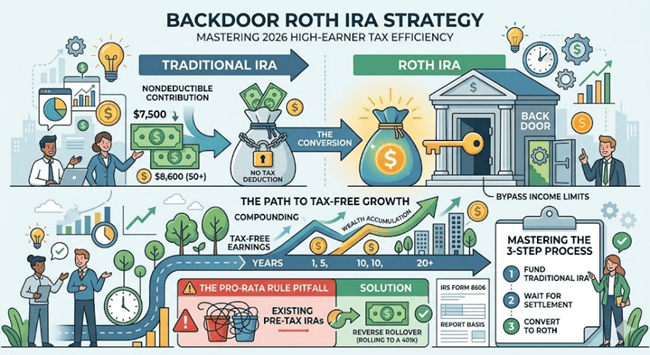
Mastering the Backdoor Roth: A 2026 High-Earner’s Strategy

Building long-term wealth requires more than just picking the right stocks; it requires picking the right tax structures. For high earners, the IRS often closes the front door to tax-free growth. Fortunately, the “backdoor” remains wide open.

Here is the 2026 blueprint for executing a Backdoor Roth conversion with precision.


🚪What is a Backdoor Roth?

A Backdoor Roth isn’t a specific type of account, it’s a strategy.

By law, if your income exceeds certain limits, you are barred from contributing directly to a Roth IRA. However, there are no income limits on contributing to a Traditional IRA or on converting those funds to a Roth. By combining these two steps, you effectively “bypass” the income cap, allowing your money to grow tax-free for decades.

📈Why It Matters in 2026

Tax-advantaged space is a finite resource. In 2026, the contribution limits and income thresholds have shifted, making this strategy more valuable than ever:

  • 2026 Contribution Limit: $7,500 (or $8,600 if you are age 50 or older).
  • The “Front Door” Income Caps: In 2026, the ability to contribute directly to a Roth begins to phase out if your Modified Adjusted Gross Income (MAGI) exceeds:
    • $153,000 (Single)
    • $242,000 (Married Filing Jointly)

⏳When is the “Best Age” to Start?

The short answer: The best age to start is the very first year your income exceeds the direct contribution limits.

Because Roth IRAs grow tax-free, time is your greatest ally. The earlier you start, the more “tax-free compounding” cycles your money undergoes.

  • Early Career (20s-30s): If you are a high-earning young professional, starting now can result in hundreds of thousands of dollars in tax savings by retirement.
  • The “Sweet Spot” (50+): At age 50, the IRS allows “catch-up” contributions (bringing your 2026 total to $8,600). If you haven’t started yet, this is the time to maximize your contributions while you are likely in your peak earning years.
  • The 5-Year Rule: Remember that every conversion starts its own 5-year clock before earnings can be withdrawn tax-free. Starting earlier ensures you clear these hurdles well before you actually need the cash.

🛠️How to Execute (The 3-Step Process)

  1. Fund a Traditional IRA: Open a Traditional IRA and make a nondeductible contribution. This means you don’t take a tax deduction for the contribution (since you’ve already paid tax on that income).
  2. The “Waiting Period”: While not strictly a legal requirement, I typically recommend waiting until the funds fully clear—usually a few business days—before moving to the next step.
  3. The Conversion: Instruct your custodian to move the funds from the Traditional IRA into your Roth IRA.

Expert Tip: Convert the funds as soon as they settle. If the money sits in the Traditional IRA and earns even a few dollars in interest, those earnings will be taxable upon conversion. We want the “basis” and the “conversion amount” to be as identical as possible.

⚠️The “Pro-Rata” Rule: The Biggest Pitfall

This is where most high earners get caught. The IRS views all of your Traditional, SEP, and SIMPLE IRAs as one giant bucket.

If you have $92,500 in an old Rollover IRA (pre-tax) and you add a $7,500 non-deductible contribution (after-tax), the IRS sees a $100,000 total balance. If you try to convert just that $7,500, they will claim only 7.5% of it is tax-free. You would owe income tax on the other 92.5%.

The Solution: Before executing a backdoor conversion, we must look for a “Reverse Rollover”, moving those pre-tax IRA balances into your current employer’s 401(k). 401(k) balances are excluded from this calculation.

📝Reporting to the IRS

Precision in paperwork is mandatory. You must file IRS Form 8606 with your tax return. This form tracks your “basis” (the after-tax money) so the IRS knows you’ve already paid taxes on that contribution and shouldn’t be taxed again during the conversion.


Summary Checklist

  • Verify your 2026 MAGI exceeds the direct Roth limits.
  • Confirm you have zero existing pre-tax IRA balances (check old SEP/SIMPLE/Rollover accounts).
  • Contribute up to $7,500 (or $8,600) to a non-deductible Traditional IRA.
  • Convert to Roth once funds settle.
  • Ensure your tax preparer files Form 8606.

At the end of the day, the Backdoor Roth is about more than just a single year’s contribution; it’s about the compounding power of tax-free growth over the course of your career. While the process is straightforward, the “Pro-Rata” rule and filing requirements leave zero room for error. If you’re ready to secure this tax-advantaged space for 2026 but aren’t sure how your existing IRA balances might impact the strategy, make sure you talk to a tax professional before you move forward.

Please comment or send an email if you have any questions.

Joe Baker, CFP®

Baker Asset Management, LLC

joebaker@bakerassetmanagement.com
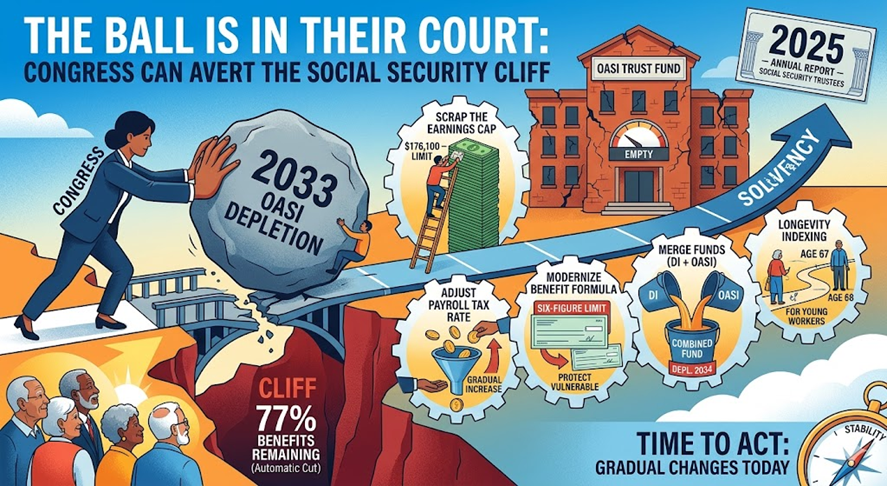
The Ball is in Their Court: How Congress Can Avert the Social Security Cliff

Social Security isn’t failing because of a lack of math; it’s stalling because of a lack of movement in Washington. While the program’s trust funds are undeniably shrinking, this is a crisis of legislative willpower rather than a lack of solutions. The 2025 Trustees Report makes it clear that the “safety net” is held up by a fraying rope, but Congress still holds the scissors—and the spool of thread. To save the program, lawmakers must stop treating Social Security as a political “third rail” and start treating it as a standard legislative repair project.

The Current Trajectory (2025 Trustees Report)

According to the Social Security Board of Trustees’ 2025 Annual Report, the timeline for action has narrowed. The report underscores that without intervention from the Capitol, the following milestones are inevitable:

  • The 2033 Deadline: The Old-Age and Survivors Insurance (OASI) Trust Fund—the primary source for retiree benefits—is projected to be depleted in 2033.
  • The Enforced Benefit Cut: Under current law, once reserves are gone, the Social Security Administration cannot pay full benefits. By 2033, incoming tax revenue would only cover 77% of scheduled payments, resulting in an immediate 23% cut for all beneficiaries unless Congress changes the law.
  • Growing Deficit: The 75-year actuarial deficit has risen to 3.82% of taxable payroll, meaning the gap Congress needs to bridge is larger than it was just one year ago.

The Congressional “Fix-It” List

Congress has several specific levers they can pull to stabilize the system for the next 75 years without cutting benefits for those who rely on them most. Fixing the program will likely require a “grand bargain” involving these components:

  • Scrapping the Earnings Cap: Currently, Social Security taxes are only collected on income up to $176,100 (for 2025). High earners stop paying into the system once they hit that mark. Congress could eliminate this cap or create a “donut hole” (e.g., taxing income above $250,000) to ensure the wealthiest Americans contribute at the same rate as the middle class. I feel this is the best way to fix the problem and can be implemented quickly.
  • Gradual Payroll Tax Adjustments: The 12.4% payroll tax (split between you and your employer) hasn’t moved in decades. A tiny, phased-in increase—such as 0.1% per year—would be barely noticeable on a weekly paycheck but would pour billions back into the trust fund over time.
  • Modernizing the Benefit Formula (The “Six-Figure Limit”): Lawmakers are currently debating a cap on maximum benefits for high-income couples (e.g., a $100,000 limit). By slowing benefit growth for the top 1–5% of earners, Congress can redirect funds to keep the program solvent for everyone else.
  • Longevity Indexing: For younger generations, Congress could index the retirement age to life expectancy. This would mean the age moves by mere months over several decades, reflecting the reality that we are living longer than the workers of 1935.

The math behind Social Security is straightforward; the politics are what’s complicated. We don’t need a miracle to save Social Security; we need a Congress that is willing to trade short-term political points for long-term national stability. By acting now, lawmakers can implement small, gradual changes that protect current retirees and guarantee a future for the next generation. The 2033 “cliff” is seven years away—it’s time for Washington to pick up the tools and get to work.

Please comment or send an email if you have any questions.

Joe Baker, CFP®

Baker Asset Management, LLC

joebaker@bakerassetmanagement.com
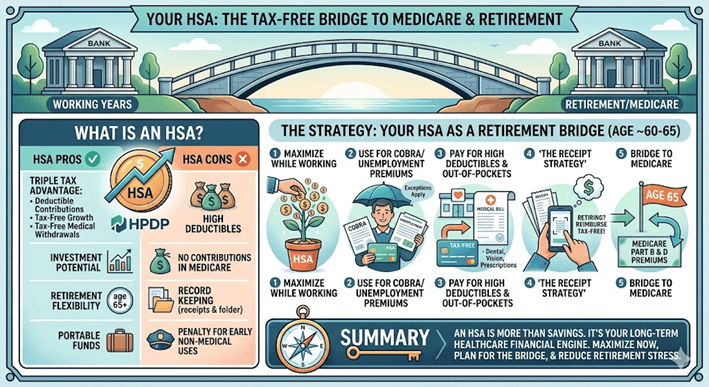
HSA: Your Pre-Medicare Health Bridge

For many Americans, the road to retirement includes a significant “bridge” period: the years between leaving a career and becoming eligible for Medicare at age 65. Navigating this gap can be a financial tightrope, as private health insurance premiums and out-of-pocket medical costs often skyrocket just as a steady paycheck disappears. Fortunately, one of the most powerful tools for crossing this bridge is already in the wallets of millions. A Health Savings Account (HSA) isn’t just a way to pay for today’s bandages and prescriptions; when managed strategically, it acts as a tax-advantaged “health 401(k)” that can fund your healthcare needs during those critical pre-Medicare years.

What is an HSA and an HDHP?

To understand an HSA, you must first understand the insurance plan that allows you to have one.

  • High-Deductible Health Plan (HDHP): For 2026, the IRS defines an HDHP as a plan with a minimum annual deductible of $1,700 for self-only coverage or $3,400 for family coverage. Additionally, the plan’s annual out-of-pocket expenses (including deductibles, copayments, and coinsurance, but not premiums) cannot exceed $8,500 for self-only coverage or $17,000 for family coverage.
  • Health Savings Account (HSA): This is a unique, tax-advantaged savings account available only to those enrolled in an HDHP. Unlike a Flexible Spending Account (FSA), the money in an HSA is yours to keep forever; it doesn’t expire at the end of the year, and it stays with you even if you change jobs or retire.

2026 HSA Contribution Limits

Knowing the limits is crucial for maximizing your “bridge” funding before you leave the workforce.

  • Self-Only Coverage: You can contribute up to $4,400 annually.
  • Family Coverage: You can contribute up to $8,750 annually.
  • Catch-Up Contribution (Age 55+): If you are 55 or older, you can contribute an additional $1,000 on top of the limits listed above, bringing your potential total contribution to $5,400 for an individual or $9,750 for a family in 2026.

Pros and Cons of an HSA

ProsCons
Triple Tax Advantage: Contributions are tax-deductible, growth is tax-free, and withdrawals for medical expenses are tax-free.High Deductibles: You’ll pay significantly more out-of-pocket before insurance coverage begins, which requires disciplined saving.
Investment Potential: Most providers allow you to invest your balance in stocks or mutual funds for long-term, compounded growth.Strict Eligibility: You cannot contribute once you enroll in Medicare or if you have other non-qualified health coverage.
Retirement Flexibility: After age 65, you can withdraw funds for any reason without penalty (though non-medical withdrawals are taxed as income).Record Keeping: You must save receipts to prove to the IRS that your withdrawals were for qualified medical expenses.

The Strategy: Using Your HSA as a Retirement Bridge

The “bridge” period (typically ages 60–65) is where the HSA shines. Because you can no longer contribute to an HSA once you are on Medicare, your goal should be to maximize your balance while working and then deploy it strategically once you retire.

  • Fund Your Premiums During COBRA or Unemployment: Generally, you cannot use an HSA to pay health insurance premiums. However, there are two major exceptions for retirees: COBRA and Unemployment. If you leave your job and use COBRA to keep your insurance, or if you are receiving state or federal unemployment benefits, you can use your HSA tax-free to pay those premiums.
  • Cover Out-of-Pocket Costs: If you transition to an ACA Marketplace plan or a private plan before 65, you will likely face the high deductibles required by those plans. Your HSA can cover 100% of these “qualified medical expenses”—including dental, vision, and prescriptions—with tax-free dollars, preserving your other retirement accounts.
  • The “Receipt Strategy” for Maximum Cash Flow: If you can afford to pay for medical expenses out-of-pocket while working, do it—and save the receipts. There is no time limit on when you must reimburse yourself. You can “bank” those receipts for years and then withdraw the cash from your HSA tax-free during retirement to use for travel or living expenses. 
  • Bridge to Medicare Premiums: Once you hit 65, the bridge is complete, but the utility continues. You can use remaining HSA funds to pay for Medicare Part B and Part D premiums, further reducing your monthly retirement costs.

An HSA is far more than a simple savings account; it is a versatile financial engine that provides a tax-free safety net when you are most vulnerable to rising healthcare costs. By viewing your HSA as a long-term investment rather than a short-term spending account, you can transform the “bridge” to Medicare from a source of stress into a well-funded, strategic transition.

Please comment or send an email if you have any questions.

Joe Baker, CFP®

Baker Asset Management, LLC

joebaker@bakerassetmanagement.com
Monthly Update – May 2026

Calendar Notes

  • May 25th, Monday – Memorial Day. Stock market is closed.

Stocks bounced back aggressively in April as investors jumped on the AI train once again. It was even more impressive that it occurred while our war with Iran continues to keep the Strait of Hormuz closed.

For the month of April, the S&P 500 had its best monthly performance since November of 2020, finishing with a gain of 10.40%, well above its historical average over the last thirty years of +2.40%. To put it simply: the index delivered nearly a full year’s worth of “average” returns in just 30 days. For the year, the index is now up 5.31%. Not bad, considering the circumstances.

Looking ahead, potential catalysts to move stocks this April continue to be Q1 earnings announcements and the hope that the Iran war is coming to an end. Recent economic data shows the job market is still in a low hire, low fire pattern and inflation is still on the rise, mainly due to higher energy prices caused by the war. This data provides little fuel to extend this market rally. However, if we could get out of this war and open the Strait, now that would be the boost the stock market needs to continue higher.

Historically, the performance of the S&P 500 index in May has been impressive. Over the last thirty years, it has had a return of approximately +1.35% return, on average. As I said, if we can get out of this war, we should have no problem beating that number.

Take a look at the Outlook section below to see what events could move the markets over the short term.

Bond prices continued to drop throughout April, as yields rose across most bond categories due to inflation fears caused mainly by the ongoing shutdown of the Strait of Hormuz. In fact, economic data just released showed that the PCE (Personal Consumption Expenditures) Price Index hit 3.2%. The PCE Price Index is essentially the “Fed’s Favorite Yardstick” for measuring inflation. While you probably hear about the CPI (Consumer Price Index) more often in the news, the PCE is the metric I watch most closely because it is what the Federal Reserve uses to set interest rate policy. With the PCE at a 3-year high, the Fed will be hard pressed to lower interest rates anytime soon.

The 10-year US Treasury note yield finished higher in April, settling at 4.38%, just above the 4.32% yield that it was at the beginning of the month. The 30-year bond yield closed out the month at 4.97%, 5 basis points higher than a month ago.

Checking the current high yield credit spread (HYCS) of 2.85%, it has dropped about 60 basis points from a month ago and continues to remain well below the long-term average of 5.20%. This suggests that high yield, aka junk bonds, are currently expensive relative to their historical risk-reward profile. I like to monitor this metric because if it gets above 5%, historically this has not been a good sign for the markets.

Bond investors will be waiting anxiously for the next FOMC meeting with a new Fed chairman, scheduled for June 17th. Expectations are changing daily so get ready for a very interesting meeting this June.

I continue to like bonds with maturities up to two years but plan on holding them until they mature.

Savings rates dipped slightly this past month despite the Federal Reserve keeping short-term interest rates unchanged. Regardless, rates are currently still attractive to risk-averse investors, especially if you take time to do some research. Just have a look at the table below to see the massive disparity between the national averages and highest rates available.

I am grateful that rates are remaining this high, considering there is so much demand: total assets in U.S. money market funds are sitting near all-time highs, hovering around $7.64 trillion, up 11% year-over-year. When will this trend reverse and see some of this cash rotate into the stock or bond markets? Probably not until rates for MMA, HYSA, and short-term CDs drop below 3.5%. This is another reason why the next FOMC meeting will be watched intently.

Account TypeAverage Rate (APY)Highest Rate (APY)
Money Market Account0.48%4.22%
High-Yield Savings Account0.59%4.21%
1-Year CD1.93%4.10%
3-Year CD1.65%4.04%
5-Year CD1.70%4.07%

For now, CDs and MMAs are still a great place to put your cash and your emergency funds. Knowing this, it makes sense in most situations to put cash that you don’t immediately need into CDs with up to 2-year maturities. For emergency cash, stick to high yielding money market and savings accounts, of which the best are yielding about 4.2%. As always, keep the total under $250,000 per person at any one bank to ensure you are fully covered by the FDIC.

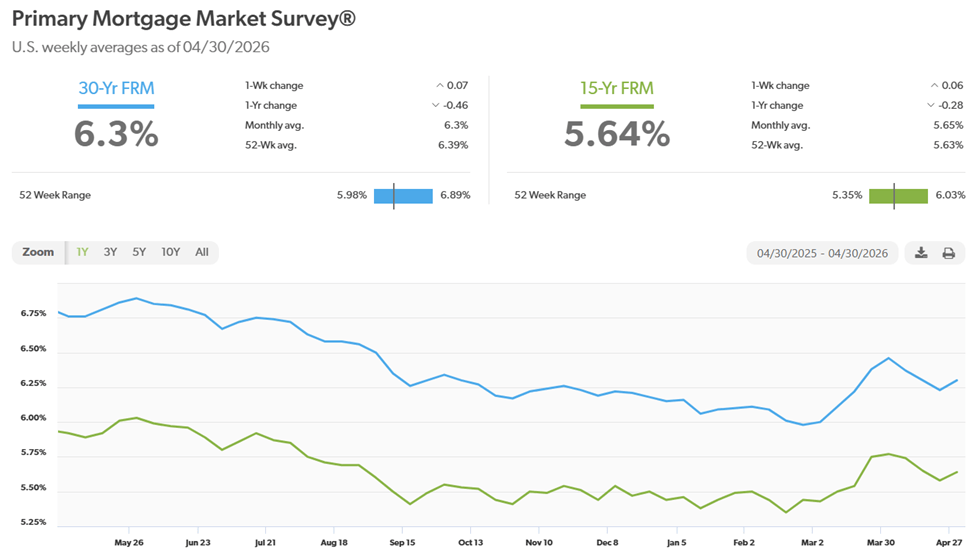
Mortgage rates dropped just a bit this past April, but still holding above the 6% level. This doesn’t help the refi market that much, but it appears to have spurred home builders, at least in the southeast region of the country. After talking to some home builder firms in my area, business seems to have picked up since earlier in the year, which is good news. Lumber prices are low, but prices of most other building materials have risen due to tariffs and the closure of the Strait of Hormuz. Still, any increase in inventory is better than none.

The 30-year fixed rate finished the month at 6.30%, down just 8 bps from last month. Looking ahead, rates will most likely remain in their current range and track the 10-year bond rate until inflation subsides (currently at 3.2%, highest since 2023).

Here is a look at the one-year chart of the 15- and 30-year mortgage rates from Freddie Mac.

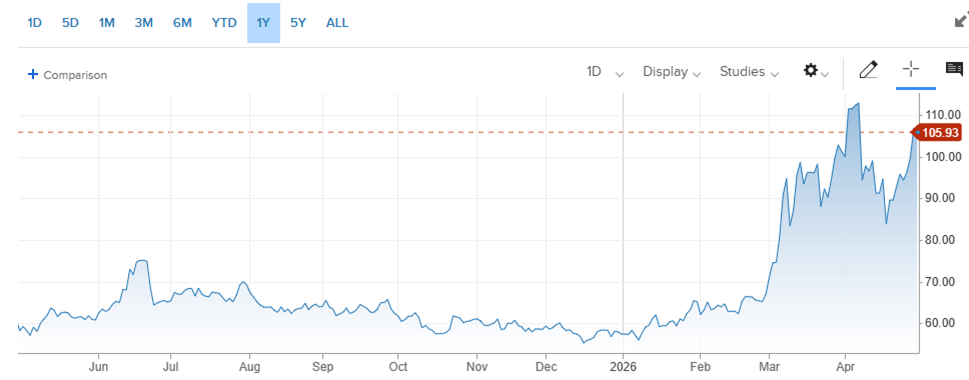
Oil prices had another very volatile month in April, jumping up and down as hopes of the war ending rose and fell almost daily. In the end, unfortunately, prices were higher across the globe with no resolution in sight. Not everyone is hurting: Oil drillers outside of the Middle East are making money hand over fist right now with prices nearly double what they were at the beginning of the year.

For the month of April, the price for a barrel of West Texas Intermediate (WTI) oil started at $101.94 and ended at $105.93, up about $4 for the month. FYI, it peaked at about $113 at the beginning of the month. For the year, it is now up $48.51 a barrel, almost 85%.

As expected, the International Energy Agency (IEA) nations have drained nearly 700 million barrels of oil from reserves to prevent reaching the $120/barrel peak hit in March. By the way, the IEA consists of 31 member countries, primarily advanced, industrialized economies. Key members include the United States, Japan, Germany, France, Canada, and the UK.

The Price Floor: As trade “normalizes,” these governments will become the world’s largest buyers to refill their stocks. This massive state-sponsored demand will act as a “permanent floor” under energy prices, preventing a return to the pre-war $60 level until at least mid-2027.

Looking ahead, if the war ends this May, we could see oil prices below $90 by the end of the year. As far as getting back to pre-war price levels, that could take quite a while due to the extensive infrastructure damage, the time it takes to restart oil fields that were shut in due to the war, and the lingering risk premium on oil prices for fear that the war will reignite.

Here’s a look at the one-year chart for U.S. oil:

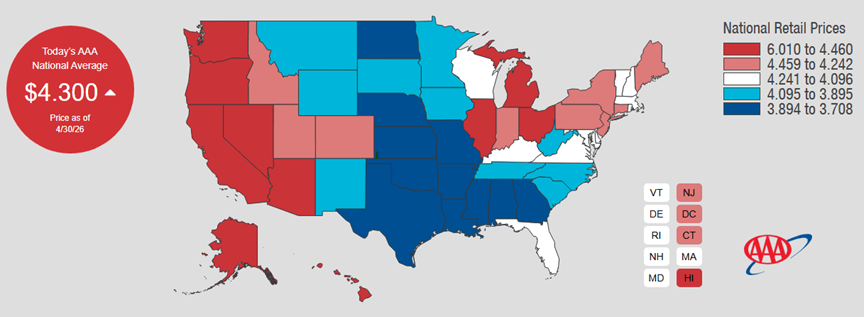
Gasoline prices continued their historic climb, reaching a four-year high, as energy markets continue to suffer due to the current blockade of the Strait of Hormuz. The national average price hit $4.30 per gallon to end the month. Diesel is now at $5.50 per gallon, about $0.30 off of its all-time high reached back in June of 2022. It’s way worse in other parts of the world, particularly Europe and Asia. Oklahoma has the cheapest gas currently, checking in at $3.71 a gallon. California has the most expensive gasoline at $6.01 per gallon. FYI, a year ago, we were paying $3.18.

Check out the prices at the pump in your area: AAA Gas Prices.

Outlook

Events on the horizon that could move the markets in the near term:

  • Fed, Rates, & Inflation: The Federal Open Market Committee (FOMC) met a few days ago and kept bank overnight lending rates unchanged, as expected. Stubborn inflation, aided by the ongoing war with Iran, has kept the FOMC in a steady-as-she-goes path. Another reason for the no change decision includes the low hire, low fire labor market, keeping unemployment in check. Also, wage growth has remained solid, largely due to the immigration restrictions causing labor shortages, providing more justification to keep interest rates elevated.

The next time the FOMC meets, it will be with a new chairman, and that is reason enough for investors to monitor the Fed closely over the next few months.

  • Trump Administration Policies:

Trade – The refund process has begun for importers to reclaim the tariffs that they paid to U.S. Customs that were deemed illegal by SCOTUS. There are approximately 330,000 companies that are due an estimated $166 billion in overpaid duties. Because these funds were collected under an invalidated law, the outstanding balance is accruing roughly $650 million in interest each month ($22 million per day), creating significant pressure on the Treasury to expedite payments. This was an easily avoidable blunder on the part of the Trump administration that really hurt small businesses and lower income people the most. These refunds should show up on companies’ financial statements by the end of the year, hopefully.

Immigration – The administration’s immigration policies have had some positive impacts on the U.S. economy. The biggest has been wage growth. The scarcity of workers has forced employers to raise wages to attract native-born labor. Of course, the downside to higher wages is inflation, as companies pass on these higher input costs to consumers. Also, because the population is no longer growing via immigration, the economy now only needs to add about 20,000 to 50,000 jobs per month to keep the unemployment rate stable, a massive drop from the 100,000+ jobs required during the previous administration. Automation could replace many of these jobs that were vacated by immigrants, which would help keep the unemployment rate stable as well. Finally, the brain drain caused by some of these immigration policies could be remedied with the implementation of AI. A positive for both companies and investors.

  • Iran Conflict: As this war drags on, its effect on the global economy continues to worsen. Even if it ended today, global trade would likely require 12 to 18 months to fully normalize. While the initial “peace dividend” would trigger an immediate rally in financial markets, the physical and structural damage to the global supply chain is far too deep for a quick fix.

Since there was no imminent nuclear threat from Iran, according to our intelligence services, and there certainly isn’t one now after our bombings, we should cut our losses and get the Strait of Hormuz opened back up as quickly as possible to let things get back to normal. The longer this goes on, the longer it’s going to take to normalize global trade, prices, alliances, etc.

Joe Baker, CFP®

Baker Asset Management, LLC

joebaker@bakerassetmanagement.com
The Big Three: Which Market Pulse Actually Matters for Your Portfolio?

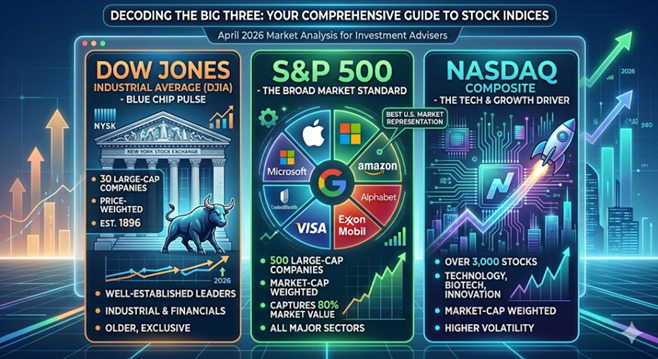
We’ve all seen the tickers scrolling at the bottom of the news screen: the Dow is up 200 points, the NASDAQ is flat, and the S&P 500 is hitting another record high. But for most investors, those numbers are just noise without context. It’s easy to treat “the market” as one giant, monolithic entity, but the truth is that these three indices are built differently, behave differently, and tell very different stories about your money. Today, we’re peeling back the curtain on the “Big Three” to see what’s actually under the hood—and which one you should actually be watching.

1. The Dow Jones Industrial Average (DJIA)

Commonly referred to as “The Dow”, this is the oldest and most “exclusive” of the three.

  • Composition: It consists of just 30 “blue-chip” companies. These are massive, well-established leaders in their respective industries (think Apple, UnitedHealth, and Goldman Sachs). Despite its name, it is no longer just “industrial”; it covers healthcare, tech, and financial services.
  • Calculation: The Dow is price weighted. This means the index is calculated by adding up the share prices of all 30 stocks and dividing by the “Dow Divisor” — a number that adjusts for stock splits and corporate changes.
  • The Quirk: Because it’s price-weighted, a stock with a $500 share price has a much bigger impact on the Dow than a stock with a $50 share price, regardless of the actual size of the company.

2. The S&P 500

The Standard & Poor’s 500 is widely considered the gold standard for institutional investors and professionals.

  • Composition: It tracks 500 of the largest publicly traded companies in the U.S. across 11 major sectors. To be included, companies must meet strict liquidity and profitability requirements.
  • Calculation: It is market-cap weighted (specifically, float-adjusted). The larger the company’s total market value, the more influence it has on the index.
  • The Reality: In 2026, the S&P 500 remains heavily influenced by the “Magnificent Seven” and other mega-cap tech giants, which account for a significant portion of its total movement.

3. The NASDAQ Composite

If the Dow is the “old guard” and the S&P is the “whole market,” the NASDAQ is the “innovator.”

  • Composition: This index includes over 3,000 stocks listed on the Nasdaq exchange. It is heavily concentrated in technology, biotechnology, and growth-oriented sectors. Notably, it excludes financial companies (unlike the S&P 500).
  • Calculation: Like the S&P 500, it is market-cap weighted.
  • The Role: Investors look to the NASDAQ as a barometer for the “risk-on” sentiment. When tech is booming, the NASDAQ leads the way; when interest rates rise and growth slows, it often takes the hardest hit.

Which One Represents the U.S. Market Best?

While the Dow gets the most TV time, the S&P 500 is the most accurate representation of the U.S. stock market.

FeatureDow JonesS&P 500NASDAQ
DiversityLow (30 stocks)High (500 stocks)Specialized (3,000+ stocks)
WeightingStock PriceMarket CapMarket Cap
Industry BiasBalanced/MatureBroad MarketTech / Growth
Who uses it?General PublicFund ManagersTech Investors

Why the S&P wins: The S&P 500 captures approximately 80% of the total available market value in the U.S. Its market-cap weighting ensures that we are looking at the actual economic footprint of these companies rather than just their arbitrary share price.


At the end of the day, these indices are more than just numbers on a screen; they are the tools we use to measure the temperature of the American economy. While the Dow offers a snapshot of blue-chip stability and the NASDAQ captures the high-voltage energy of the tech sector, the S&P 500 remains the most reliable compass for your long-term financial journey. By understanding how these benchmarks are constructed, you can move past the daily headlines and focus on what truly drives wealth: a disciplined, diversified strategy that looks at the big picture rather than just the daily ticker.

Investor Note: Always keep in mind that all three of these indices are comprised of 100% stock. Your portfolio most likely is a mix of stocks, bonds, commodities, and real estate so consider that when comparing your investment accounts to any of these indices.

Please comment or send an email if you have any questions.

Joe Baker, CFP®

Baker Asset Management, LLC

joebaker@bakerassetmanagement.com
Why Global Shocks Hit Your Local Pump: The Strait of Hormuz and Your Wallet

It’s a common question I hear from clients: “If the U.S. is producing record amounts of its own oil, why does a conflict thousands of miles away in the Middle East make it more expensive to fill up my SUV in suburbs?” It feels like a disconnect, but the answer lies in the fact that oil isn’t just a local resource—it’s a global currency. Even if not a single drop of oil from the Strait of Hormuz ever reaches a U.S. refinery, the closure of that vital waterway sends a shockwave through the global market that changes the price of every barrel on earth, including the ones produced right here in the U.S.

Why U.S. Oil Prices Are Rising

West Texas Intermediate (WTI) is the U.S. benchmark for oil. While it is produced domestically, its price is heavily influenced by global supply and demand.

  • Global Competition for Barrels: When 20% of the world’s oil supply is cut off at the Strait of Hormuz, countries that previously relied on Middle Eastern oil (like those in Asia and Europe) must find it elsewhere. They begin bidding on any available barrel, including those produced in the U.S., which drives up the price for everyone.
  • Market Interconnectivity: Traders look for the highest price globally. If global benchmarks like Brent crude spike, U.S. producers will sell to international buyers unless domestic prices rise to match.

Why U.S. Gas Prices Are Increasing

Retail gasoline prices respond to the replacement cost of fuel, not just the current supply.

  • Refining Realities: Although the U.S. produces more oil than it consumes, our refineries are often configured to process heavy crude imported from abroad rather than the “light sweet” crude produced in Texas. Disruptions in global shipping force refiners to pay more for suitable crude, a cost passed to the pump. Why our refineries aren’t configured to process U.S. oil is a whole other discussion.
  • Anticipating Future Costs: Gas station owners set prices based on what it will cost to buy their next shipment. If they see wholesale oil prices skyrocketing due to the Strait’s closure, they raise prices immediately to ensure they have enough cash to restock their tanks at the new, higher rate.
  • “Rockets and Feathers”: Economists note that gas prices typically rise quickly (like a rocket) when oil prices spike but fall slowly (like a feather) even after tensions ease, as retailers are cautious about lowering prices until they are sure their replacement costs have stabilized.

Ultimately, while we have achieved a high level of energy independence on paper, we are still tied to a global price tag. When 20% of the world’s oil supply is suddenly at risk, the “neighborhood” of global energy becomes a lot more expensive for everyone. Understanding this helps us look past the daily headlines and focus on the broader economic reality: in a connected world, a bottleneck in the Middle East is felt at every gas station in America.

Please comment or send an email if you have any questions.

Joe Baker, CFP®

Baker Asset Management, LLC

joebaker@bakerassetmanagement.com
Monthly Update – April 2026

Calendar Notes

  • April 3rd, Friday – Good Friday. Stock market is closed.
  • April 15th, Wednesday – Federal taxes due.

Stocks faced a challenging month, to say the least, as investors grappled with the significant global economic shock triggered by the closure of the Strait of Hormuz as the Iran war intensified. The world found out the hard way how much the global economy depends on this waterway. Other than energy stocks and cash, there was no place to hide. Even bonds took a hit as inflation expectations grew.

For the month of March, the S&P 500 finished at a loss of more than 5.00%, well below its historical average over the last thirty years of +1.80%. For the year, the index is now down nearly 5.00%.

Looking ahead, potential catalysts to move stocks this April are the start of Q1 earnings announcements and the hope that the Iran war is coming to an end. There is also the usual economic data coming out later this week. Finally, the Fed meets at the end of the month, but expectations are for no change in interest rates, so don’t expect any market volatility following this meeting.

Historically, the performance of the S&P 500 index in April has been outstanding. Over the last thirty years, it has had an impressive +2.40% return on average. If the war ends within the first two weeks of April, I can see the index beating this number. If it continues, all bets are off.

Take a look at the Outlook section below to see what events could move the markets over the short term.

Bond prices took a beating as well in March, as yields spiked across the entire spectrum of the bond universe due to inflation fears and global economic uncertainty. Renewed expectations of higher inflation crushed the safe-haven appeal of Treasuries, while rising economic uncertainty caused the prices of riskier corporate and junk bonds to crater. The massive inflationary shock from the closing of the Strait of Hormuz was seen as forcing the Federal Reserve to be even more aggressive in raising interest rates.

The 10-year US Treasury note yield finished higher in March, settling at 4.32%, well above the 3.95% yield that it was at the beginning of the month. The 30-year bond yield closed out the month at 4.92%, 30 basis points higher than a month ago.

Checking the current high yield credit spread (HYCS) of 3.46%, it has jumped significantly since the beginning of February (2.81%) but is still well below the long-term average of 5.20%. This suggests that while the market is nervous, it is not yet pricing in a widespread wave of corporate defaults or a deep systemic recession. I’m keeping an eye on this metric because if it gets above 5%, historically this has not been a good sign for the markets.

Bond investors will be looking ahead to the economic data for March coming out shortly for signs of an economic slowdown. The FOMC meeting at the end of April should just be more of the same – keep rates unchanged and continue to monitor data.

I still like bonds with at least a 12-month maturity but plan on holding them until they mature.

Savings rates made some minor adjustments to their averages this past month. Still, as you can see in the first table below, there is a massive disparity between “traditional” brick-and-mortar banks (averaging around 0.45%) and online high-yield options. By moving cash from a standard savings account to a top-tier HYSA, you are effectively earning 7x to 10x more interest. That is certainly worth the time it would take for you to do a little research and make the move. Regarding CDs, the gap between short-term and long-term yields has narrowed significantly. In fact, you’ll notice that 1-year and 5-year rates are nearly identical at the top end, which is a classic sign of a market anticipating lower rates in the future. For savers and risk-averse investors, the rates still haven’t dropped enough to look elsewhere to park their money. However, some investors may look to shift some of their money market assets to high-yield bonds and/or dividend-paying blue-chip stocks as an alternative if rates drop

Account TypeAverage RateHighest Rate
Money Market Account0.43%4.10%
High-Yield Savings Account0.50%4.21%
CD Term Average RateHighest Rate
1-Year 1.75%4.50%
3-Year 1.48%4.10%
5-Year 1.53%4.50%

For now, CDs and MMAs are still a great place to put your cash and your emergency funds. Knowing this, it makes sense in most situations to put cash that you don’t immediately need into CDs with up to 2-year maturities. For emergency cash, stick to high yielding money market and savings accounts, of which the best are yielding about 4.0%. As always, keep the total under $250,000 per person at any one bank to ensure you are fully covered by the FDIC.

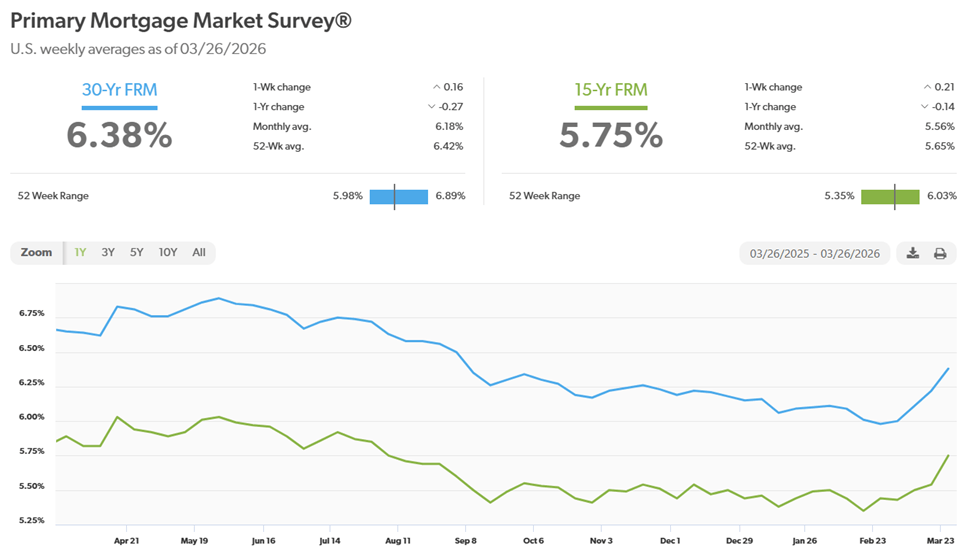
Mortgage rates rose significantly this past March, with the 30-year fixed rate climbing well over 6% to a six-month high. The increase was driven mainly by the Iran invasion which drove many raw material prices higher, most notably oil, fertilizer, and aluminum.

The 30-year fixed rate finished the month at 6.38%, 40 bps higher than last month. Looking ahead, rates could drift higher if the war continues to shut down the Strait of Hormuz, as this will continue to increase inflation.

Here is a look at the one-year chart of the 15- and 30-year mortgage rates from Freddie Mac.

Oil prices had a very volatile month in March, driven almost entirely by the US/Israel attack on Iran that threatened a significant portion of the global oil supply. In fact, Brent crude oil price had its steepest monthly rise in recorded history.

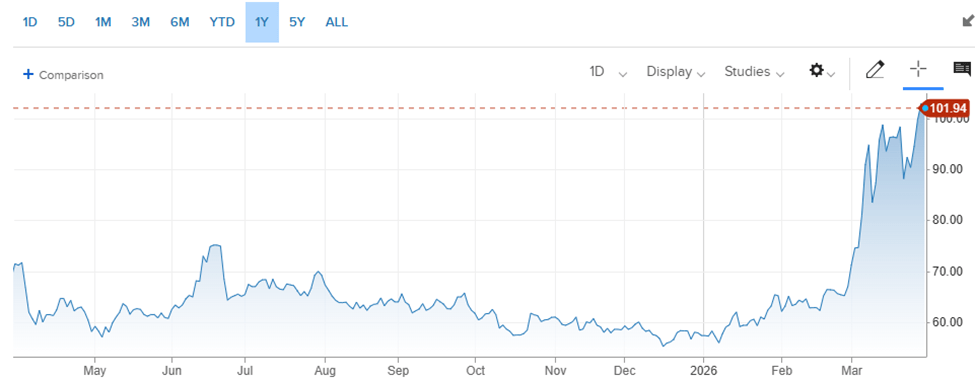
For the month of March, the price for a barrel of West Texas Intermediate (WTI) oil started at $67.02 and ended at $101.94, up nearly $35 for the month. That is unbelievable. For the year, it is now up $44.52 a barrel, almost 78%.

Looking ahead, this war could be coming to an end sooner than later, which is great news for everybody. It will take some time to get the oil flow through the Strait of Hormuz back up to its pre-war rate, but prices should start to come down much sooner. Regardless, with diesel prices as high as they are now, expect shipping surcharges across the economy for a while.

Here’s a look at the one-year chart for U.S. oil:

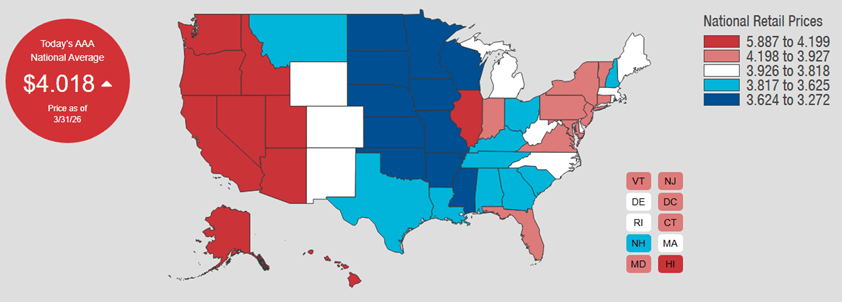
Gasoline prices experienced an extreme, historic surge in March, directly reflecting the massive volatility in global crude oil markets. The national average price broke through the $4.00 mark for the first time since August 2022. Even worse has been the surge in diesel prices. Even if the war ends tomorrow, it will take a while before they can get pre-war supply flow back. Besides the Iran war, seasonal demand could add further upward pressure to prices at the pump this spring. Oklahoma has the cheapest gas currently, checking in at $3.27 a gallon. California has the most expensive gasoline at $5.89 per gallon. FYI, a year ago, we were paying $3.17.

Check out the prices at the pump in your area: AAA Gas Prices.

Outlook

Events on the horizon that could move the markets in the near term:

  • Fed, Rates, & Inflation: The Federal Open Market Committee (FOMC) met in mid-March and held rates steady once again. They significantly scaled back expectations for rate cuts once we attacked Iran. Now, the majority of FOMC members anticipate either one cut or no cuts at all this year. The worry of stagflation, high inflation coupled with increasing unemployment, has once again hurt the chances of the Fed lowering interest rates anytime soon.

Regarding jobs and wage growth, employment data has been volatile with so many revisions each month. Wages have remained a resilient part of the economy, consistently growing at a pace that is slightly outpacing inflation. This is a nice bright spot.

There are no expectations of any changes to the Fed’s stance on interest rates when they meet at the end of April.

  • Trump Administration Policies: There’s so much chaos coming out of DC that the trade and immigration policies no longer hog the headlines. Still, there has been a lot of activity on these fronts.

Trade – Over 3,000 companies have sued the government seeking refunds on the illegally imposed tariffs. No refunds have been issued as of yet. Also, the administration added a blanket 10% tariff on everything coming into the U.S. but that is only valid for 150 days. Expect the government to drag their feet on issuing refunds.

Immigration – On the immigration front, the administration’s restrictive policies continue to significantly impact the U.S. economy, primarily through labor supply shocks in critical sectors. This has resulted in labor shortages and higher prices, particularly in agriculture/food supply, construction, and the restaurant/leisure sectors. Also, for the first time in over 50 years, net migration was estimated to be negative in 2025, which will directly weaken consumer spending by up to $110 billion through 2026, according to the Brookings Institution. That’s a negative catalyst for the markets for the foreseeable future.

  • Iran Conflict: As this war stretches into its second month, its effect on the global economy continues to worsen. The closure of the Strait of Hormuz has created a self-inflicted economic wound. With twenty percent of the world’s oil and natural gas supplies effectively halted as well as fertilizer supplies cut off, the world is quickly slipping into a global recession. Food and fuel supplies across the planet are being depleted and rationing has begun. If the war continues, expect to see inflation accelerate and the energy shock to devastate the global economy.

Although this is a self-inflicted injury like the tariff and immigration chaos, this will not be quick or easy to recover from once we get out. It will take months and even years to repair the damage that the war has done to the industrial infrastructure in the region, and that goes way beyond the fossil fuel industries – think aluminum, fertilizer, plastics, and chip fabrication to name a few sectors. Also, our already damaged relationships with long-time allies due to trade policies are now in serious jeopardy because of this war. So, the sooner we get out of this mess, the better. I will add that this downturn in the stock market could be a buying opportunity if your holding period is more than two years.

Joe Baker, CFP®

Baker Asset Management, LLC

joebaker@bakerassetmanagement.com
A High Earner’s Guide to the 2026 $150k Threshold and Super Catch-Ups

For years, high-earning professionals aged 50 and older have relied on pre-tax catch-up contributions to shave thousands off their annual tax bills while fortifying their retirement nests. However, a major change recently occurred, as the SECURE 2.0 Act officially mandated that “high earners”—defined as those with prior-year (2025) wages exceeding $150,000—must transition their catch-up contributions exclusively to a Roth (after-tax) basis. While this removes the immediate tax deduction you may be accustomed to, it also unlocks a powerful opportunity for entirely tax-free growth and withdrawals in your later years. Understanding these new rules is no longer optional; it is a critical step in preserving your retirement strategy’s efficiency.

How Compensation Affects Your Company Match

When it comes to employer matching, the most important thing to know is that your company matches dollars, not tax types. Here is how your compensation and contribution choices interact with that match:

  • Match Calculation is Based on Gross Pay: Your employer typically matches a percentage of your eligible compensation (e.g., 50% of the first 6% you contribute). This calculation uses your gross, pre-tax pay, even if your own contributions are made on a Roth (after-tax) basis.
  • The $360,000 Salary Cap: For 2026, the IRS has set the compensation limit at $360,000. This means any income you earn above this amount cannot be used by your employer to calculate matching contributions.
  • Roth vs. Traditional Match Placement: Traditionally, employer matches are deposited into a pre-tax account, regardless of whether your contribution was Roth or traditional. However, under newer rules, some employers may now allow you to receive the match directly into your Roth account. If you choose this “Roth match” option, those matching dollars will be treated as taxable income in the year they are received.
  • Catch-Up Contributions and Matching: Most companies only match your “regular” contributions (up to the standard $24,500 limit for 2026) and do not provide additional matching on catch-up amounts. It is vital to check your specific plan document to see if your catch-up dollars trigger any extra employer funds.

Also in 2026, the “super catch-up” provision offers a significant boost for older savers.

  • Higher Limit: Participants aged 60, 61, 62, or 63 (by the end of the calendar year) can contribute up to $11,250 in catch-up contributions for 2026.
  • Total Potential Savings: When combined with the standard elective deferral limit of $24,500, these individuals can save a total of $35,750.
  • Comparison to Standard Catch-up: This is an increase over the standard $8,000 catch-up limit available to other participants aged 50 and older.
  • Age Cliff: Once a participant turns 64, their eligible catch-up amount reverts to the standard limit (e.g., $8,000 for 2026).
  • Roth Requirement for High Earners: Just like the standard catch-up, if your prior-year FICA wages exceeded $150,000, these super catch-up contributions must be made on a Roth basis.
  • Plan Optionality: It is important to note that employers are not required to offer the super catch-up; it is an optional plan feature.

Here is a table that compares different 2026 contribution limits based on age and income levels.

2026 401(k) Contribution Limits Comparison

Age GroupStandard LimitCatch-up AmountTotal LimitRoth Requirement (if 2025 Wages >$150k)
Under 50$24,500$0$24,500N/A
50 – 59$24,500$8,000$32,500Yes (Catch-up portion only)
60 – 63 (Super Catch-up)$24,500$11,250$35,750Yes (Catch-up portion only)
64 and Older$24,500$8,000$32,500Yes (Catch-up portion only)
  • Standard Limit: The base elective deferral for all participants increases to $24,500 in 2026.
  • Catch-up Eligibility: Participants aged 50 or older can contribute an additional $8,000.
  • Super Catch-up Enhancement: Under the SECURE 2.0 Act, those aged 60–63 receive a higher catch-up limit of $11,250.
  • Combined Annual Limit: The total limit for all contributions (employee plus employer match/profit sharing) is capped at $72,000 (plus any applicable catch-up).
  • High Earner Definition: The $150,000 threshold is based on FICA wages (Box 3 of your W-2) from the same employer in the preceding year.

2026 Total Possible Savings by Age

If you maximize both the combined (employee plus employer contributions) annual limit and your age-based catch-up, your total account additions can reach:

  • Age 50–59: $80,000 ($72,000 limit + $8,000 catch-up).
  • Age 60–63: $83,250 ($72,000 limit + $11,250 super catch-up).
  • Age 64+: $80,000 ($72,000 limit + $8,000 catch-up).

The 2026 mandatory Roth catch-up rule represents a significant pivot in how high earners must approach their peak saving years. While losing the upfront tax break on those extra contributions might sting today, the trade-off is a growing pool of assets that the IRS can never touch again. Whether you are hitting the $150k wage threshold or entering the “Super Catch-Up” age bracket, the key to 2026 is early coordination with your payroll department and financial advisor to ensure your contributions are coded correctly and your retirement trajectory remains on track.

Please comment or send an email if you have any questions.

Joe Baker, CFP®

Baker Asset Management, LLC

joebaker@bakerassetmanagement.com