Scammers love tax season almost as much as they look forward to the holidays. In both cases, a seasonal flurry of financial transactions and activity provides cover and opportunities they can use to try to defraud investors and advisor firms.
We all try to be extra-vigilant during these periods. But unfortunately, today’s scams are more sophisticated and subtle than in previous years—with some offering no obvious red flags. The reason? AI.
Gone are the days of misspelled emails from dodgy addresses: these days, many fraudsters send professional, personalized communications that appear to come from trusted sources.
AI allows scammers to create realistic communications that feel timely and in line with legitimate communications you receive from trusted institutions, including polished emails, convincing phone calls, and messages tailored to you. These tactics are designed to create a sense of urgency, encouraging you to act quickly without verifying the request.
Real-World Examples of Tax Scams
“Refund on hold” texts or emails Taxpayers may receive a notice that their refund can’t be paid until their personal information is verified. A link leads the victim to a realistic-looking fake website designed to capture personal or banking details.
Tax professional impersonation phone calls Scammers use calm, professional-sounding human or AI voices to impersonate professionals from the IRS, a tax preparer, or a financial institution. These authoritative voices reference real names and firms to appear credible, and encourage recipients to take urgent action to “pay back taxes,” “claim a refund,” or “verify their information,” which of course leads to the theft of data or assets.
Personalized “action required” emails These messages, which may advertise an unclaimed tax refund, a tax account update, or an important notice from the IRS, may include the victim’s name and top-of-mind tax season topics, making the message seem legitimate, and encouraging quick action without double-checking.
REMEMBER: tax authorities do not initiate contact by email, phone calls or text to request sensitive information. The IRS initiates most contacts through regular mail, not phone calls, and will never demand immediate payment or threaten arrest over the phone.
How to protect yourself
Pause before acting—urgency is a common scam tactic.
Verify any communications—if the “IRS” has contacted you, visit IRS.gov. and check the message you’ve received using a legitimate phone number.
Avoid clicking links or opening attachments in unexpected messages.
When in doubt, don’t respond—talk to your advisor or tax professional first.
Scams will continue to evolve as technology advances. Staying alert, slowing down, and verifying requests can help protect your personal and financial information.
Please comment or send an email if you have any questions.
The Strait of Hormuz is often called the “world’s most important oil artery,” but its role in the global economy extends far beyond just crude oil. As of March 2026, the ongoing conflict involving the U.S., Israel, and Iran has effectively turned this narrow waterway into a “nightmare scenario” for global trade. Beyond the millions of barrels of crude, the Strait is the exit point for 20% of the world’s Liquefied Natural Gas (LNG), nearly a third of the global seaborne fertilizer trade, and a massive 8% of the world’s aluminum supply. From the essential chemicals like sulfur that power our mines and farms to the refined fuels that keep global shipping afloat, the blockade of Hormuz isn’t just an energy crisis, it is a total systemic disruption of the materials that build our cities, feed our populations, and power our technology.
Below are the main commodities that pass through the Strait and how the current war is impacting their supply and pricing.
1. Energy: The Lifeblood of the Global Economy
The Strait of Hormuz is the primary conduit for energy moving from the Persian Gulf to the rest of the world.
Crude Oil & Petroleum Liquids: Roughly 20–21 million barrels per day (bpd)—about 20% of global consumption—transit the Strait.
Impact: Since the escalation on February 28, 2026, oil prices have been highly volatile. Brent crude spiked from around $70 to a peak of nearly $120 per barrel before stabilizing near $90.
Supply: Most exports go to Asia (China, India, Japan, South Korea). With the Strait effectively under blockade, these nations are facing immediate supply shortages.
Liquefied Natural Gas (LNG): About 20% of the world’s seaborne LNG passes through the Strait, almost all of it from Qatar.
Impact: QatarEnergy recently declared force majeure and suspended production at its main facilities following regional attacks. This has caused European natural gas futures to jump by over 70% in early March.
2. Agriculture: The Fertilizer Crisis
While less discussed than oil, the Strait is a critical chokepoint for the materials that grow the world’s food.
Fertilizers (Urea, Ammonia, Phosphates): Between 25% and 33% of the global seaborne trade in fertilizer raw materials passes through the Strait.
Impact: Regional producers like Saudi Arabia and Iran are massive exporters of urea. The “soft closure” of the Strait has halted these shipments, causing benchmark Egyptian urea prices to rise by more than 25%.
Economic Ripple: Because half of global food production relies on synthetic fertilizers, this disruption is expected to push up the prices of household staples like bread, pasta, and animal feed globally.
3. Industrial Metals: The Aluminum Squeeze
The Gulf region has become a major hub for high-grade industrial metals, which are now trapped behind the blockade.
Aluminum: The Gulf produces about 8% of the world’s aluminum. Smelters in Bahrain, Qatar, and the UAE rely on the Strait for both exporting finished metal and importing raw materials like bauxite and alumina.
Impact: Qatari smelters (like Qatalum) have begun shutting down due to gas supply suspensions. This “dual squeeze”—blocking both raw material imports and finished metal exports—has sent aluminum prices soaring on the London Metal Exchange.
4. The Middle East: The World’s Sulfur Engine
The Persian Gulf region accounts for approximately 50% of the global seaborne sulfur trade. It is produced primarily as a byproduct of natural gas processing and oil refining at massive hubs like Ras Laffan (Qatar) and Ruwais (UAE).
Impact: Closing the Strait of Hormuz halts both the fuel and the feedstock for sulfuric acid—the most produced chemical on Earth. Without this acid, we lose the ability to extract copper and cobalt. No copper or cobalt means no EV batteries, no power transformers, and no data center hardware.
In summary, the crisis in the Strait of Hormuz is a stark reminder that our globalized economy is only as resilient as its most narrow corridor. We have long viewed this waterway through the lens of oil prices, but the events of March 2026 have proven that the stakes are far more complex. When the Strait closes, the world loses more than just fuel; it loses the LNG heating European homes, the aluminum framing our modern architecture, the fertilizers sustaining global agriculture, and even the airfreight capacity that moves our electronics and medicines. The ‘Hormuz Factor’ is not merely an energy shock—it is a systemic threat to the physical materials that build and feed our world. Let’s hope we can get a quick resolution to this ill-advised war.
Please comment or send an email if you have any questions.
Stocks could not continue their positive vibe from the beginning of the year as February finished in the red for most indices.
For the month of February, the S&P 500 finished at a loss of almost 1.00%, below its historical average over the last thirty years of +0.37%. Sticky inflation data and the fear of several industries being viewed as highly vulnerable to disruption by AI were enough to offset positive earnings reports and decent job numbers. For the year, the index is now up about 0.60%
Looking ahead, potential catalysts to move stocks this March include the February jobs report due out on Friday, March 6th. Also, the FOMC meeting on March 19th could stir up the markets. The Fed is expected to continue their pause on cutting rates so any change will certainly create some volatility.
Historically, the S&P 500 index has performed quite well in March, often referred to as the starting gun for the “Spring Rally”. Over the last thirty years, it has had an impressive +1.80% return on average.
Take a look at the Outlook section below to see what events could move the markets over the short term.
Bond prices, with the exception of junk bonds, had a nice run up in the month of February. The best performing bonds were those with longer dated maturities. In fact, U.S. Treasury bonds with 10 year or longer maturities had their best month in over two years. The main reason was the SCOTUS tariff ruling, which struck down broad universal reciprocal tariffs and was viewed by bond traders as a massive disinflationary event. By invalidating tariffs that were viewed as a “tax” on consumers, the ruling lowered long-term inflation forecasts, causing bond prices to rise.
The 10-year US Treasury note yield finished higher in January, settling at 3.95%, much lower than the 4.24% yield that it was at the beginning of the month. The 30-year bond yield closed out the month at 4.62%, 26 basis points lower than a month ago.
Bond investors will be looking ahead to the FOMC meeting in mid-March to get some clarity on how many rate cuts they are considering this year. Consensus shows that they won’t cut rates again until June at the earliest.
I still like bonds with at least a 12-month maturity but plan on holding them until they mature.
Savings rates came down rather significantly, particularly the longer-term CD rates, as inflation expectations eased following the tariff ruling by SCOTUS. For savers and risk-averse investors, the rates still haven’t dropped enough to look elsewhere to park their money. However, some investors may look to shift some of their money market assets to high-yield bonds and/or dividend-paying blue-chip stocks as an alternative.
Account Type
Average Rate
Highest Rate
Money Market Account
0.39%
4.25%
High-Yield Savings Account
0.56%
5.05%
CD Term
Average Rate
Highest Rate
1-Year
1.88%
4.10%
3-Year
1.63%
3.95%
5-Year
1.68%
4.15%
For now, CDs and MMAs are still a great place to put your cash and your emergency funds. Knowing this, it makes sense in most situations to put cash that you don’t immediately need into CDs with up to 2-year maturities. For emergency cash, stick to high yielding money market and savings accounts, of which the best are yielding about 5.0%. As always, keep the total under $250,000 per person at any one bank to ensure you are fully covered by the FDIC.
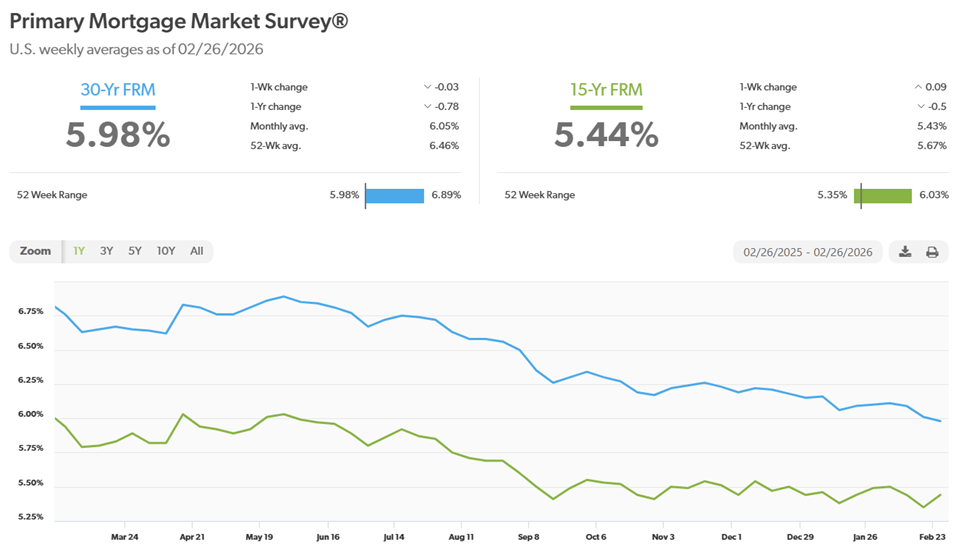
Mortgage rates continued their march lower in February for a third month in a row. Also, for the first time in nearly three and a half years, the average 30-year fixed rate dipped below 6%. This downward trend has begun to crack the “lock-in effect,” encouraging homeowners to list their properties and providing a much-needed boost in inventory just in time for the spring buying season.
The 30-year fixed rate finished the month at 5.98%, 12 bps lower than last month and finally below the 6% mark. Looking ahead, rates are most likely to hover in the 6% neighborhood, especially if inflation remains sticky, which will keep the Fed from cutting rates any further in the short term.
Here is a look at the one-year chart of the 15- and 30-year mortgage rates from Freddie Mac.
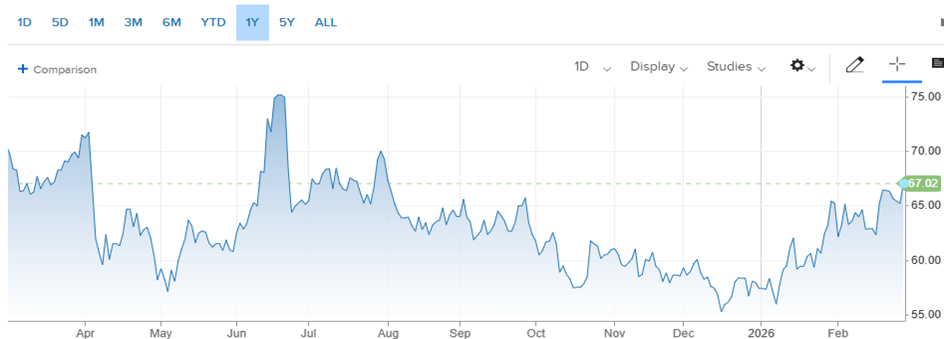
Oil prices continued their move higher in February as geopolitical tensions (U.S./Israel v Iran) put upward pressure on global prices. As I write this, U.S. and Israel have commenced air strikes on Iran and they have countered. Expect a temporary spike in prices this week.
For the month of February, the price for a barrel of West Texas Intermediate (WTI) oil started at $65.74 and ended at $67.29, up $1.55 for the month. For the year, it is now up $9.87 a barrel, almost 10%.
Looking ahead, if this Iran conflict lingers on, we could see prices rise into the upper $70s but hopefully cooler heads will prevail to find some resolution.
Here’s a look at the one-year chart for U.S. oil:
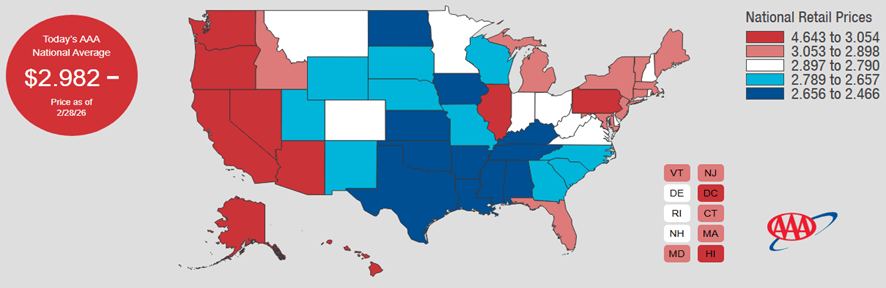
Gasoline prices followed oil higher in February for the second month in a row. Low seasonal demand at this time of year won’t be enough to offset the Iran conflict in the near term but a quick resolution should put some downward pressure on prices before we start thawing out in the spring. Oklahoma has the cheapest gas currently, checking in at $2.47 a gallon. California has the most expensive gasoline at $4.64 per gallon. FYI, a year ago, we were paying $3.11.
Check out the prices at the pump in your area: AAA Gas Prices.
Outlook
Events on the horizon that could move the markets in the near term:
Fed, Rates, & Inflation: The Federal Open Market Committee (FOMC) did not meet this past month, and it looks like they are going to continue to keep interest rates steady in the short term. They meet again in the middle of March, but recent economic data still shows inflation holding steady, meaning a rate cut is not likely in the near future.
Regarding jobs and wage growth, the recent Supreme Court ruling striking down broad tariffs could provide a “confidence boost” to companies, as businesses regain the capital previously tied up in duty payments to hire more workers and/or increase wages.
Trump Administration Policies: SCOTUS finally released their decision on the legality of most of the tariffs imposed by the Trump administration in 2025. The Court ruled that the president does not have the authority to impose broad, open-ended tariffs under the International Emergency Economic Powers Act (IEEPA) of 1977. Now, the process of refunding those tariffs to the U.S. companies that paid them begins. The result is good news for U.S. companies and consumers, but it was largely priced into both stocks and bonds already so it will not be a major market mover.
Aggressive immigration enforcement and restrictive visa policies continue to have a detrimental effect on the economy in the form of significant labor shortages and decreased revenue across several U.S. sectors. Some of the sectors that have been hit the hardest are agriculture, tourism/hospitality, and construction. This continues to put upward pressure on inflation, particularly in housing, groceries, and the food and beverage industry.
Iran Conflict: As far as catalysts go for the stock and bond markets, this came off the back burner this weekend in a hurry, emerging as the single most critical factor determining market performance. If this conflict intensifies, we could see a flight to safety (sell stocks, buy treasuries) driven by fears of a sustained energy price spike that could derail anticipated interest rate cuts and reignite inflationary pressures. For long-term stock investors, it could be a buying opportunity if your holding period is more than two years.
Deciding when to claim Social Security involves balancing immediate financial needs against long-term benefit growth. While you can start as early as age 62, your monthly payment increases for every month you delay until age 70, making the difference in the benefit amount significant in most cases. It’s a high-stakes decision because the choice you make now is largely permanent and affects how much you’ll receive every month for the rest of your life. To help cut through the confusion, here’s a simple step-by-step logic flow to help you decide which age makes the most sense for your health, your work life, and your family.
Social Security Claiming Flowchart
Do you have an immediate, urgent need for cash to meet basic living expenses?
YES: Claim at age 62. Note that your benefits will be permanently reduced by up to 30% compared to your full retirement age.
NO: Go to Step 2.
Are you still working and earning above the annual limit ($24,480 in 2026)?
YES: Consider waiting until your Full Retirement Age (FRA). If you claim before FRA while working, Social Security may temporarily withhold $1 for every $2 you earn above the annual limit.
NO: Go to Step 3.
What is your health status and expected longevity?
POOR HEALTH / LOW LONGEVITY (Expected life < 77 years): Claim early. Taking smaller payments for more years often results in a higher total lifetime value if you do not expect to live past your late 70s.
GOOD HEALTH / FAMILY LONGEVITY (Expected life > 81 years): Wait until Age 70. Delaying past your FRA earns you 8% more in Delayed Retirement Credits for every year you wait, maximizing your monthly check for life.
AVERAGE: Go to Step 4.
Are you married and the higher-earning spouse?
YES: Wait until age 70. This maximizes the survivor benefit for your spouse if you pass away first.
NO: Claim at FRA (Age 66-67). This provides 100% of your earned benefit without reductions or further delays.
Don’t forget that The Social Security site has a plethora of good information and tools to help you make the best decision for your situation.
At the end of the day, the goal is to maximize your peace of mind. If you need the money now or have health concerns, taking benefits early is a perfectly valid safety net. However, if you are healthy and can afford to wait, ‘buying’ a bigger paycheck by delaying can be the best insurance policy against outliving your savings. Use these guidelines as a starting point but always check your latest earnings statement on the SSA website to see the exact dollar amounts you’re working with.
Please comment or send an email if you have any questions.
We often think of Artificial Intelligence as something ethereal—code floating in the “cloud.” But the reality of 2026 is grounded in steel, concrete, and energy supply. With Big Tech “hyperscalers” like Microsoft, Amazon, Meta, and Google projected to spend between $600 and $650 billion this year alone on infrastructure, we are witnessing an industrial buildout that economists argue now rivals the railroad expansion of the 1850s. While the first phase of the AI revolution was defined by who could design the smartest chip, the next phase will be defined by who can physically power it. The opportunity for investors is no longer just about the model; it is about the massive machine required to run it.
What is an AI Data Center?
Unlike traditional data centers that store files and run websites, AI data centers are designed for massively parallel computing. This creates unprecedented heat and power density. (Geek alert) While a standard server rack consumes 5–10 kW, a modern rack equipped with NVIDIA Blackwell or H100 GPUs demands 40 kW to over 100 kW. This physical constraint is forcing a complete redesign of the data centers needed in the AI world.
The Builders & Locations
The build-out is led by the “Hyperscalers”—Microsoft, Amazon (AWS), Google, and Meta—who are racing to secure land and power. Because these facilities consume gigawatts of electricity (enough to power small cities), they are moving away from congested hubs like Northern Virginia to regions with available power and land.
The Power Belt (Ohio, Indiana, Midwest): Emerging as a prime location due to grid capacity and land availability.
Texas: Attracting massive investment due to its independent energy grid and renewable abundance.
Nuclear Sites: Data centers are increasingly being built “behind the meter” at nuclear plants (e.g., Pennsylvania) to guarantee 24/7 zero-carbon power.
Investment Opportunities: The “Picks & Shovels”
Investors are looking beyond the chipmakers to the companies building the physical infrastructure. This includes thermal management (cooling), power distribution, and real estate.
Ticker
Company
Primary Role
Investment Thesis
VRT
Vertiv Holdings
Liquid Cooling
Market leader in thermal management; essential for cooling NVIDIA’s hot chips.
ETN
Eaton Corp
Power Mgmt
Critical electrical infrastructure (transformers, switchgear) for grid upgrades.
CEG
Constellation Energy
Nuclear Power
Owner of largest US nuclear fleet; prime partner for baseload AI power deals.
DLR
Digital Realty
Data Center REIT
Global landlord for data centers with strong hyperscaler relationships.
MOD
Modine Mfg
Thermal Systems
Pivot from automotive cooling to high-growth data center thermal solutions.
ANET
Arista Networks
AI Networking
Provides the ultra-fast ethernet switches needed to connect GPU clusters.
Investment Note: This list is for informational purposes only and does not constitute financial advice. Stocks in this sector, particularly pure plays like Vertiv, have seen significant volatility.
As the AI race accelerates, the primary bottleneck has shifted from silicon availability to energy reliability. With modern GPU racks consuming over 100 kW of power—ten times the standard of a decade ago—the digital economy is colliding with the physical limits of the power grid. For the astute investor, this signals a clear pivot: the most durable long-term value may not be found in the volatile software wars, but in the “picks and shovels” of the infrastructure supply chain—the liquid cooling systems, the copper interconnects, and the baseload nuclear power that keep the lights on. The code is written, but the concrete is just beginning to pour.
Please comment or send an email if you have any questions.
When it comes to selling assets, what you keep is far more important than the sale price. Navigating the 2026 tax landscape requires more than just picking the right stocks or timing the real estate market; it requires a strategic understanding of how to lower your tax bill by accounting for every eligible expense. From the hidden costs of closing a deal to the power of tax-loss harvesting, knowing which deductions can offset your capital gains is the key to protecting your portfolio’s growth and ensuring you aren’t overpaying Uncle Sam.
To determine taxable capital gains for the 2026 tax year, the IRS allows you to deduct specific expenses that reduce either the final sale proceeds or the original cost basis of the asset.
Direct Reductions to Capital Gains
Taxable gain is calculated by subtracting your adjusted basis and selling expenses from the total sale price.
Selling Expenses: You can deduct costs directly related to the transfer or sale of the asset, such as:
Brokerage commissions and transaction fees for stocks and securities.
Legal fees, advertising, and appraisal costs.
Closing costs for real estate, including title search fees, notary fees, escrow fees, and recording fees.
Marketing and staging costs to prepare a property for sale.
Transfer taxes or stamp taxes charged by local or state governments.
Adjusted Cost Basis (Acquisition Costs): You can increase your basis (thereby decreasing your gain) by including:
The original purchase price of the asset.
Incidental acquisition costs like sales taxes, excise taxes, and shipping/handling.
Installation and setup charges required to make the asset usable.
Capital improvements for real estate that add value or prolong the property’s life (e.g., a new roof, kitchen remodel, or HVAC system). Note: Routine repairs like painting or fixing leaks are not deductible.
Offsetting Gains with Losses
One of the most effective ways to reduce capital gains tax is by deducting capital losses.
Tax-Loss Harvesting: You can use realized capital losses from selling underperforming investments to offset capital gains in the same year.
Net Loss Deduction: If your total capital losses exceed your total capital gains, you can deduct up to $3,000 of the remaining loss against ordinary income ($1,500 if married filing separately).
Loss Carryover: Any excess net capital loss above $3,000 can be carried forward indefinitely to future tax years.
Investment Interest Expense
If you borrowed money to purchase taxable investments (such as using a margin loan to buy stock), the interest paid may be deductible as an itemized deduction.
The deduction is generally limited to your net investment income for the year.
Any unused interest expense can be carried forward to the following tax year.
This deduction is not allowed in any tax-deferred accounts, such as an IRA.
Non-Deductible Expenses for 2026
Under current laws (including the One Big Beautiful Bill Act effective for 2026), several formerly common expenses are not deductible for individual taxpayers:
Miscellaneous Investment Fees: Investment advisory fees, IRA custodial fees, and accounting costs for individual investors are permanently disallowed.
Personal Property Losses: You cannot deduct losses from the sale of personal-use property, such as your personal car or a primary residence.
Securities Transaction Tax (STT): Certain taxes like STT or annual maintenance charges (AMC) for brokerage accounts cannot be claimed.
Maximizing tax efficiency in your investment portfolio requires careful attention to detail. By effectively tracking and managing adjustments to your cost basis and strategically utilizing tax loss harvesting, investors can potentially reduce their tax liability. Staying informed about current IRS regulations regarding investment expenses is crucial to ensure all deductions are properly claimed, ultimately allowing you to retain more of your investment returns.
Please comment or send an email if you have any questions.
February 16th, Monday – President’s Day. Stock market is closed.
Stocks posted a healthy, positive performance to get the year off to a good start. This was even more impressive when you consider the chaos coming out of DC, causing uncertainty as well as a convergence of sovereign and civil unrest.
For the month of January, the S&P 500 had a nice gain of 1.37%, well above its average of 0.28% over the last thirty years. The other good news is that historically, when the S&P 500 has a positive return in January, the rest of the year has performed exceptionally well, with an average annual return of approximately 16.9% and a positive full year return 89% of the time, based on data since 1950. If this holds true, that will make it four consecutive years of positive returns for the index. Undoubtedly, the ongoing AI revolution could make this a reality. We will see in eleven months.
Looking ahead, potential catalysts to move stocks this February include the possible SCOTUS decision on the legality of many of the tariffs implemented in 2025. Also, there are still some large tech companies, Amazon, Alphabet, and Nvidia specifically, that will report Q4 earnings over the next few weeks that could have influence over the entire stock market. Finally, the weak dollar is creating artificial inflation within the economy, causing input materials, such as metals, crops, and fossil fuels valued in dollars to increase in price significantly.
Historically, February is often cited as one of the worst months for the S&P 500 index. Over the last thirty years, it has had a meager 0.37% return on average.
Take a look at the Outlook section below to see what events could move the markets over the short term.
Bond prices were mixed this past January, with shorter maturities heading higher and bonds with ten plus years to maturity dropping slightly. FOMC keeping rates steady had little affect on bonds since this decision was already factored into bond prices.
The 10-year US Treasury note yield finished higher in January, settling at 4.24%, higher than the 4.16% yield that it was at the beginning of the month. The 30-year bond yield closed out the month at 4.88%, 4 basis points higher than a month ago.
A major influence on bond prices currently is the weakening dollar. A sustained dollar weakness has the potential to erode foreign demand for US Treasuries, about a third of which are held outside the US. A weak dollar also makes imports more expensive, creating currency-driven inflation. This will steer the Federal Reserve towards maintaining or raising interest rates to tame inflation from both the weak dollar as well as from the tariffs. A stronger dollar can offset some of the inflation caused by the tariffs currently being imposed by the Trump administration.
Even though there is no FOMC meeting in February, bond investors will still be active as a deluge of fresh economic data comes out this week, including the monthly jobs report, manufacturing PMI, and consumer sentiment.
I still like bonds with at least a 12-month maturity but plan on holding them until they mature.
Savings rates were slightly higher for CDs with longer maturities but everything else was about the same as last month. I suspect they will stay put now that the Fed has paused their rate cuts, at least for the next few months. For savers and risk-averse investors, the rates still haven’t dropped enough to look elsewhere to park their money.
Account Type
Average Rate
Highest Rate
Money Market Account
0.56%
4.10%
High-Yield Savings Account
0.39%
5.00%
CD Term
Average Rate
Highest Rate
1-Year
1.77%
5.11%
3-Year
1.53%
4.30%
5-Year
1.56%
4.50%
For now, CDs and MMAs are still a great place to put your cash and your emergency funds. Knowing this, it makes sense in most situations to put cash that you don’t immediately need into CDs with up to 2-year maturities. For emergency cash, stick to high yielding money market and savings accounts, of which the best are yielding about 5.0%. As always, keep the total under $250,000 per person at any one bank to ensure you are fully covered by the FDIC.
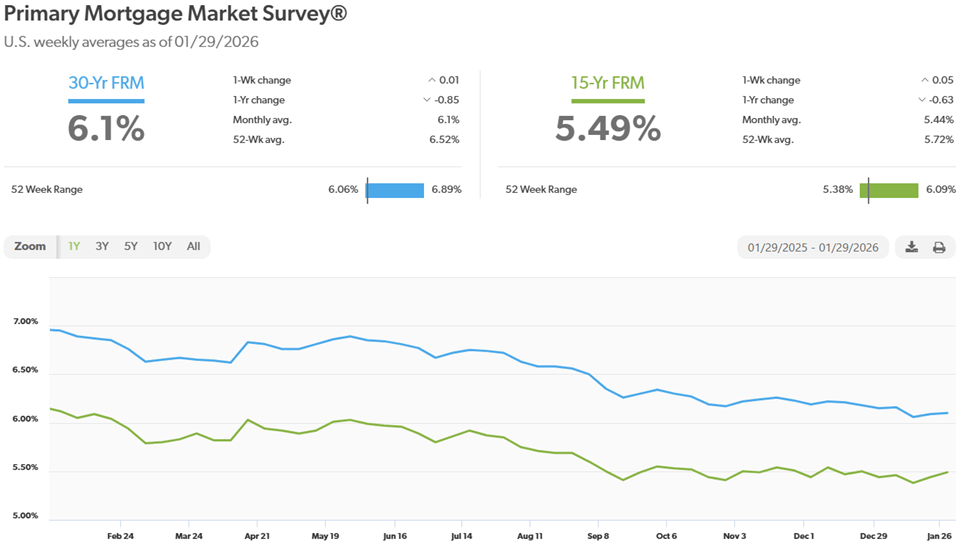
Mortgage rates continued to drift lower in January for a second month in a row. With the Fed holding bank lending rates steady after their meeting this past week, mortgage rates are expected to flatten out in the 6% neighborhood over the next few months as expectations for additional Fed rate cuts this year diminish. Regarding the housing market, it continues to shift to a strong buyer’s market, with the gap between sellers and buyers widening to about 42%, the largest gap on record. Even so, with housing prices near all-time highs, affordability is preventing many buyers from owning a home.
The 30-year fixed rate finished the month at 6.10%, 8 bps lower than last month and ever so close to breaching the 6% mark.
Here is a look at the one-year chart of the 15- and 30-year mortgage rates from Freddie Mac.
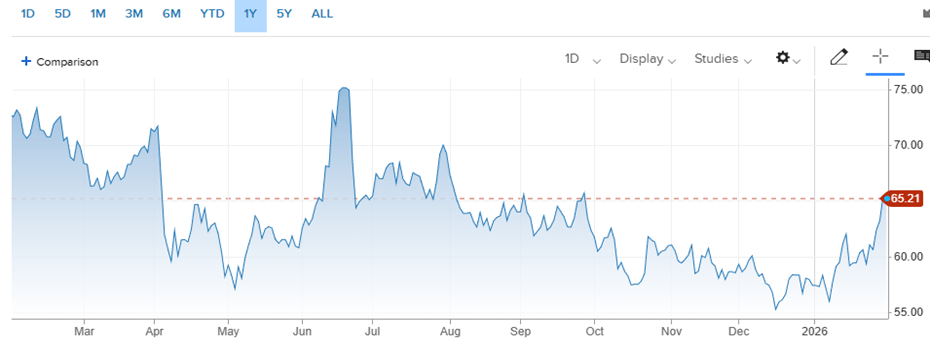
Oil prices had a major reversal in January and moved higher as a combination of geopolitical tensions (U.S. discussing plans about striking Iran) and a weaker dollar put upward pressure on the price of black gold.
For the month of January, the price for a barrel of West Texas Intermediate (WTI) oil started at $57.42 and ended at $65.74, up $8.32 for the month.
Looking ahead, if we don’t attack Iran and the dollar halts its drop, I still see prices hovering around the $60 area for the next few months. That said, if prices continue higher, we’ll see wells that shut in due to low prices open back up to capture some profits.
Here’s a look at the one-year chart for U.S. oil:
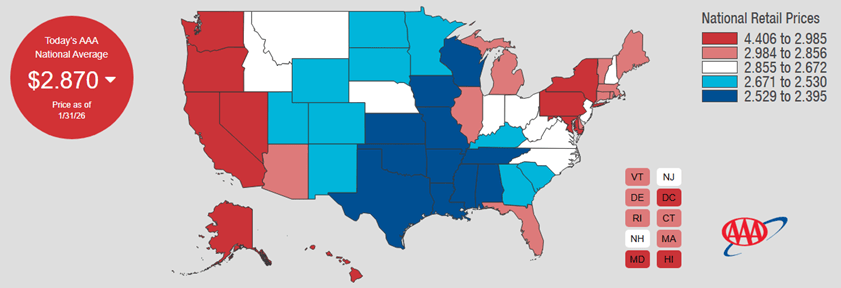
Gasoline prices creeped back up in late January following oil’s big reversal. A gallon of regular unleaded ended the month at $2.87, $0.03 higher than last month. Seasonal demand at this time of year should keep some downward pressure on prices before we start thawing out in the spring. Oklahoma had the cheapest gas this past month, checking in at $2.40 a gallon. Hawaii has the most expensive gasoline at $4.41 per gallon. FYI, a year ago, we were paying $3.11.
Check out the prices at the pump in your area: AAA Gas Prices.
Outlook
Events on the horizon that could move the markets in the near term:
Fed, Rates, & Inflation: The Federal Open Market Committee (FOMC) decided to hold the federal funds rate steady in the target range of 3.5% to 3.75% at its meeting this past Wednesday. This marks a pause after three consecutive rate cuts in late 2025. They noted improving economic activity and a more stabilized labor market as the main reasons for the rate cut pause.
Inflation is still prevalent but has levelled off somewhat at 2.7%. This means that prices are still rising but the rate of increase, aka inflation, is getting closer to the Fed’s goal of 2.0%. Regarding the labor market, there have been quite a few layoff announcements included in Q4 earnings reports by some of the largest U.S. companies. This could sway the FOMC to restart rate cuts later in the year. Investors are expecting a few more cuts this year so stock and bond prices might already reflect these rate adjustments. Big picture, rates should head lower over the course of the year as there are more catalysts putting downside pressure on them.
Trump Administration Policies: Still no decision from SCOTUS regarding the legality of many of the tariffs implemented in 2025 and now that they are in recess again, we probably won’t get a ruling until later this month at the earliest. Many companies offset most of the tariff costs by reducing staff and raising prices, hence the sticky inflation and layoff announcements. I also believe AI has accelerated some of the layoffs that we are hearing about.
Aggressive immigration enforcement and restrictive visa policies policies have led to significant labor shortages and decreased revenue across several U.S. sectors. Over 1.2 million immigrants left the workforce between January and July 2025 alone, causing a sharp contraction in labor-intensive industries. Some of the sectors that have been hit particularly hard are agriculture, tourism/hospitality, and construction. This is also exacerbating inflation, particularly in housing, groceries, and the food and beverage industry.
Without any significant changes to our current trade and immigration policies, they will continue to put downward pressure on job creation and the economy in general.
If you find yourself with a few minutes of free time during these cold winter days, you should take a look at your pay stub to make sure your deductions and withholdings are up to date and squared away.
I think the following pay stub items should be checked at least annually:
Federal and state status and exemptions – You set these when you complete form W-4 for your employer. These determine how much tax your employer withholds from your pay. You probably should adjust these if your tax returns show a large refund or if you owe a large amount. You can make these changes online with your employer or turn in a revised W-4 to HR.
Deductions – Check that the correct amount is being taken out for your retirement plans and group insurance plans. I have seen too many times where an employee changes their 401k contribution, but it never gets changed in the system. Again, these can typically be changed online on your benefits’ website.
Employer Contributions – Make sure your employer is contributing where they are supposed to. Employer matching for retirement plans and insurance premiums are two of the most common employer contributions that you should verify are correct.
The IRS even has a page on their site that you can use to help you figure out what your withholdings (marital status and exemptions on your W-4) should be based on your current pay stub and previous year’s tax filings. Here’s the link: https://www.irs.gov/paycheck-checkup
The IRS say that the following circumstances warrant a check of your withholdings:
Are a two-income family
Have two or more jobs at the same time
Work a seasonal job or only work part of the year
Claim credits like the child tax credit
Have dependents age 17 or older
Itemized deductions on your returns
Have high income or a complex tax return
Had a large tax refund or tax bill this past year
Now is a good time to review these items because if there are mistakes, there is enough time left in the year to rectify the situation. Also, if you wait until the end of the year, it will be much harder to find the time during the holiday season.
Please comment or send an email if you have any questions.
Starting this year, the landscape of the Affordable Care Act (ACA) has shifted dramatically. With the expiration of temporary enhancements, millions of Americans are now facing a return to the strict “subsidy cliff,” where earning just a dollar over the income limit means losing all premium assistance. So, let’s take a look at the new 2026 rules, including the specific income thresholds that trigger a full repayment “clawback,” and identify some of the ways that you can lower your Modified Adjusted Gross Income (MAGI), maintain essential subsidies, and avoid a massive tax bill.
For 2026, Affordable Care Act (ACA) premium tax credits have reverted to pre-2021 rules following the expiration of temporary enhancements. Subsidies are now generally limited to individuals and families with household incomes between 100% and 400% of the Federal Poverty Level (FPL).
2026 Income Limits for Subsidies
Based on 2025 Federal Poverty Guidelines used for 2026 coverage, the income ranges for eligibility in most states are:
Household Size
Lower Limit (100% FPL)
Upper Limit (400% FPL)
Single Person
$15,650
$62,600
Family of Four
$32,150
$128,600
If the income that you provided on the healthcare.gov (ACA) site falls within the range above, you will receive a healthcare premium subsidy. The amount will vary based on where your income falls within these ranges.
For 2026, the maximum percentage of income you must pay for a benchmark plan is as follows:
100% to 133% FPL: Premiums are limited to approximately 2.1% to 3.14% of your annual income.
300% to 400% FPL: Premiums are capped at approximately 9.96% of your income.
Above 400% FPL: The “subsidy cliff” has returned; households earning even $1 over this limit are generally responsible for 100% of their premiums, with no federal tax credits available.
The subsidy covers the difference between the actual cost of the plan and your required income-based contribution. For example, a family of four earning $45,000 (roughly 140% FPL) might pay about $1,607 annually for their premium in 2026, whereas under previous enhanced rules, they might have paid $0.
In 2026, avoiding an ACA subsidy “clawback” (repaying excess tax credits) is critical because the repayment caps that previously protected low-income households have been eliminated. You are now responsible for repaying the full amount of any excess subsidy received.
The following strategies can help you manage your income and eligibility to prevent a large tax bill:
1. Reduce Your Modified Adjusted Gross Income (MAGI)
Since subsidies are based on your MAGI, lowering this figure can increase your credit or keep you under the “subsidy cliff” ($62,600 for individuals; $128,600 for a family of four).
Maximize Contributions to Pre-Tax Retirement Accounts: Contributions to a Traditional IRA, 401(k), or 403(b) directly reduce your MAGI.
Maximize HSA Contributions: Starting in 2026, all Bronze and catastrophic plans are automatically eligible for a Health Savings Account (HSA). Contributing to your HSA reduces your MAGI dollar-for-dollar.
Harvest Investment Losses: If you have stocks or bonds that have lost value, selling them can offset capital gains and reduce your income by up to an additional $3,000.
2. Strategic Income Management
Update the Marketplace Immediately: Report any raises, new jobs, or household changes (like a child moving out) to HealthCare.gov as soon as possible. The Marketplace will adjust your monthly credit in real-time to match your new income, preventing a lump-sum debt at tax time.
Use Roth Accounts for Extra Cash: If you need more money during the year, withdraw from a Roth IRA or Roth 401(k). Because these are funded with after-tax dollars, qualified withdrawals do not count as income and will not trigger a clawback.
Underestimate with Caution: If you are unsure of your income, you can choose to take only a portion of your subsidy upfront (e.g., take 75% of the credit monthly and claim the remaining 25% as a refund when you file).
3. Timing and “Bunching”
Time Large Income Events: If possible, postpone large capital gains, property sales, or Roth conversions until a year when you are not using ACA coverage or have reached Medicare age.
Make Last-Minute Adjustments: You have until April 15, 2027, to make 2026 contributions to an IRA or HSA. This allows you to calculate your exact 2026 income during tax season and make a final contribution to lower your MAGI and reduce what you owe back to the IRS.
Careful income planning is crucial under the 2026 ACA rules. By maximizing pre-tax contributions, managing income events, and keeping your income information updated with the Marketplace, you can preserve your health insurance subsidies and avoid unexpected tax bills.
Please comment or send an email if you have any questions.
January 1st, Thursday, – New Year’s Days. Stock market is closed.
January 19th, Monday, – Martin Luther King, Jr. Day. Stock market is closed.
Stocks did not stage a Santa Claus rally this time. It was a relatively calm December for the markets and most indices ended flat for the month.
For the month of December, the S&P 500 fell a miniscule -0.23%, well below its average over the last thirty years of 1.20%. This negative performance also broke the index’s streak of seven consecutive months of positive performance. For the year, the index is up about 16.39%, blowing past its 30-year average annual return of 9.95%. It has now been 3 consecutive years of positive double-digit returns, which has happened only three other times since World War II. One of those was right when I started in the business, a 5-year run from 1995 through 1999.
Looking ahead, potential catalysts to move stocks this January include the Federal Open Market Committee (FOMC) meeting on January 28th and the potential SCOTUS decision on the legality of many of the tariffs implemented in 2025. Also, Q4 earnings will start to hit the tape shortly and could shape investors’ expectations for the rest of 2026.
Historically, especially this century, January has contributed very little to the performance of the S&P 500 index’s annual return, averaging just +0.28% over the last thirty years. We could see some selling this month if investors elect to capture some of their big gains from the last few years.
Take a look at the Outlook section below to see what events could move the markets over the short term.
Bond prices were relatively flat again in December, reflecting in the fact that the FOMC’s rate cut this past month was already priced into the market.
The 10-year US Treasury note yield finished higher in December, settling at 4.16%, higher than the 4.02% yield that it was at the beginning of the month. The 30-year bond yield closed out the month at 4.84%, 17 basis points higher than a month ago.
One important indicator that I monitor that is giving me optimism about the economy and corporate health is the high-yield credit spread. This spread is a vital financial metric that measures the difference in yield between risk-free U.S. Treasuries and high-risk “junk” (non-investment grade) bonds of similar maturity. Currently, the high yield spread is at a historically low level, 2.87%, indicating strong investor confidence and a high appetite for risk. This value is significantly below its long-term average of approximately 5.22%. For historical context, spreads reached historical lows around 2.41% in June 2007 and a record high of 21.82% in December 2008, the start of the Great Financial Crisis.
Bond investors will also be listening to any comments coming out of the Fed prior to their meeting on January 28th to get a feel for which way they are leaning in the direction of interest rates. Their last meeting resulted in a tight decision between no rate decreases and a 25-basis point cut. This indicates that they might be pausing their rate cuts for some time. Labor statistics will also be closely watched as well as the SCOTUS ruling on the legality of several tariff policies, which may be announced this month. As such, January could be a very eventful month in the credit markets.
I still like bonds with at least a 12-month maturity but plan on holding them until they mature.
Savings rates moved very little in December as we await the latest Fed rate cut to work its way into the various interest rates applicable to savings, CDs, and MMAs. For savers and risk-averse investors, the rates are apparently still good enough to keep total deposits near historic highs.
Account Type
Average Rate
Highest Rate
Money Market Account
0.49%
4.25%
High-Yield Savings Account
0.62%
5.00%
CD Term
Average Rate
Highest Rate
1-Year
1.80%
4.84%
3-Year
1.59%
4.14%
5-Year
1.62%
4.27%
There is about $20 trillion in total domestic deposits. That is a massive amount of cash that is sitting on the sidelines. If interest rates for these accounts continue to drop, we could start to see some of this cash flow to corporate bonds with higher yields as well as dividend-paying stocks. This is a trend to look for over the next several months.
For now, CDs and MMAs are still a great place to put your cash and your emergency funds. Knowing this, it makes sense in most situations to put cash that you don’t immediately need into CDs with up to 2-year maturities. For emergency cash, stick to high yielding money market and savings accounts, of which the best are yielding about 5.0%. As always, keep the total under $250,000 per person at any one bank to ensure you are fully covered by the FDIC.
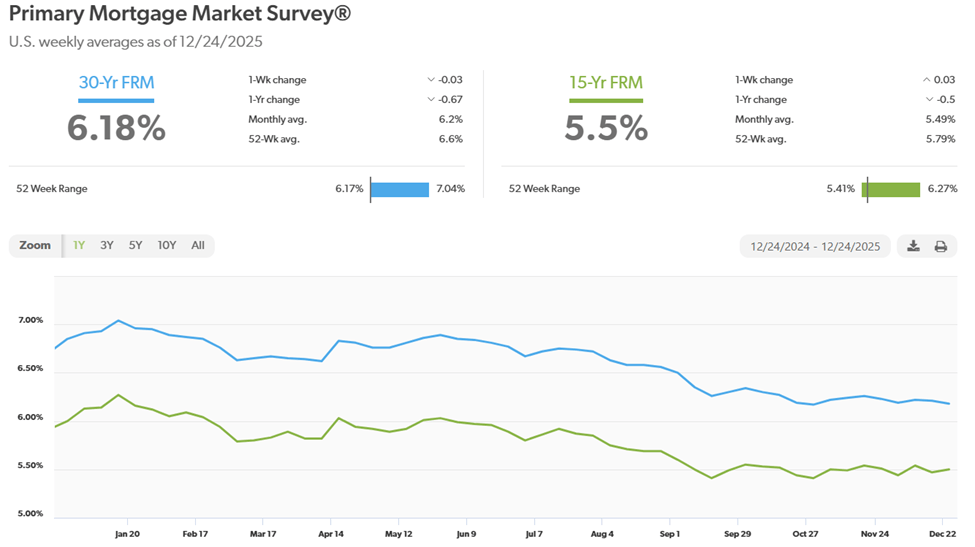
Mortgage rates resumed their slow drift lower in December after a brief pause in November. This movement was primarily due to the latest Fed rate cut in early December. Rates are expected to flatten out in the 6% neighborhood over the next few months, with the major catalyst coming from the Federal Reserve’s next FOMC meeting at the end of January. Regarding the housing market, it has shifted significantly toward a buyer’s market, with the gap between sellers and buyers reaching historic levels: sellers outnumber buyers by 37.2%, the largest imbalance since 2013. For condos, it is even more imbalanced with 83% more condo sellers than buyers nationwide. This disparity could put a floor under mortgage rates once it starts to normalize.
The 30-year fixed rate finished the month at 6.18%, 5 bps lower than last month, near its low for 2025.
Here is a look at the one-year chart of the 15- and 30-year mortgage rates from Freddie Mac.
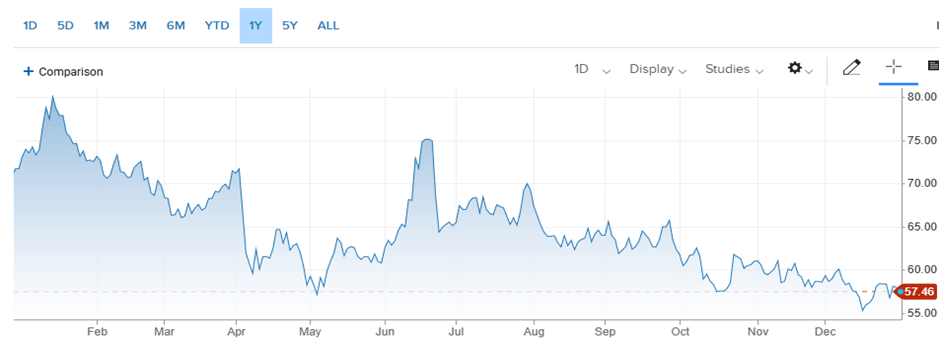
Oil prices experienced more downward pressure in December due to a persistent global supply surplus and moderating demand growth, despite some temporary price spikes driven by geopolitical risks. It was surprising to still see oil prices drop despite OPEC+ pausing output hikes, the U.S. confiscating oil tankers coming out of Venezuela, and Ukraine continuing to disrupt Russia’s energy infrastructure.
For the month of December, the price for a barrel of West Texas Intermediate (WTI) oil started at $58.55 and ended at about 57.46, down about $1.09 from the beginning of the month. For the year, it ended down almost 20%, its steepest drop since 2020 (pandemic).
Looking ahead, I still see prices hovering around the $60 area for the next few months. That said, with prices down in the $50s, we will see less new well drilling and may even see some drillers stop pumping because it is no longer profitable, particularly for the shale drillers.
Here’s a look at the one-year chart for U.S. oil:
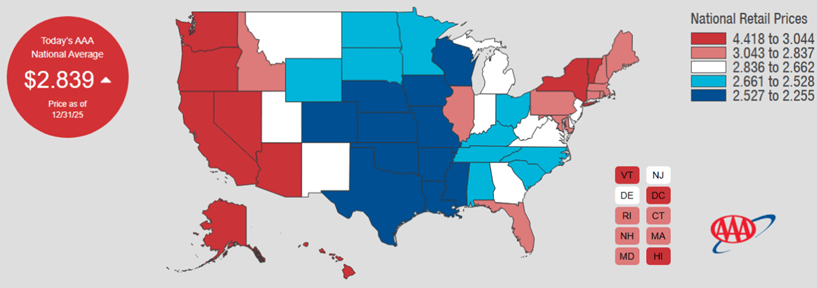
Gasoline prices mirrored the drop in oil and headed lower in December. It was a significant decrease, dropping 17 cents from the previous month. We should continue to see prices moving lower, mostly due to increased oil supply as well as slowing demand (seasonal but also economic). Oklahoma had the cheapest gas this past month, checking in at $2.26 a gallon. Hawaii has the most expensive gasoline at $4.42 per gallon. FYI, a year ago, we were paying $3.04.
Check out the prices at the pump in your area: AAA Gas Prices.
Outlook
Events on the horizon that could move the markets in the near term:
Fed & Inflation: As expected, the FOMC cut short-term interest rates by another 25 basis points at their December meeting. They are now in a wait-and-see strategy after three consecutive rate cuts, totaling 75 bps. Their statements confirmed that they are more worried about the downside risks to employment than inflation and that is reflected in the most recent economic data.
The interest rate picture should clear up before the Fed meets again at the end of this month. There will be lots of data coming out over the next few weeks that should provide more clarity. One area that I’ll be paying attention to is the employment numbers and if companies announce more layoffs when they report their 2025 earnings over the next few months. If we start to hear words like restructuring, streamlining, and cost efficiencies in companies’ conference calls, that might bode well for Wall Street, but it won’t be good news for Main Street.
Trump Administration Policies: Trade and immigration policies wreaked havoc on American businesses, both big and small in 2025. Corporate bankruptcies, mostly small businesses, reached levels not seen since 2010. With regards to Immigration policy, it is probably not going to change until there is a change in the administration. For trade policy, there could be some news out relatively soon. SCOTUS is expected to hand down a ruling this month on the legality of many of the tariffs put in place last year. If they are deemed illegal and tariffs refunded, it will be a big win for small businesses and may even provide a boost for the markets. If SCOTUS rules in favor of the tariffs, look for bankruptcies, layoffs, and consumer prices to continue to move higher. This will be a market mover when it comes out, regardless of the decision.
Artificial Intelligence: In 2026, AI is expected to transition from a reactive tool to an autonomous teammate, with a significant shift toward agentic systems that perform multi-step workflows independently. Among other things, this will cause a shift in the workforce. The labor market may trend toward an “hourglass” shape, with high demand for senior strategic leaders and entry-level “AI orchestrators,” while traditional middle-tier roles that focus on routine analysis are compressed, aka job losses. The timeline is uncertain but it’s going to happen. That said, AI is a transformative force that is influencing all sectors of the global economy as we speak and will be the major market mover for years to come, in my opinion. As investors, we should be focusing on not just the providers of AI infrastructure and components, but also on the companies that can utilize AI to maximize growth and profitability.