

Calendar Notes
January 1st, Thursday, – New Year’s Days. Stock market is closed.
January 19th, Monday, – Martin Luther King, Jr. Day. Stock market is closed.
Stocks did not stage a Santa Claus rally this time. It was a relatively calm December for the markets and most indices ended flat for the month.
For the month of December, the S&P 500 fell a miniscule -0.23%, well below its average over the last thirty years of 1.20%. This negative performance also broke the index’s streak of seven consecutive months of positive performance. For the year, the index is up about 16.39%, blowing past its 30-year average annual return of 9.95%. It has now been 3 consecutive years of positive double-digit returns, which has happened only three other times since World War II. One of those was right when I started in the business, a 5-year run from 1995 through 1999.
Looking ahead, potential catalysts to move stocks this January include the Federal Open Market Committee (FOMC) meeting on January 28th and the potential SCOTUS decision on the legality of many of the tariffs implemented in 2025. Also, Q4 earnings will start to hit the tape shortly and could shape investors’ expectations for the rest of 2026.
Historically, especially this century, January has contributed very little to the performance of the S&P 500 index’s annual return, averaging just +0.28% over the last thirty years. We could see some selling this month if investors elect to capture some of their big gains from the last few years.
Take a look at the Outlook section below to see what events could move the markets over the short term.
Bond prices were relatively flat again in December, reflecting in the fact that the FOMC’s rate cut this past month was already priced into the market.
The 10-year US Treasury note yield finished higher in December, settling at 4.16%, higher than the 4.02% yield that it was at the beginning of the month. The 30-year bond yield closed out the month at 4.84%, 17 basis points higher than a month ago.
One important indicator that I monitor that is giving me optimism about the economy and corporate health is the high-yield credit spread. This spread is a vital financial metric that measures the difference in yield between risk-free U.S. Treasuries and high-risk “junk” (non-investment grade) bonds of similar maturity. Currently, the high yield spread is at a historically low level, 2.87%, indicating strong investor confidence and a high appetite for risk. This value is significantly below its long-term average of approximately 5.22%. For historical context, spreads reached historical lows around 2.41% in June 2007 and a record high of 21.82% in December 2008, the start of the Great Financial Crisis.
Bond investors will also be listening to any comments coming out of the Fed prior to their meeting on January 28th to get a feel for which way they are leaning in the direction of interest rates. Their last meeting resulted in a tight decision between no rate decreases and a 25-basis point cut. This indicates that they might be pausing their rate cuts for some time. Labor statistics will also be closely watched as well as the SCOTUS ruling on the legality of several tariff policies, which may be announced this month. As such, January could be a very eventful month in the credit markets.
I still like bonds with at least a 12-month maturity but plan on holding them until they mature.
Savings rates moved very little in December as we await the latest Fed rate cut to work its way into the various interest rates applicable to savings, CDs, and MMAs. For savers and risk-averse investors, the rates are apparently still good enough to keep total deposits near historic highs.
| Account Type | Average Rate | Highest Rate |
| Money Market Account | 0.49% | 4.25% |
| High-Yield Savings Account | 0.62% | 5.00% |
| CD Term | Average Rate | Highest Rate | |
| 1-Year | 1.80% | 4.84% | |
| 3-Year | 1.59% | 4.14% | |
| 5-Year | 1.62% | 4.27% |
There is about $20 trillion in total domestic deposits. That is a massive amount of cash that is sitting on the sidelines. If interest rates for these accounts continue to drop, we could start to see some of this cash flow to corporate bonds with higher yields as well as dividend-paying stocks. This is a trend to look for over the next several months.
For now, CDs and MMAs are still a great place to put your cash and your emergency funds. Knowing this, it makes sense in most situations to put cash that you don’t immediately need into CDs with up to 2-year maturities. For emergency cash, stick to high yielding money market and savings accounts, of which the best are yielding about 5.0%. As always, keep the total under $250,000 per person at any one bank to ensure you are fully covered by the FDIC.
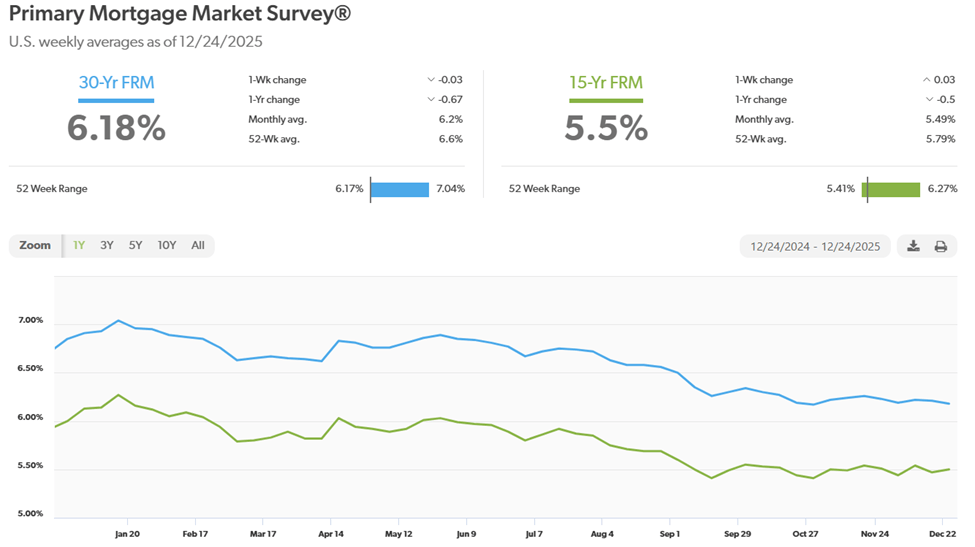
Mortgage rates resumed their slow drift lower in December after a brief pause in November. This movement was primarily due to the latest Fed rate cut in early December. Rates are expected to flatten out in the 6% neighborhood over the next few months, with the major catalyst coming from the Federal Reserve’s next FOMC meeting at the end of January. Regarding the housing market, it has shifted significantly toward a buyer’s market, with the gap between sellers and buyers reaching historic levels: sellers outnumber buyers by 37.2%, the largest imbalance since 2013. For condos, it is even more imbalanced with 83% more condo sellers than buyers nationwide. This disparity could put a floor under mortgage rates once it starts to normalize.
The 30-year fixed rate finished the month at 6.18%, 5 bps lower than last month, near its low for 2025.
Here is a look at the one-year chart of the 15- and 30-year mortgage rates from Freddie Mac.
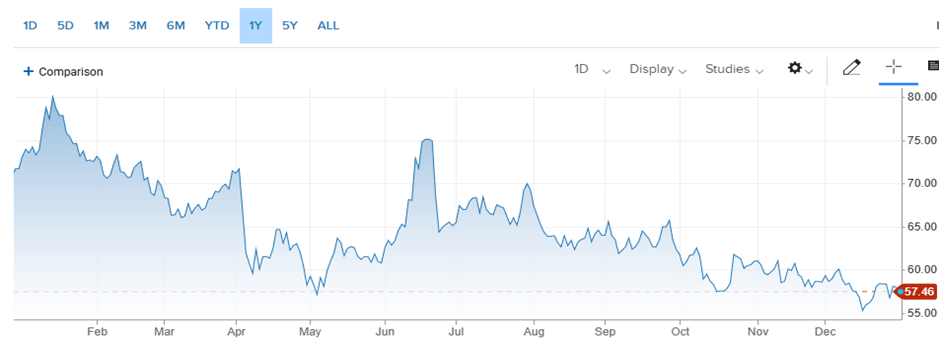
Oil prices experienced more downward pressure in December due to a persistent global supply surplus and moderating demand growth, despite some temporary price spikes driven by geopolitical risks. It was surprising to still see oil prices drop despite OPEC+ pausing output hikes, the U.S. confiscating oil tankers coming out of Venezuela, and Ukraine continuing to disrupt Russia’s energy infrastructure.
For the month of December, the price for a barrel of West Texas Intermediate (WTI) oil started at $58.55 and ended at about 57.46, down about $1.09 from the beginning of the month. For the year, it ended down almost 20%, its steepest drop since 2020 (pandemic).
Looking ahead, I still see prices hovering around the $60 area for the next few months. That said, with prices down in the $50s, we will see less new well drilling and may even see some drillers stop pumping because it is no longer profitable, particularly for the shale drillers.
Here’s a look at the one-year chart for U.S. oil:
Gasoline prices mirrored the drop in oil and headed lower in December. It was a significant decrease, dropping 17 cents from the previous month. We should continue to see prices moving lower, mostly due to increased oil supply as well as slowing demand (seasonal but also economic). Oklahoma had the cheapest gas this past month, checking in at $2.26 a gallon. Hawaii has the most expensive gasoline at $4.42 per gallon. FYI, a year ago, we were paying $3.04.
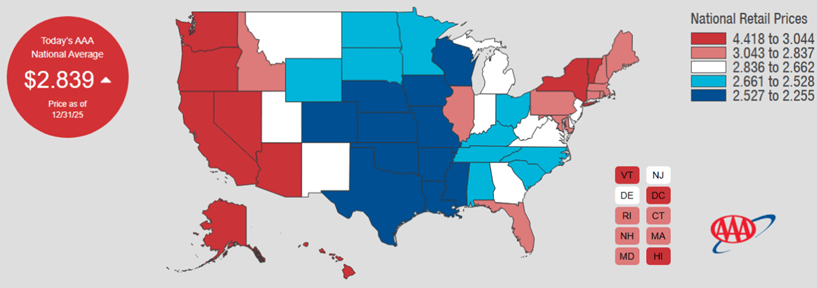
Check out the prices at the pump in your area: AAA Gas Prices.
Outlook
Events on the horizon that could move the markets in the near term:
- Fed & Inflation: As expected, the FOMC cut short-term interest rates by another 25 basis points at their December meeting. They are now in a wait-and-see strategy after three consecutive rate cuts, totaling 75 bps. Their statements confirmed that they are more worried about the downside risks to employment than inflation and that is reflected in the most recent economic data.
The interest rate picture should clear up before the Fed meets again at the end of this month. There will be lots of data coming out over the next few weeks that should provide more clarity. One area that I’ll be paying attention to is the employment numbers and if companies announce more layoffs when they report their 2025 earnings over the next few months. If we start to hear words like restructuring, streamlining, and cost efficiencies in companies’ conference calls, that might bode well for Wall Street, but it won’t be good news for Main Street.
- Trump Administration Policies: Trade and immigration policies wreaked havoc on American businesses, both big and small in 2025. Corporate bankruptcies, mostly small businesses, reached levels not seen since 2010. With regards to Immigration policy, it is probably not going to change until there is a change in the administration. For trade policy, there could be some news out relatively soon. SCOTUS is expected to hand down a ruling this month on the legality of many of the tariffs put in place last year. If they are deemed illegal and tariffs refunded, it will be a big win for small businesses and may even provide a boost for the markets. If SCOTUS rules in favor of the tariffs, look for bankruptcies, layoffs, and consumer prices to continue to move higher. This will be a market mover when it comes out, regardless of the decision.
- Artificial Intelligence: In 2026, AI is expected to transition from a reactive tool to an autonomous teammate, with a significant shift toward agentic systems that perform multi-step workflows independently. Among other things, this will cause a shift in the workforce. The labor market may trend toward an “hourglass” shape, with high demand for senior strategic leaders and entry-level “AI orchestrators,” while traditional middle-tier roles that focus on routine analysis are compressed, aka job losses. The timeline is uncertain but it’s going to happen. That said, AI is a transformative force that is influencing all sectors of the global economy as we speak and will be the major market mover for years to come, in my opinion. As investors, we should be focusing on not just the providers of AI infrastructure and components, but also on the companies that can utilize AI to maximize growth and profitability.
Joe Baker, CFP®
Baker Asset Management, LLC
joebaker@bakerassetmanagement.com

