
Calendar Notes
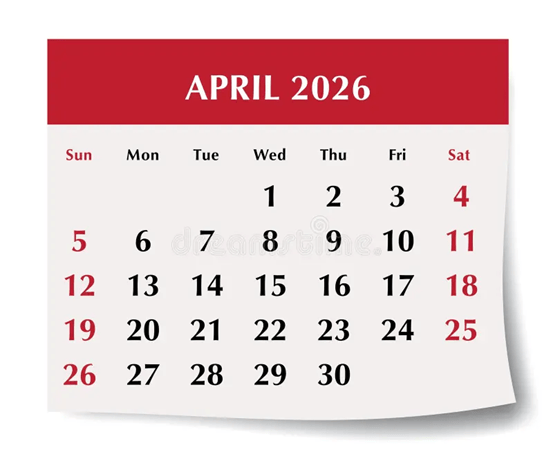
- April 3rd, Friday – Good Friday. Stock market is closed.
- April 15th, Wednesday – Federal taxes due.
Stocks faced a challenging month, to say the least, as investors grappled with the significant global economic shock triggered by the closure of the Strait of Hormuz as the Iran war intensified. The world found out the hard way how much the global economy depends on this waterway. Other than energy stocks and cash, there was no place to hide. Even bonds took a hit as inflation expectations grew.
For the month of March, the S&P 500 finished at a loss of more than 5.00%, well below its historical average over the last thirty years of +1.80%. For the year, the index is now down nearly 5.00%.
Looking ahead, potential catalysts to move stocks this April are the start of Q1 earnings announcements and the hope that the Iran war is coming to an end. There is also the usual economic data coming out later this week. Finally, the Fed meets at the end of the month, but expectations are for no change in interest rates, so don’t expect any market volatility following this meeting.
Historically, the performance of the S&P 500 index in April has been outstanding. Over the last thirty years, it has had an impressive +2.40% return on average. If the war ends within the first two weeks of April, I can see the index beating this number. If it continues, all bets are off.
Take a look at the Outlook section below to see what events could move the markets over the short term.
Bond prices took a beating as well in March, as yields spiked across the entire spectrum of the bond universe due to inflation fears and global economic uncertainty. Renewed expectations of higher inflation crushed the safe-haven appeal of Treasuries, while rising economic uncertainty caused the prices of riskier corporate and junk bonds to crater. The massive inflationary shock from the closing of the Strait of Hormuz was seen as forcing the Federal Reserve to be even more aggressive in raising interest rates.
The 10-year US Treasury note yield finished higher in March, settling at 4.32%, well above the 3.95% yield that it was at the beginning of the month. The 30-year bond yield closed out the month at 4.92%, 30 basis points higher than a month ago.
Checking the current high yield credit spread (HYCS) of 3.46%, it has jumped significantly since the beginning of February (2.81%) but is still well below the long-term average of 5.20%. This suggests that while the market is nervous, it is not yet pricing in a widespread wave of corporate defaults or a deep systemic recession. I’m keeping an eye on this metric because if it gets above 5%, historically this has not been a good sign for the markets.
Bond investors will be looking ahead to the economic data for March coming out shortly for signs of an economic slowdown. The FOMC meeting at the end of April should just be more of the same – keep rates unchanged and continue to monitor data.
I still like bonds with at least a 12-month maturity but plan on holding them until they mature.
Savings rates made some minor adjustments to their averages this past month. Still, as you can see in the first table below, there is a massive disparity between “traditional” brick-and-mortar banks (averaging around 0.45%) and online high-yield options. By moving cash from a standard savings account to a top-tier HYSA, you are effectively earning 7x to 10x more interest. That is certainly worth the time it would take for you to do a little research and make the move. Regarding CDs, the gap between short-term and long-term yields has narrowed significantly. In fact, you’ll notice that 1-year and 5-year rates are nearly identical at the top end, which is a classic sign of a market anticipating lower rates in the future. For savers and risk-averse investors, the rates still haven’t dropped enough to look elsewhere to park their money. However, some investors may look to shift some of their money market assets to high-yield bonds and/or dividend-paying blue-chip stocks as an alternative if rates drop
| Account Type | Average Rate | Highest Rate |
| Money Market Account | 0.43% | 4.10% |
| High-Yield Savings Account | 0.50% | 4.21% |
| CD Term | Average Rate | Highest Rate | |
| 1-Year | 1.75% | 4.50% | |
| 3-Year | 1.48% | 4.10% | |
| 5-Year | 1.53% | 4.50% |
For now, CDs and MMAs are still a great place to put your cash and your emergency funds. Knowing this, it makes sense in most situations to put cash that you don’t immediately need into CDs with up to 2-year maturities. For emergency cash, stick to high yielding money market and savings accounts, of which the best are yielding about 4.0%. As always, keep the total under $250,000 per person at any one bank to ensure you are fully covered by the FDIC.
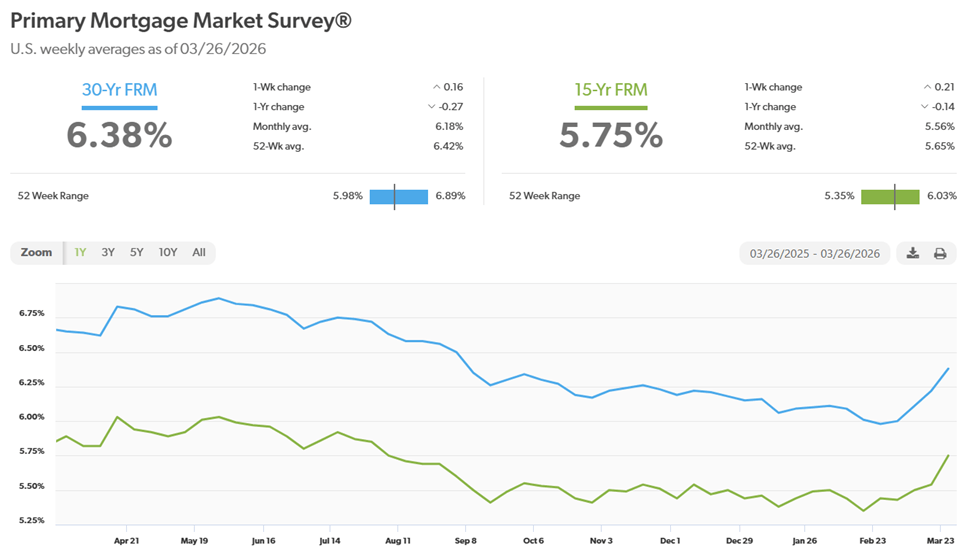
Mortgage rates rose significantly this past March, with the 30-year fixed rate climbing well over 6% to a six-month high. The increase was driven mainly by the Iran invasion which drove many raw material prices higher, most notably oil, fertilizer, and aluminum.
The 30-year fixed rate finished the month at 6.38%, 40 bps higher than last month. Looking ahead, rates could drift higher if the war continues to shut down the Strait of Hormuz, as this will continue to increase inflation.
Here is a look at the one-year chart of the 15- and 30-year mortgage rates from Freddie Mac.
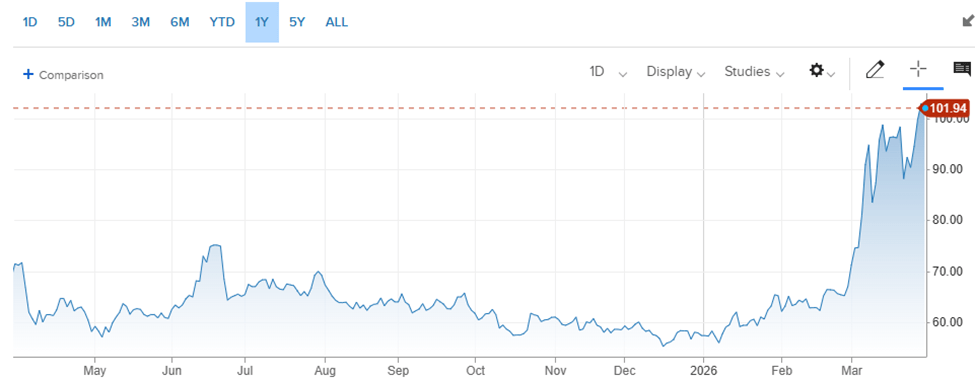
Oil prices had a very volatile month in March, driven almost entirely by the US/Israel attack on Iran that threatened a significant portion of the global oil supply. In fact, Brent crude oil price had its steepest monthly rise in recorded history.
For the month of March, the price for a barrel of West Texas Intermediate (WTI) oil started at $67.02 and ended at $101.94, up nearly $35 for the month. That is unbelievable. For the year, it is now up $44.52 a barrel, almost 78%.
Looking ahead, this war could be coming to an end sooner than later, which is great news for everybody. It will take some time to get the oil flow through the Strait of Hormuz back up to its pre-war rate, but prices should start to come down much sooner. Regardless, with diesel prices as high as they are now, expect shipping surcharges across the economy for a while.
Here’s a look at the one-year chart for U.S. oil:
Gasoline prices experienced an extreme, historic surge in March, directly reflecting the massive volatility in global crude oil markets. The national average price broke through the $4.00 mark for the first time since August 2022. Even worse has been the surge in diesel prices. Even if the war ends tomorrow, it will take a while before they can get pre-war supply flow back. Besides the Iran war, seasonal demand could add further upward pressure to prices at the pump this spring. Oklahoma has the cheapest gas currently, checking in at $3.27 a gallon. California has the most expensive gasoline at $5.89 per gallon. FYI, a year ago, we were paying $3.17.
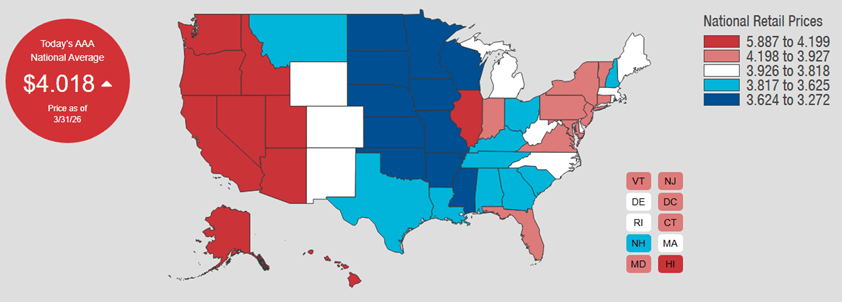
Check out the prices at the pump in your area: AAA Gas Prices.
Outlook
Events on the horizon that could move the markets in the near term:
- Fed, Rates, & Inflation: The Federal Open Market Committee (FOMC) met in mid-March and held rates steady once again. They significantly scaled back expectations for rate cuts once we attacked Iran. Now, the majority of FOMC members anticipate either one cut or no cuts at all this year. The worry of stagflation, high inflation coupled with increasing unemployment, has once again hurt the chances of the Fed lowering interest rates anytime soon.
Regarding jobs and wage growth, employment data has been volatile with so many revisions each month. Wages have remained a resilient part of the economy, consistently growing at a pace that is slightly outpacing inflation. This is a nice bright spot.
There are no expectations of any changes to the Fed’s stance on interest rates when they meet at the end of April.
- Trump Administration Policies: There’s so much chaos coming out of DC that the trade and immigration policies no longer hog the headlines. Still, there has been a lot of activity on these fronts.
Trade – Over 3,000 companies have sued the government seeking refunds on the illegally imposed tariffs. No refunds have been issued as of yet. Also, the administration added a blanket 10% tariff on everything coming into the U.S. but that is only valid for 150 days. Expect the government to drag their feet on issuing refunds.
Immigration – On the immigration front, the administration’s restrictive policies continue to significantly impact the U.S. economy, primarily through labor supply shocks in critical sectors. This has resulted in labor shortages and higher prices, particularly in agriculture/food supply, construction, and the restaurant/leisure sectors. Also, for the first time in over 50 years, net migration was estimated to be negative in 2025, which will directly weaken consumer spending by up to $110 billion through 2026, according to the Brookings Institution. That’s a negative catalyst for the markets for the foreseeable future.
- Iran Conflict: As this war stretches into its second month, its effect on the global economy continues to worsen. The closure of the Strait of Hormuz has created a self-inflicted economic wound. With twenty percent of the world’s oil and natural gas supplies effectively halted as well as fertilizer supplies cut off, the world is quickly slipping into a global recession. Food and fuel supplies across the planet are being depleted and rationing has begun. If the war continues, expect to see inflation accelerate and the energy shock to devastate the global economy.
Although this is a self-inflicted injury like the tariff and immigration chaos, this will not be quick or easy to recover from once we get out. It will take months and even years to repair the damage that the war has done to the industrial infrastructure in the region, and that goes way beyond the fossil fuel industries – think aluminum, fertilizer, plastics, and chip fabrication to name a few sectors. Also, our already damaged relationships with long-time allies due to trade policies are now in serious jeopardy because of this war. So, the sooner we get out of this mess, the better. I will add that this downturn in the stock market could be a buying opportunity if your holding period is more than two years.
Joe Baker, CFP®
Baker Asset Management, LLC
joebaker@bakerassetmanagement.com

