If you find yourself with a few minutes of free time during these cold winter days, you should take a look at your pay stub to make sure your deductions and withholdings are up to date and squared away.
I think the following pay stub items should be checked at least annually:
Federal and state status and exemptions – You set these when you complete form W-4 for your employer. These determine how much tax your employer withholds from your pay. You probably should adjust these if your tax returns show a large refund or if you owe a large amount. You can make these changes online with your employer or turn in a revised W-4 to HR.
Deductions – Check that the correct amount is being taken out for your retirement plans and group insurance plans. I have seen too many times where an employee changes their 401k contribution, but it never gets changed in the system. Again, these can typically be changed online on your benefits’ website.
Employer Contributions – Make sure your employer is contributing where they are supposed to. Employer matching for retirement plans and insurance premiums are two of the most common employer contributions that you should verify are correct.
The IRS even has a page on their site that you can use to help you figure out what your withholdings (marital status and exemptions on your W-4) should be based on your current pay stub and previous year’s tax filings. Here’s the link: https://www.irs.gov/paycheck-checkup
The IRS say that the following circumstances warrant a check of your withholdings:
Are a two-income family
Have two or more jobs at the same time
Work a seasonal job or only work part of the year
Claim credits like the child tax credit
Have dependents age 17 or older
Itemized deductions on your returns
Have high income or a complex tax return
Had a large tax refund or tax bill this past year
Now is a good time to review these items because if there are mistakes, there is enough time left in the year to rectify the situation. Also, if you wait until the end of the year, it will be much harder to find the time during the holiday season.
Please comment or send an email if you have any questions.
Starting this year, the landscape of the Affordable Care Act (ACA) has shifted dramatically. With the expiration of temporary enhancements, millions of Americans are now facing a return to the strict “subsidy cliff,” where earning just a dollar over the income limit means losing all premium assistance. So, let’s take a look at the new 2026 rules, including the specific income thresholds that trigger a full repayment “clawback,” and identify some of the ways that you can lower your Modified Adjusted Gross Income (MAGI), maintain essential subsidies, and avoid a massive tax bill.
For 2026, Affordable Care Act (ACA) premium tax credits have reverted to pre-2021 rules following the expiration of temporary enhancements. Subsidies are now generally limited to individuals and families with household incomes between 100% and 400% of the Federal Poverty Level (FPL).
2026 Income Limits for Subsidies
Based on 2025 Federal Poverty Guidelines used for 2026 coverage, the income ranges for eligibility in most states are:
Household Size
Lower Limit (100% FPL)
Upper Limit (400% FPL)
Single Person
$15,650
$62,600
Family of Four
$32,150
$128,600
If the income that you provided on the healthcare.gov (ACA) site falls within the range above, you will receive a healthcare premium subsidy. The amount will vary based on where your income falls within these ranges.
For 2026, the maximum percentage of income you must pay for a benchmark plan is as follows:
100% to 133% FPL: Premiums are limited to approximately 2.1% to 3.14% of your annual income.
300% to 400% FPL: Premiums are capped at approximately 9.96% of your income.
Above 400% FPL: The “subsidy cliff” has returned; households earning even $1 over this limit are generally responsible for 100% of their premiums, with no federal tax credits available.
The subsidy covers the difference between the actual cost of the plan and your required income-based contribution. For example, a family of four earning $45,000 (roughly 140% FPL) might pay about $1,607 annually for their premium in 2026, whereas under previous enhanced rules, they might have paid $0.
In 2026, avoiding an ACA subsidy “clawback” (repaying excess tax credits) is critical because the repayment caps that previously protected low-income households have been eliminated. You are now responsible for repaying the full amount of any excess subsidy received.
The following strategies can help you manage your income and eligibility to prevent a large tax bill:
1. Reduce Your Modified Adjusted Gross Income (MAGI)
Since subsidies are based on your MAGI, lowering this figure can increase your credit or keep you under the “subsidy cliff” ($62,600 for individuals; $128,600 for a family of four).
Maximize Contributions to Pre-Tax Retirement Accounts: Contributions to a Traditional IRA, 401(k), or 403(b) directly reduce your MAGI.
Maximize HSA Contributions: Starting in 2026, all Bronze and catastrophic plans are automatically eligible for a Health Savings Account (HSA). Contributing to your HSA reduces your MAGI dollar-for-dollar.
Harvest Investment Losses: If you have stocks or bonds that have lost value, selling them can offset capital gains and reduce your income by up to an additional $3,000.
2. Strategic Income Management
Update the Marketplace Immediately: Report any raises, new jobs, or household changes (like a child moving out) to HealthCare.gov as soon as possible. The Marketplace will adjust your monthly credit in real-time to match your new income, preventing a lump-sum debt at tax time.
Use Roth Accounts for Extra Cash: If you need more money during the year, withdraw from a Roth IRA or Roth 401(k). Because these are funded with after-tax dollars, qualified withdrawals do not count as income and will not trigger a clawback.
Underestimate with Caution: If you are unsure of your income, you can choose to take only a portion of your subsidy upfront (e.g., take 75% of the credit monthly and claim the remaining 25% as a refund when you file).
3. Timing and “Bunching”
Time Large Income Events: If possible, postpone large capital gains, property sales, or Roth conversions until a year when you are not using ACA coverage or have reached Medicare age.
Make Last-Minute Adjustments: You have until April 15, 2027, to make 2026 contributions to an IRA or HSA. This allows you to calculate your exact 2026 income during tax season and make a final contribution to lower your MAGI and reduce what you owe back to the IRS.
Careful income planning is crucial under the 2026 ACA rules. By maximizing pre-tax contributions, managing income events, and keeping your income information updated with the Marketplace, you can preserve your health insurance subsidies and avoid unexpected tax bills.
Please comment or send an email if you have any questions.
Starting in 2025, a new temporary federal tax break known as the “Senior Bonus Deduction “is available to taxpayers aged 65 and older. Enacted under the One Big Beautiful Bill Act (OBBBA), this provision is designed to provide additional tax relief through the 2028 tax year.
Key Features of the 2025 Senior Deduction
Deduction Amount: Eligible individuals can deduct up to $6,000 from their taxable income.
Married Couples: If both spouses are 65 or older and file a joint return, they can claim a combined deduction of $12,000.
“Stackable” Benefit: This deduction is in addition to the regular standard deduction and the existing “additional standard deduction” for seniors.
Accessibility: You can claim this deduction regardless of whether you take the standard deduction or itemize your deductions.
Eligibility and Income Limits
The full deduction is only available to those under specific income thresholds based on their Modified Adjusted Gross Income (MAGI):
Filing Status
Full Deduction Income Limit
Phase-Out Range
Single / Head of Household
Up to $75,000
$75,001 – $175,000
Married Filing Jointly
Up to $150,000
$150,001 – $250,000
Phase-Out Rule: For every $1 your MAGI exceeds the limit, the deduction is reduced by 6 cents until it reaches zero.
Age Requirement: You must be 65 or older by December 31, 2025.
Exclusion: The deduction is not available to those who use the “Married Filing Separately” status.
Impact on Social Security
While often discussed as a “No Tax on Social Security” measure, the law does not technically eliminate federal taxes on Social Security benefits. Instead, the $6,000 deduction serves to lower your overall taxable income, which for many seniors with modest incomes effectively offsets the portion of their Social Security that would have been taxed.
Maximum Combined Deductions for 2025
For a senior taking the standard deduction, the total amount of income sheltered from federal tax in 2025 could reach:
Single (65+):$23,750 ($15,750 base + $2,000 age-based + $6,000 new bonus).
Married (Both 65+):$46,700 ($31,500 base + $3,200 age-based + $12,000 new bonus).
Please comment or send an email if you have any questions.
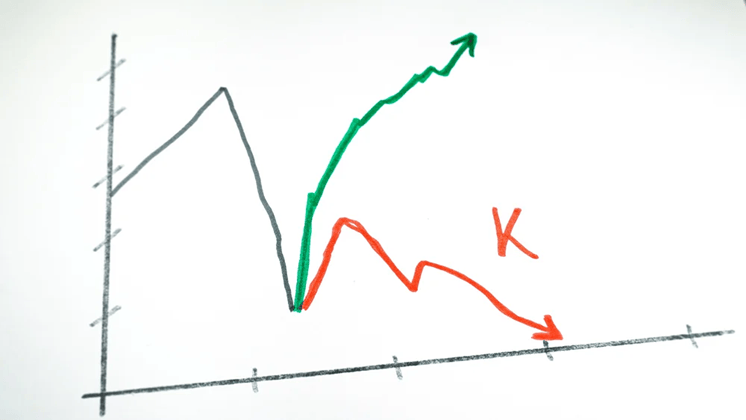
A K-shaped economy describes a situation where, following an economic downturn (pandemic), different parts of the economy recover at vastly different rates, resembling the two legs of the letter “K”. The key characteristic is the widening gap between the wealthy, who see their fortunes rise, and lower-income individuals and some industries, who continue to struggle. Looking back, this started shortly after the pandemic shutdown and the divergence between the upper- and lower-income legs became more evident once the federal government stopped the covid relief payments.
Let’s break it down.
Pros of the K-Shaped Economy (The Upper Leg)
The upper leg of the “K” highlights robust growth in certain areas, which can benefit the overall economy in specific ways:
Innovation and Productivity: Sectors that thrive, often driven by technology and large-scale investment, experience rapid innovation and high productivity. This leads to strong corporate profits and stock market performance.
Targeted Investment: The success of leading industries attracts significant investment, which further fuels growth in those areas (e.g., AI infrastructure and data centers).
Economic Resilience (for some): High-income households benefit from appreciating assets (stocks, real estate) and can maintain high consumer spending, which props up a significant portion of the overall economy.
Examples of the Upper Leg:
Technology Companies: Firms involved in software, artificial intelligence, and cloud computing (e.g., the “Magnificent 7” tech stocks) have seen immense revenue and stock price growth.
Wealthy Households: Individuals with significant financial investments see their net worth climb due to strong market performance and asset appreciation.
Premium Goods/Services: Companies selling high-end products, like luxury cars or premium airline seating, experience strong demand from affluent consumers.
High-skill Professionals: These individuals often maintain job security and can benefit from remote work flexibility and rising wages.
Cons of the K-Shaped Economy (The Lower Leg)
The lower leg reveals significant challenges, primarily centered around growing disparity and economic strain:
Widening Inequality: The most significant downside is the exacerbation of the gap between the rich and poor, leading to a less equitable society.
Financial Strain: Lower-income individuals face immense pressure from stagnant wages, high inflation, surging debt, and rising costs for essential goods like housing and groceries.
Unsustainable Growth: An economy propelled largely by the wealthiest 10% (who account for about half of all spending) may not be sustainable long-term. If the struggling majority cuts back spending significantly due to financial distress, it could pull the entire economy into a recession.
Policymaking Challenges: The K-shape makes it difficult for policymakers to implement broad stimulus actions, as measures that help the struggling lower leg (e.g., low interest rates) might overheat the booming upper leg, and vice versa.
Examples of the Downward Leg:
Service & Hospitality Industries: Businesses like restaurants and hotels have struggled with recovery, job losses, and revenue drops.
Lower-Income Households: This group faces increasing debt, stagnant real wage growth, and higher rates of loan delinquencies.
Younger Generations: This group often face greater challenges, grappling with student loans and high costs for necessities like housing and groceries.
Small Businesses: Many small, brick-and-mortar retailers and other local firms have been hit hard, lacking the capital and digital infrastructure of larger corporations.
It is also important to note that the current administration’s trade policies, particularly the tariffs, have made this situation so much worse for lower income households and small businesses.
To summarize, the K-shaped economy creates a significant increase in wealth inequality. While overall economic indicators like GDP or the stock market may appear strong, they don’t tell the full story, as many people are left behind. This divergence can create an economy that relies heavily on the spending of a small, wealthy segment of the population, which is not sustainable in the long term.
Please comment or send an email if you have any questions.
The Federal Open Market Committee (FOMC) just cut its benchmark interest rate, known as the federal funds rate, by a quarter-point (0.25%), bringing the target range to between 4.00% and 4.25%.
This can be considered a continuation of an easing cycle (period of lowering interest rates) that started back in September of 2024 but had been paused at the beginning of this year due to the uncertainty of how the new administration’s trade and immigration policies were going to affect prices and unemployment.
Since then, the data has shown that inflation has picked up mainly due to tariffs but not as much as expected. Our businesses are not passing on the full cost of the tariffs to their customers….for now. However, the labor market has weakened significantly in that same time span. Typically, when inflation picks up, raising rates helps cool it down. When unemployment increases, lowering rates is the standard response to help support employment. This dilemma of rising inflation and rising unemployment, aka stagflation, put the FOMC in a quandary for most of 2025.
Ultimately, at their last meeting, the FOMC chose to prioritize the battle against rising unemployment and restarted their easing cycle by cutting rates.
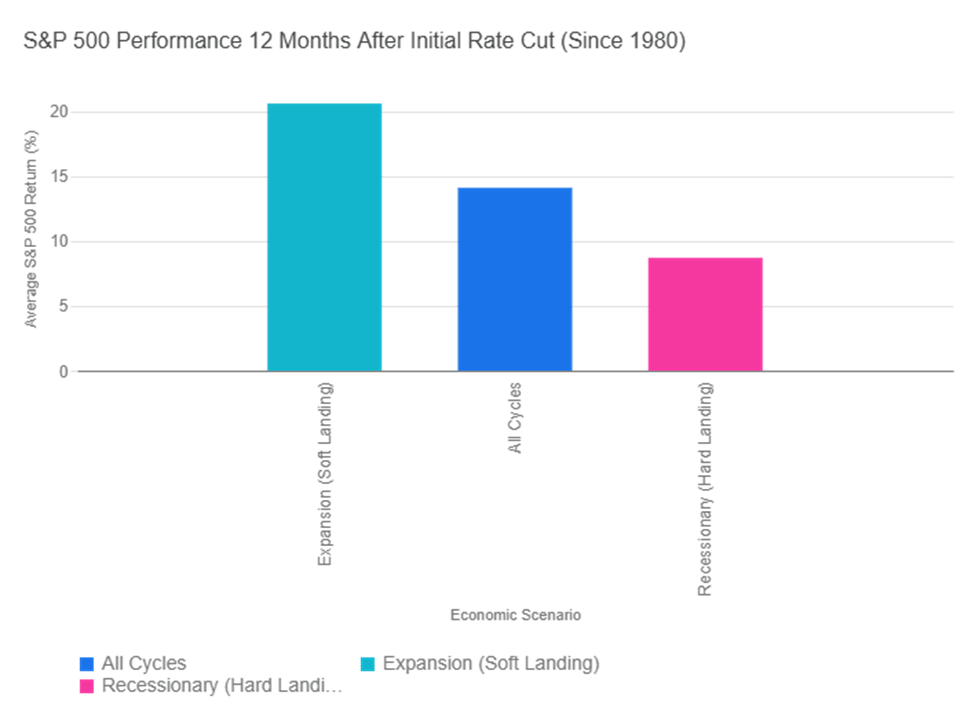
So, how will this affect the stock market? Historically, the market has performed well when interest rates are cut. The graph below illustrates the historical performance of the S&P 500 Index in the 12 months following the Federal Reserve’s first interest rate cut in a new cycle (since 1980). The returns vary significantly based on the underlying economic conditions, but they have always been good for stocks.
If we consider the start of the easing cycle to be September of 2024, we are now at a full year following the first rate cut. Interestingly enough, the S&P 500 has returned about 15.3% for that period, which coincides with its historical returns, as seen on the graph.
Does that mean we are due for a pullback? Not necessarily. If we continue on the trajectory of the soft landing that we were headed for at the beginning of this year, stock prices could continue to move higher. But, if inflation persists and unemployment continues to rise, we could be heading for a downturn.
The S&P 500 is also approaching a significant milestone: 3 years of consecutive double-digit returns. Stringing together three or more years of positive double-digit returns is rare but it happens.
Period (Start Year)
Length of Streak (Years)
Early 1930s (e.g., 1933–1936)
4
World War II / Post-War (e.g., 1942–1945)
4
Post-War Boom (e.g., 1949–1955)
7
Mid-1960s (e.g., 1963–1967)
5
1990s Tech Boom (1995–1999)
5
Post-Financial Crisis (e.g., 2012–2014)
3
Post-Pandemic Era (2019–2021)
3
We will see if stocks can make history as we head into the home stretch of 2025.
Please comment or send an email if you have any questions.
With positive returns in the stock market over the last three years, investors are most likely sitting on some unrealized capital gains in their taxable brokerage accounts. Read on if you are thinking about locking in some of those gains and how to minimize federal taxes on them.
First, let’s get some definitions out of the way.
A capital gain is the profit realized from the sale of a capital asset, such as stocks or bonds, for a price greater than what you paid for it, aka its cost basis.
For example, if a stock was purchased for $100 plus a $5 fee and was later sold for $150 with a $5 fee, the cost basis would be $105, and the net proceeds would be $145, resulting in a realized capital gain of $40.
For this gain to be considered long-term, you would need to have held the asset for more than one year. For example, if an asset is purchased on March 20, 2024, a sale on March 20, 2025, would be a short-term transaction, while a sale one day later on March 21, 2025, would be a long-term transaction.
Now, here’s the important part. These gains are subject to special, significantly lower tax rates of 0%, 15%, or 20%. These are typically lower than your ordinary income tax rate, which could be as high as 37%.
The following table details the specific income limits for 2025 to qualify for the various long-term capital gains (LTCG) tax rates.
Tax Filing Status
0% Rate Taxable Income
15% Rate Taxable Income
20% Rate Taxable Income
Single
Up to $48,350
$48,351 to $533,400
Over $533,400
Married Filing Jointly
Up to $96,700
$96,701 to $600,050
Over $600,050
Head of Household
Up to $64,750
$64,751 to $566,700
Over $566,700
Married Filing Separately
Up to $48,350
$48,351 to $300,000
Over $300,000
So, to be able to avoid LTCG tax in 2025, you will need to have taxable income of less than $48,300 for single filers and less than $96,700 if you’re married. It’s important to note that we are looking at taxable income, which is typically found at the bottom of your 1040 form (Line 15 on the 2024 Form 1040). Taxable income is calculated as adjusted gross income (AGI) minus standard or itemized deductions. This means an individual can strategically reduce their taxable income to fit within the 0% bracket.
For example, a single filer with a gross income of $65,000 using the standard deduction of $15,750 for 2025 and a 401k contribution of $10,900 could get their taxable income to $38,350, $10,000 below the $48,350 threshold. Therefore, a realized LTCG of $10,000 can be added to the taxable income, which would be taxed at 0% since the total taxable income is below the $48,350 threshold.
The decision to sell some winners and realize LTCGs in 2025 is not an isolated one; it must be coordinated with all other income, deduction, and contribution decisions for the year. Obviously, this strategy works best for those that already have a low taxable income, such as retirees.
Before taking any action, it is recommended to consult with a qualified tax professional, financial advisor, or attorney who can provide personalized guidance.
Please comment or send an email if you have any questions.
The Fed, specifically, the Federal Open Market Committee (FOMC), is not having their monthly meeting this August but many of the members are gathering this week in Jackson Hole, Wyoming with a bunch of financial big shots for their annual summer conference. The investment world will be tuning in to get any hints on what they plan to do with interest rates when they meet in September. So, I thought it would be a good time to review what happens when the Federal Reserve changes interest rates.
When the FOMC changes interest rates, they aren’t changing every rate out there. They are only changing the Federal Funds Rate (FFR). This is the rate that banks charge each other for overnight loans. Modifying this rate is one of the Fed’s tools that they use to maintain a healthy economy. They lower it if they feel the economy is slowing and raise it if the economy is heating up too quickly.
For example, if unemployment is trending up, the Fed would be more inclined to lower rates. If consumer prices (inflation) are going up at a higher rate than expected, they would consider raising rates to slow the increase.
Although you probably have never heard of the Fed Funds Rate, it does influence many of the interest rates that you are familiar with and interact with every day. The FFR is the base that the cost of money in the banking system is built upon. In fact, the prime rate, which almost all bank loans are based off of, is derived from the FFR and is typically 3% higher than the FFR.
Now, let’s take a look at the table below that shows what is expected with various rates and other economic factors when the FOMC changes the Fed Funds rate:
When FOMC raises the FFR, plan on:
When FOMC lowers the FFR, plan on:
Mortgage rates
Higher
Lower
Car loan rates
Higher
Lower
CD rates
Higher
Lower
Money market rates
Higher
Lower
Credit card rates
Higher
Lower
Business profits
Lower
Higher
Stock market
Lower
Higher
Consumer spending
Lower
Higher
Home sales
Lower
Higher
These expected changes don’t happen overnight. It takes time for the Fed’s actions to trickle down to other rates and markets. For instance, if the Fed raises the FFR, the stock market might not go down until rates are high enough in other investments, such as bonds or CDs, to justify the shift from stocks to those other investment options.
This should give you a better understanding of what is happening when you hear that the Fed is changing interest rates.
Please comment or send an email if you have any questions.
Stocks stayed in the green for the third month in a row, climbing a wall of worry built mainly from tariffs. The index reached a series of new all-time highs, driven by strong performances in Q2 by our home-grown big technology companies.
For the month of July, the S&P 500 rose a respectable 2.2%, even with a pretty big drop in the last days of the month. That beat the historical July average of 1.28% and now takes the index to a year-to-date return of 8.50%.
The usually quiet summer months for stocks are anything but this year. With most of the Q2 earnings posted already, the stock market is now going to be fixated on trade policy, the job market, inflation, and interest rates. Each of these four elements can provide a boost or a bust for stocks over the next month. If the new tariffs that were recently implemented stay in place, inflation is going to continue higher as it has over the past few months. Layoffs from both the public and private sectors are now showing up in the data as the effects of DOGE, trade, and immigration policies take hold. Companies are embracing AI to reduce payroll as well. The Federal Reserve is more likely to cut interest rates by their September meeting (no meeting in August) now with the recent poor jobs data most likely outweighing the rising inflation data.
The good news is, as I have said many times this year, the economy can get back on track if we get rid of the tariffs and instead negotiate trade deals with our allies that are beneficial to both parties. This would especially help our small businesses that can’t afford to pay these levies and still remain viable. It would also benefit those that are in the lower- and middle-income tiers that can’t afford the price increases that our companies will have to pass on to their customers due to the tariffs.
Historically, August has been a pretty boring month for stocks, with an average return of about 0.5%. I think this August could be a little more exciting, to say the least.
Take a look at the Outlook section below to see what events could move the markets over the short term.
Bond prices were flat to slightly lower during July as the economy began to show signs of slowing, increasing the potential for short-term interest rates to be lowered by the Federal Reserve. Although the Federal Reserve held rates unchanged after their July meeting, sentiment increased sharply for a cut by the time that they meet again in September due to the poor jobs report that came out just after the Fed concluded their meeting.
While there is a recovery in market sentiment after a temporary pause on new tariffs, concerns over the long-term impact of trade policies and geopolitical risks still persist. This kind of uncertainty can drive investors toward safer assets like bonds, particularly government bonds, increasing demand and pushing prices up. We will most likely see this price action continue if the most recent tariffs stay in place for any significant period of time.
The 10-year US Treasury note yield finished higher in July, settling at 4.36%, higher than the 4.23% yield that it was at the beginning of the month. The 30-year bond yield closed out the month at 4.89%, about 12 basis points higher than a month ago.
With all of the uncertainty in the bond market, it is prudent to invest in bonds that mature sooner rather than later. I like bonds with a 12-to-18-month maturity and plan on holding onto them until they do mature.
Savings rates didn’t move much in July. Money market rates and bank savings accounts are averaging only about 0.46% but the best rates can be found at credit unions and online banks with rates approaching 4.5%. It is worth it to do some research here. With rates staying above 4%, I think more money is going to be funneled into the safe havens of money markets and CDs as the stock market rebound is showing signs of fatigue. So, CDs and MMAs continue to be a great place toput your cash and your emergency fund, for now. Knowing this, it makes sense in most situations to put cash that you don’t immediately need into CDs with up to 2-year maturities. For emergency cash, stick to high yielding money market and savings accounts, of which the best are yielding about 4.4%. As always, keep the total under $250,000 per person at any one bank to ensure you are fully covered by the FDIC.
Mortgage rates mirrored other rate categories and had little movement this past month. The expectations were low for any changes in rates by the Federal Reserve, so this was expected. Higher housing inventory continued to put downward pressure on mortgage rates as well. Active listings rose for the 21st consecutive month, but overall inventory remains below pre-pandemic levels. It has become a buyers’ market in most parts of the country, but prices are still historically high and coupled with high mortgage rates, makes home purchases out of reach for many, especially first-time home buyers.
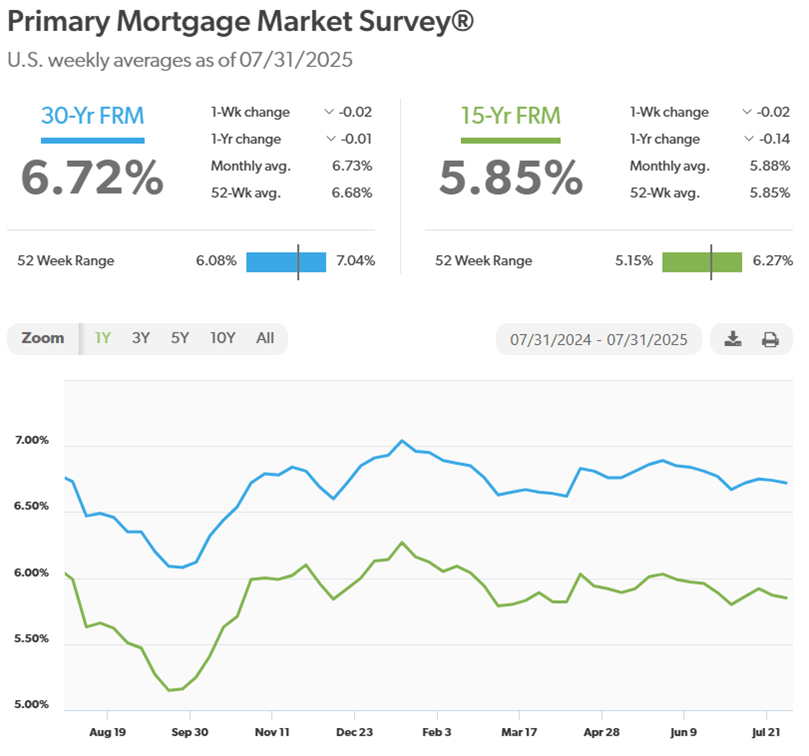
The 30-year fixed rate finished the month at 6.72%, still within the narrow range of 6.5% and 7% that it has been in since October of last year. The trade and immigration policies are causing higher raw materials and labor costs for homebuilders and are starting to show up in new home prices now, making it even harder to afford a new home.
Here is a look at the one-year chart of the 15- and 30-year mortgage rates from Freddie Mac.
Oil prices were much calmer in July than they were in June of this year. That is, until the last week when oil prices surged due to renewed geopolitical risk causing a disruption in the global oil supply. Specifically, when the U.S. issued a deadline to Russia to end the war in Ukraine, threatening additional sanctions and tariffs on countries that continue to buy Russian oil. This, coupled with the seasonally strong summer demand could keep prices elevated at least through the end of August.
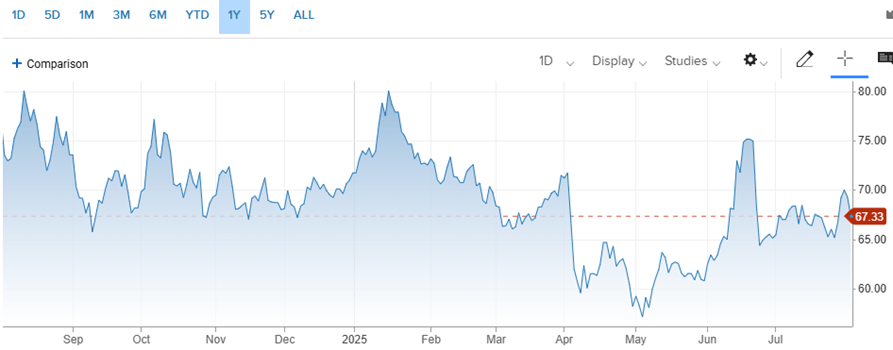
For the month, the price for a barrel of oil closed at $69.26, up from $65.11 at the beginning of July. For the year, it’s down about 3.40%. We certainly don’t want to see oil prices going higher now because that will raise the input costs for companies even higher as the tariffs take hold.
Here’s a look at the one-year chart for U.S. oil:
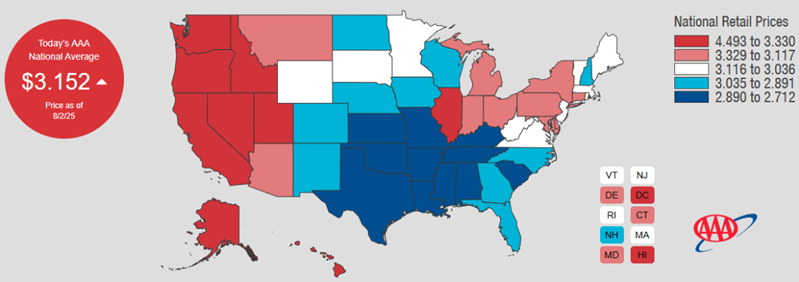
Gasoline prices dipped slightly in July. Regular unleaded gasoline is now averaging $3.15 per gallon, down four cents from last month. However, gas prices could be heading higher in the near future for reasons stated above in the oil prices section. Mississippi has the cheapest gas currently, checking in at $2.71 a gallon. California has the most expensive gasoline at $4.49 per gallon. FYI, a year ago, we were paying $3.48.
Check out the prices at the pump in your area: AAA Gas Prices.
Outlook
Events on the horizon that could move the markets in the near term:
Fed & Inflation: The Federal Reserve had started leaning towards cutting rates even before the bad jobs report came out this past Friday. Cracks have begun to appear in our resilient labor market as layoffs from DOGE and the private sector are reflected in the latest data. Also, inflation is picking up as U.S. companies begin to raise prices to offset the tariffs they are paying on imported goods and raw materials. Higher unemployment and higher prices, aka stagflation, is a tough scenario for the Fed to fight at the same time. Right now, it looks like they need to focus on the labor side of the equation, which would mean to cut rates. However, they have to tread carefully because lower rates combined with tariffs could lead to runaway inflation, which would be devastating to the economy. The ideal situation would be if we cut rates and removed the tariffs. That would help our economy recover and spur growth. I’m still hopeful.
Trump Administration Policies: The trade war is back on the front burner as tariffs are assessed on almost everything that our companies import for the products that they produce. As a reminder, the tariffs that we have been talking about this year are fees that U.S. companies pay our government. I like to think of these tariffs simply as an increase in the corporate tax for our companies. It basically increases the cost of doing business. So, in order for companies to keep the same profit margins pre-tariff, or in the case of many small businesses, to remain profitable at all, they have to either raise the prices that they charge their customers, lower expenses in other areas of their business, or a combination of both. Regardless of which avenue a company chooses, our economy will suffer, especially our small businesses and our lower income population that is already living paycheck to paycheck. As I said last month and will keep saying, the government needs to scuttle this absurd tariff strategy and go back to the drawing board to put together a plan that is realistic and can meet their objectives without damaging so many industries and so many lives. It’s not too late to save our small businesses, keep inflation in check, and get our economy back on track.
A big change is coming when you file your 2025 federal income taxes next year and here’s what you need to know.
Before we go over what has changed, let’s review what the State and Local Tax (SALT) includes. SALT refers to the federal tax deduction that allows taxpayers who itemize their deductions to subtract certain taxes they’ve paid to their state and local governments from their federal taxable income.
The taxes typically included in the SALT deduction are:
State and local income taxes
State and local property taxes
State and local general sales taxes (taxpayers generally choose to deduct either income taxes or sales taxes, but not both)
The SALT deduction cap has undergone significant changes with the recently signed “One Big Beautiful Bill” Act, offering a temporary increase for taxpayers. Here’s a breakdown of the new provisions:
Background:
Prior to 2025, there was a $10,000 cap ($5,000 for married individuals filing separately) on the SALT deduction.
Changes under the New Law (Effective 2025):
Increased Cap: For tax years 2025 through 2029, the SALT deduction cap is increased from $10,000 to $40,000.
Annual Adjustment: The $40,000 cap will increase by 1% each year from 2026 through 2029 to account for inflation.
Income-Based Phase-Down: The increased cap is subject to a phase-down for higher-income taxpayers:
For individuals and families with modified adjusted gross income (MAGI) over $500,000 (for joint filers in 2025, and this threshold also increases annually by 1%), the $40,000 cap is gradually reduced.
The deduction is phased down at a rate of $0.30 for every dollar over the income threshold.
Even with the phase-down, the deduction will not fall below the original $10,000 cap. This means taxpayers with MAGIs above approximately $600,000 in 2025 will effectively be limited to a $10,000 SALT deduction.
Sunset Provision: The higher SALT cap is temporary. Beginning in 2030, the deduction limit will revert to the original $10,000.
Who Benefits the Most:
Residents of High-Tax States: The increased cap provides significant relief to homeowners and taxpayers in states with high property and income taxes, such as California, New York, and New Jersey, who were significantly impacted by the previous $10,000 limit.
Itemizers: This change primarily benefits taxpayers who itemize their deductions, as the standard deduction has also been increased (e.g., to $31,500 for married filing jointly in 2025). Some households that previously took the standard deduction may now find it advantageous to itemize.
Targeted Relief: While the cap is higher, the income phase-down ensures that the full benefit of the increased cap is directed towards middle and upper-middle-income earners, with the highest earners seeing their deduction reduced back to the $10,000 level.
To summarize, the new SALT cap provides targeted relief to a broader segment of the population than the old cap, particularly those in areas with higher tax burdens, while still maintaining some limitations for the ultra-wealthy due to the income phase-down.
It’s important for taxpayers, especially those in high-tax states, to understand these changes and how they might affect their individual tax situations.
Please comment or send an email if you have any questions.
The economic stars were aligning beautifully at the beginning of the year for the Federal Reserve to start to gradually lower interest rates in 2025. Then, in February our economy, and much of the world’s economies, were upended with a shock and awe tariff policy by the Trump administration. This, coupled with changing global perceptions of U.S. governance and institutions has forced the Fed to rethink its interest rate strategy. Subsequently, the odds of any rate cuts this year have dropped significantly since the end of 2024.
Here are the main suspects that may keep interest rate higher for the foreseeable future:
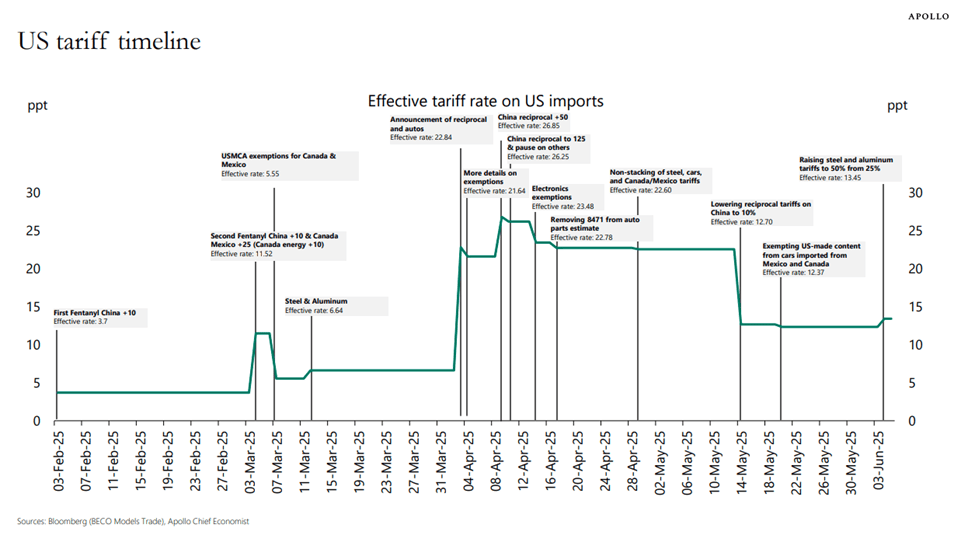
Tariffs: This chart summarizes the effective tariff rate that U.S. companies have had to pay since February:
The green line shows the effective tariff rate from February to June of this year. Prior to February, the U.S. was paying an effective tariff rate of about 2.4%. Currently, we are paying an effective rate of 13.45%. We were as high as 26.85% in April, so we have come off of the highs but still are at a level that is almost 6 times what we were paying at the start of the year. Now, it’s showing up in the prices that we are paying and also in the number of small businesses that have had to lay off workers, suspend operations, or shut down completely. This increase is just not sustainable and higher prices mean rates have to stay high to fend off runaway inflation.
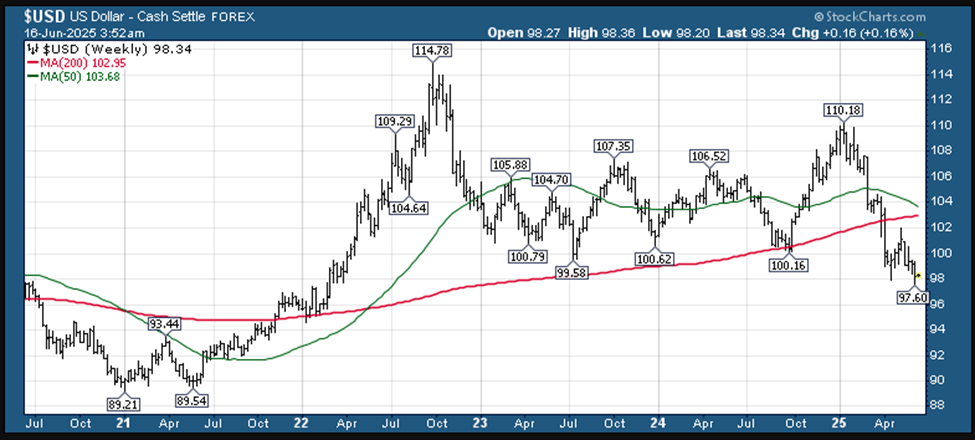
Weaker Dollar: Take a look at this chart of the US Dollar hitting a 3-year low recently.
The black is the dollar index value, the red is its 200-day moving average and the green is its 50-day moving average. There are several factors contributing to the downward pressure on the U.S. dollar, including:
Tariffs and Trade Policy
Global Concerns about U.S. Economic Growth and Recession Risks
Fiscal Deficit and Debt Concerns
Erosion of U.S. Except
In essence, a combination of protectionist trade policies, concerns about the U.S. economy’s resilience, fiscal anxieties, and a shift in global investor sentiment are all contributing to the weakening of the U.S. dollar in 2025. A weaker dollar is inflationary and another reason for the Fed to keep rate elevated.
As I have said before, these issues are self-inflicted, which means they can be resolved quickly if we act now. The longer these policies are in place, the harder it will be to recover from them. Then, the Federal Reserve will have to lower interest rates but for all the wrong reasons, aka a recession.
Please comment or send an email if you have any questions.