Make Sure You Are Doing This With Your Emergency Fund

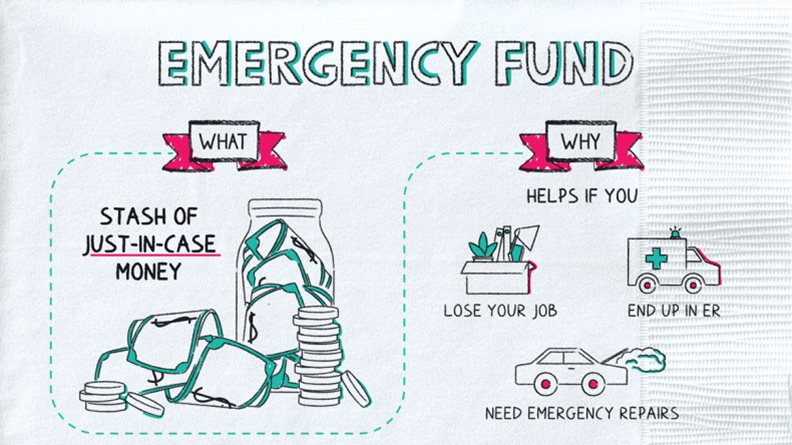
In the current interest rate environment, it is a good idea to shop around for the best savings rates when deciding where to park your emergency funds. As the graphic above suggests, an emergency fund is an account that contains cash that is liquid (easy and quick to access) so that it can be used if something unexpected happens and calls for some money quickly.

An emergency fund should be at the top of the list regarding the order that you should fund your financial accounts. Amazingly, most Americans say that they wouldn’t be able to pay off a $1,000 emergency expense if it ever came up. Almost as amazing is for those fortunate enough to have an adequate emergency fund, about 70% of them keep their emergency fund in their regular checking account, earning zero percent interest or close to it.

Yes, it does take a little effort to find a savings, checking, or money market account that pays a respectable interest rate, but it can be well worth it. There are money market account (MMA) rates near 5.5% right now, far better than the current average savings account yield of 0.08%. For example, $30,000 in an MMA yielding 5% will earn $1,500 in interest annually, versus $24 in the average savings account. That’s not bad for doing a little leg work.

A quick search on Google will give you a ton of options for both online and brick-and-mortar bank rates. Here are two that I like to use:

It’s important to consider other factors besides just the interest rate when choosing a money market account, such as minimum balance requirements, monthly fees, and ATM access.

Please comment or send an email if you have any questions. Thanks!

Joe Baker, CFP®

Baker Asset Management, LLC

joebaker@bakerassemanagement.com
Interesting Economic Indicators

I thought that I would share some interesting charts and data that I saw this past week regarding the health of the U.S. economy.

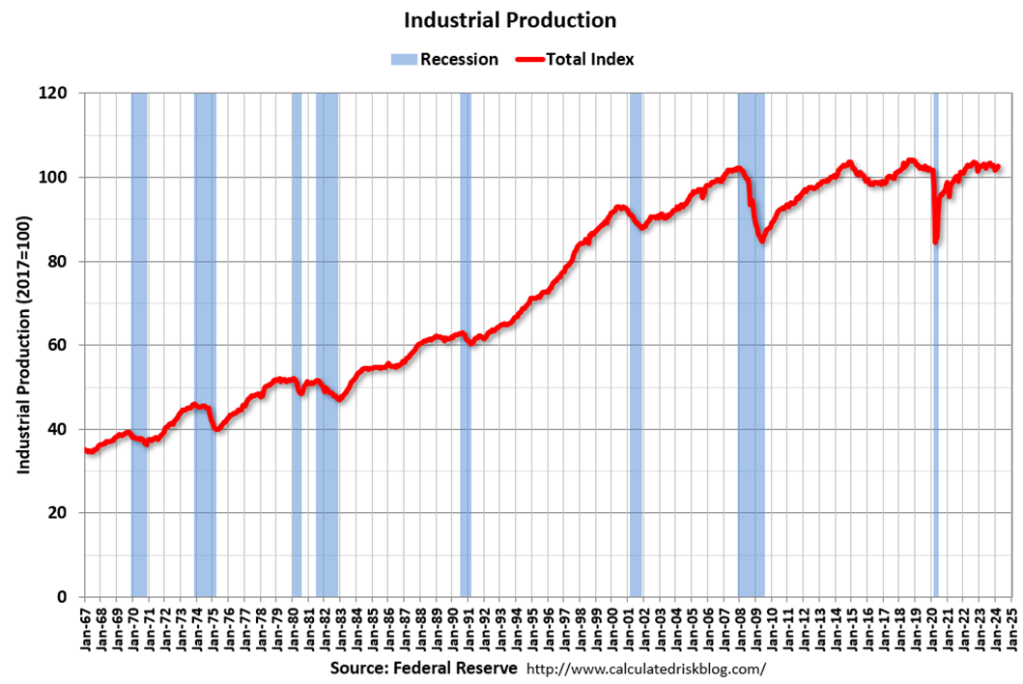
The following graph shows industrial production since 1967.

Industrial production is a measure of output of the industrial sector of the economy. The industrial sector includes manufacturing, mining, and utilities. The industrial sector is not as big a portion of our GDP as it once was but it’s still nice to see some increase in production in this area.


We are still spending like we just got out of a pandemic:

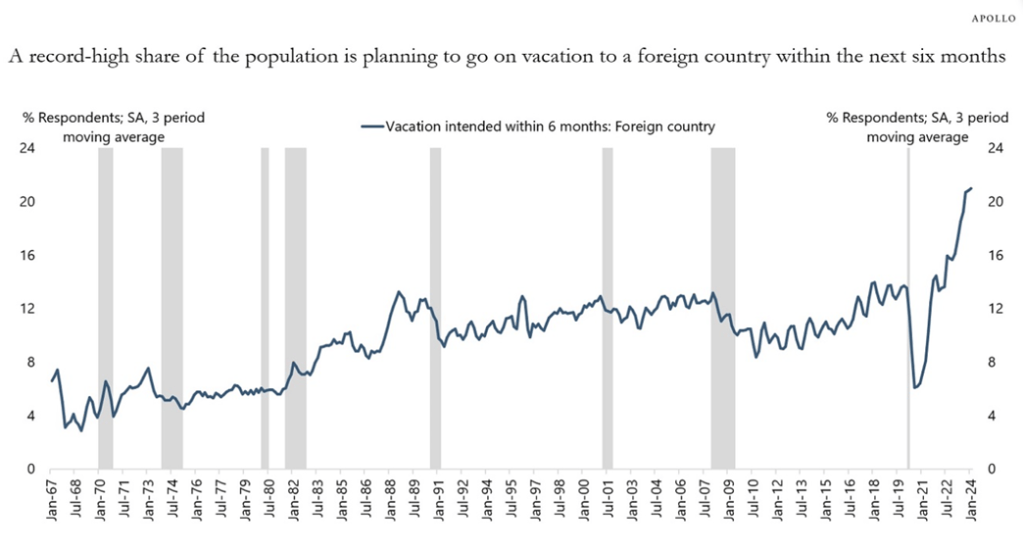
The Conference Board’s consumer confidence survey asks households if they plan to travel to a foreign country, and the chart below shows that a record-high share of US consumers is planning to go on vacation to a foreign country within the next six months.

Because of the significant rise in the stock market and significant cash flows from fixed income, US households have more money to travel on airplanes, stay at hotels, eat at restaurants, go to sporting events, amusement parks, and concerts, and that is why inflation in the non-housing service sector continues to be so high.


Apollo Academy


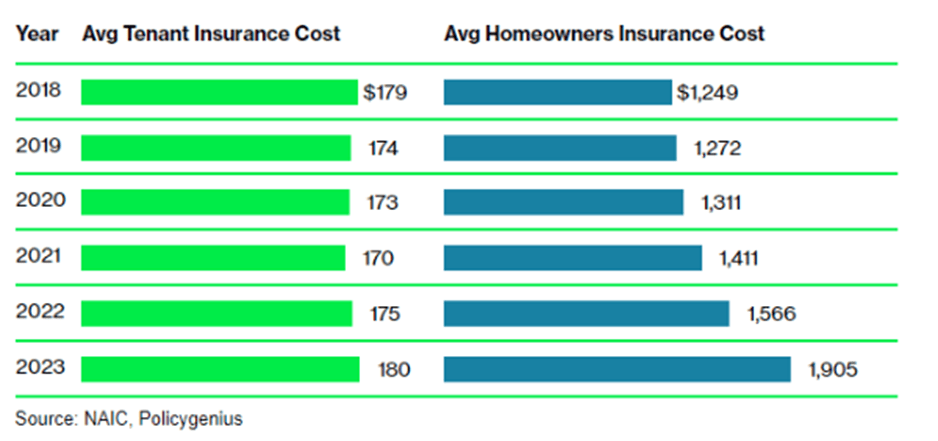
Homeowners and Auto Insurance Premiums are Surging

Regarding homeowners insurance, check this chart out which compares homeowners versus renters insurance over the last 5 years:


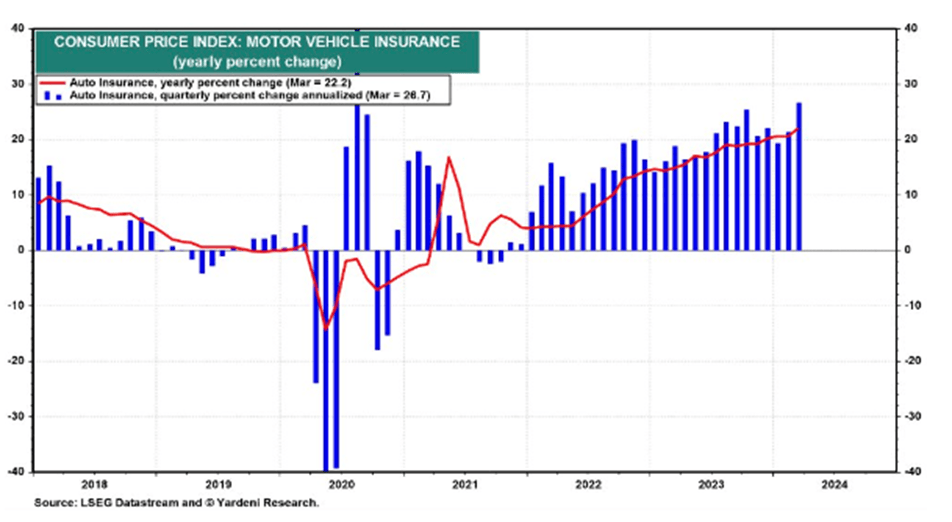
If you think that’s a big increase, look how much car insurance has jumped:


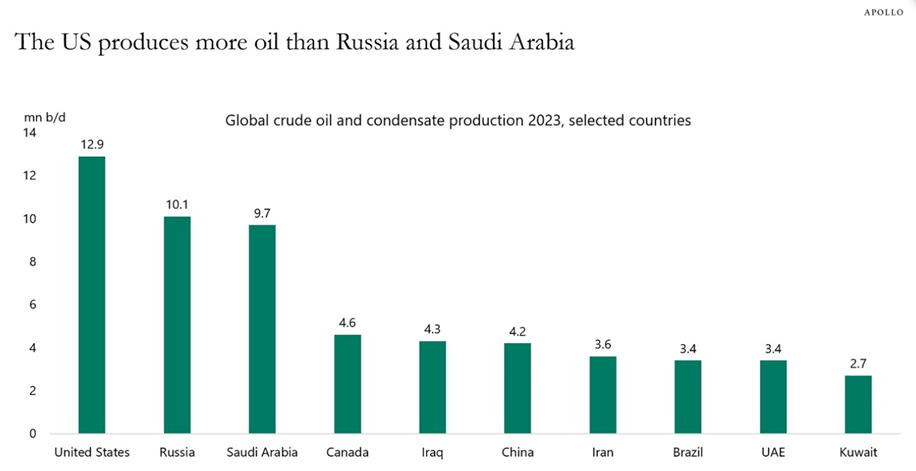
We are back on top of the world in oil production:

Apollo Academy


There’s a lot of good stuff happening in our economy. Unfortunately, one of the trade offs of a strong economy is inflation. Eventually, the high interest rate environment that we are currently in will help bring prices down but for now, the majority of U.S. consumers are keeping their wallets open. Hopefully, we can hit that soft landing that the Federal Reserve is aiming for so we don’t crash into a recession.

Please comment or send an email if you have any questions. Thanks!

Joe Baker, CFP®

Baker Asset Management, LLC

joebaker@bakerassemanagement.com
Your Balance Sheet Is Looking Good!

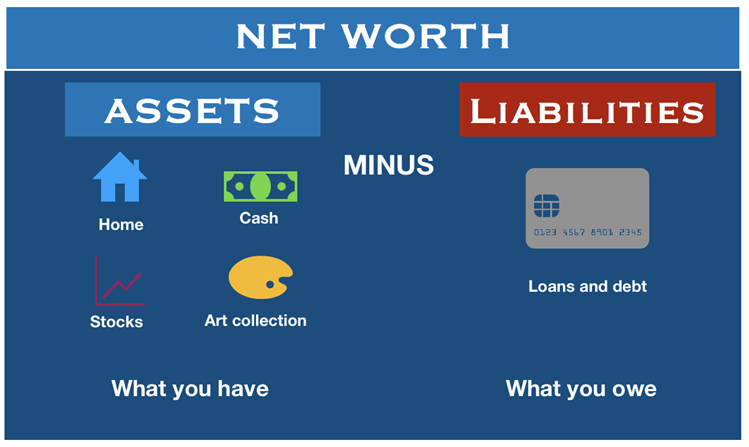
Just like for a company, the balance sheet is one of the most important financial statements that a household can use to monitor its financial health. Put simply, it is a snapshot of your net worth, which is just your assets (stuff you own like your home, stocks, retirement plans, etc.) minus your liabilities (stuff you owe like mortgages, credit card debt, student loans, etc.).

Recently, households in the U.S. have been getting healthier financially than at almost any other time in history. In fact, if you look at homeowners, about 39% have no mortgage and roughly 85% of homeowners that do have a mortgage, their mortgage rate is under 3.5%. When you couple this low amount of debt with all-time highs in the stock market, historically low unemployment, and decent wage growth, household net worth has never looked better.

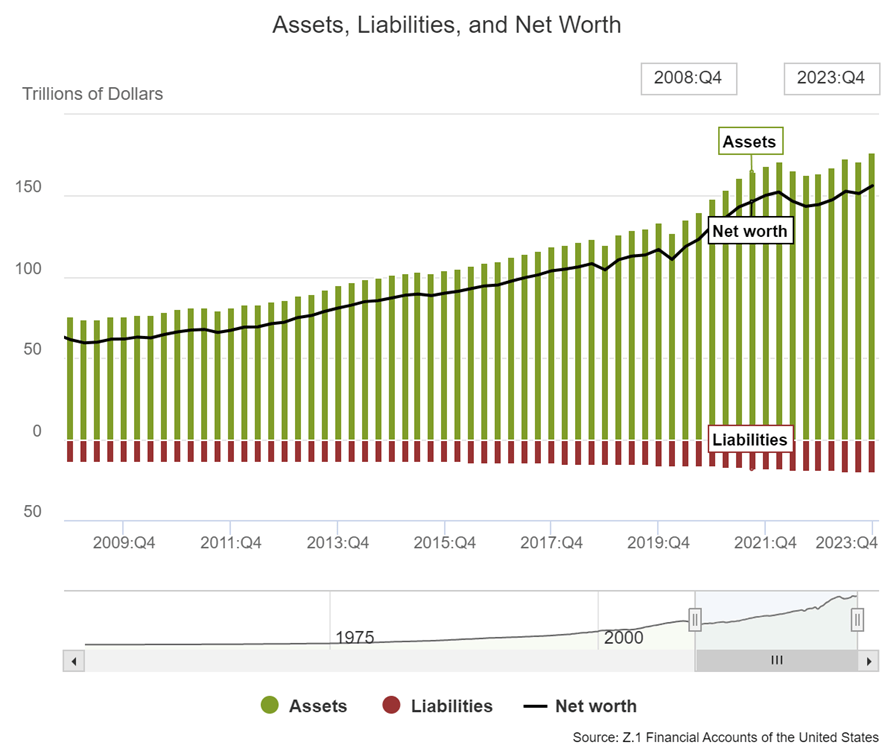
Here are a few charts that illustrate this topic more clearly:

In the chart above, you can see that since the great financial crisis, household net worth has consistently grown over the last fifteen years.

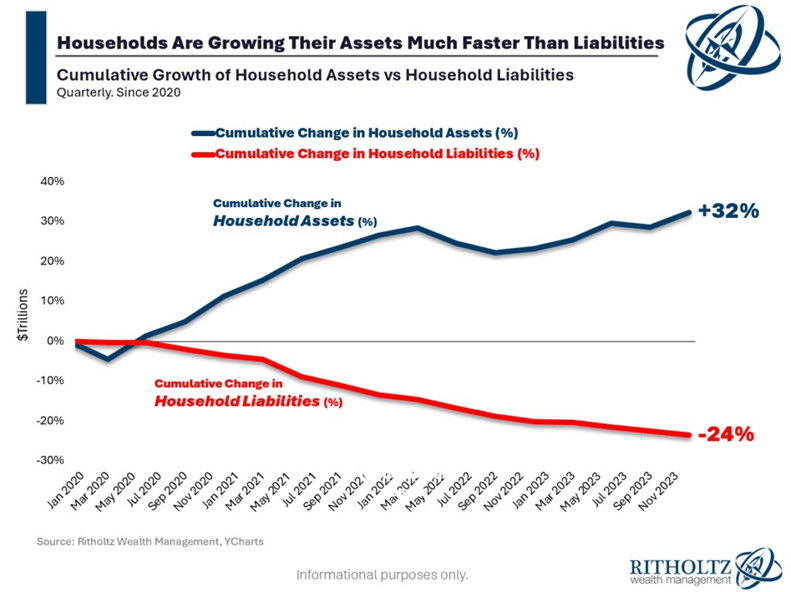
In this illustration, a more recent time period (from the pandemic in 2020 until the end of last year, 2023) shows the significant growth of household assets over the last three years while liabilities have dropped quite a bit.

Of course, the economic picture isn’t as rosy as it appears. There are some under currents to consider despite this encouraging data:

  • There is still significant wealth inequality. The top 1% hold a much larger share of the total wealth compared to the bottom 50% [Pew Research Center]. This falls under the old saying that “The rich get richer”.
  • Stubborn inflation could deplete some of the assets of households as they try to continue their same lifestyle without adjusting their spending habits for inflation.

For most households, things are looking pretty good, financially. If we can win the battle with inflation, we’ll see interest rates head lower, which will benefit the economy even more.

Please comment or send an email if you have any questions. Thanks!

Joe Baker, CFP®

Baker Asset Management, LLC

joebaker@bakerassemanagement.com
Don’t Forget About Your Capital Loss Carryover When Filing Your Taxes This Year

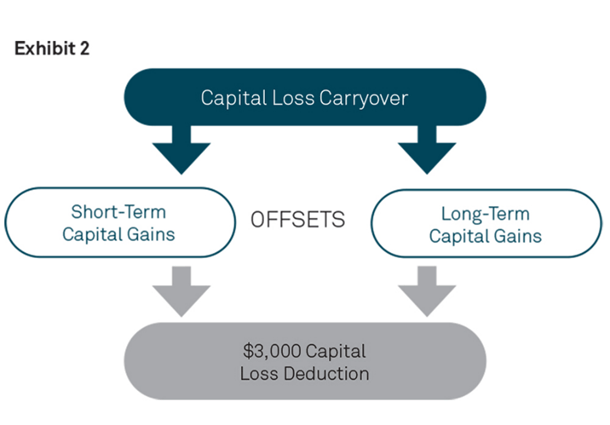
Because 2022 was such a bad year for the stock market, many investors who sold stocks back then had more capital losses than capital gains for that year. The good news is that they can use those excess losses to reduce their capital gains in 2023 and even some of their ordinary income (up to $3,000).

Capital loss carryover is a tax rule that lets you use investment losses from one year to reduce your taxable income in future years. Before going any further, keep in mind that this rule only applies to taxable accounts, not retirement accounts, such as IRAs.

Here’s how it works:

1. Calculating your net capital loss:

  • First, you need to calculate your net capital loss for the year. This is the difference between your capital gains (money you made on investments) and your capital losses (money you lost on investments).
  • You can only deduct up to a certain amount of net capital losses in a single year. This limit is currently $3,000.

2. Carryover of unused losses:

  • If your net capital loss is greater than the allowable deduction ($3,000), the unused portion automatically carries over to future tax years.
  • There is no time limit to how long you can carry over capital losses.
  • You can use the carryover to:

o Offset capital gains in future years.

o Deduct up to $3,000 against your ordinary income in future years.

3. Applying the carryover:

  • Each year, you calculate your net capital loss again, considering any new gains and losses.
  • You can use your current year’s net capital loss first to offset any capital gains you have.
  • Then, you can apply any remaining unused carryover from previous years to further reduce your taxable income.

4. Important points to remember:

  • Capital losses are categorized as short-term or long-term based on how long you held the investment before selling. Short-term losses can only offset short-term gains, while long-term losses can offset both short-term and long-term gains.
  • Wash sales are a strategy where you sell an investment at a loss and then repurchase it shortly after. This is generally not allowed and can prevent you from claiming the capital loss.
  • It’s important to keep accurate records of your capital gains and losses for tax purposes.

Here’s an example:

In 2022, you had $5,000 in capital losses and no capital gains. You deducted $3,000 of your losses to offset your ordinary income, and the remaining $2,000 carried over to 2023. In 2023, you had $1,000 in capital gains. You can first use your $2,000 carryover to completely offset these gains. You then have $1,000 remaining in your carryover that you can offset your ordinary income with, thus using up all of your capital loss carryover.

I hope this explanation helps. Remember, it’s always a good idea to consult with a tax professional for advice specific to your situation.

Please comment or send an email if you have any questions. Thanks!

Joe Baker, CFP®
Baker Asset Management, LLC
joebaker@bakerassemanagement.com
You Can Still Reduce Your 2023 Taxes

2023 is in the rearview mirror but there is still time to reduce your taxable income for last year:

Make a tax-deductible contribution to your IRA.

If you qualify, an IRA contribution can be a great way to reduce your 2023 taxes. You are allowed to contribute up to $6,500. If you are age 50 or older, you can add an extra $1,000 for a total of $7,500. You basically just had to have worked last year (have earned income) to qualify to make an IRA contribution.

Plus, if you are married, you can double up the amount with a spousal IRA.

If you are not covered by a retirement plan at work, you can deduct the full amount of your contribution, regardless of how much money you make.

If you do have a retirement plan at work, there are restrictions and limitations to qualify for the full deduction. Here’s a table that summarizes these rules. They are confusing so feel free to shoot me an email with any questions.

2023 Traditional IRA deduction limits

Filing StatusModified adjusted gross income (MAGI)Deduction Limit
Single individuals≤ $73,000Full deduction up to the amount of your contribution limit
> $73,000 but < $83,000Partial deduction
≥ $83,000No deduction
Married (filing joint returns)≤ $116,000Full deduction up to the amount of your contribution limit
> $116,000 but < $136,000Partial deduction
≥ $136,000No deduction
Married (filing separately)*< $10,000Partial deduction
≥ $10,000No deduction
  

If you’re self-employed, you can sock away a lot more by opening up a Simplified Employee Pension (SEP) plan before filing your taxes. For 2023, you can contribute up to $66,000, depending on your income.

Please comment or send an email if you have any questions. Thanks!

Joe Baker, CFP®

Baker Asset Management, LLC

joebaker@bakerassetmanagement.com

How Stocks Perform In Presidential Election Years

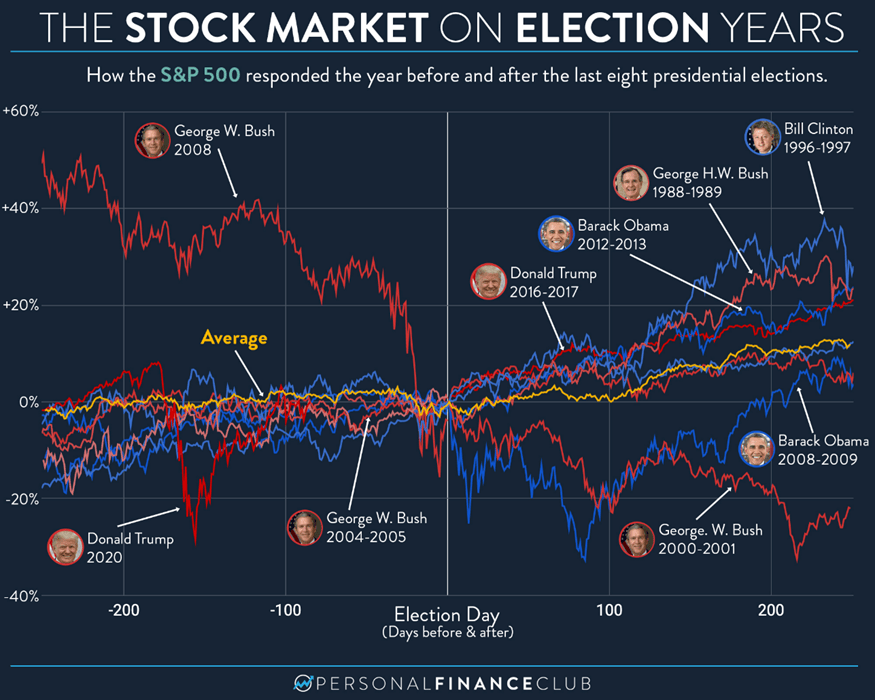
Besides interest rates and The Federal Reserve, stock market volatility is going to be heavily influenced by the presidential election this November. And it’s not going to wait until Fall. Headlines are going to be filled with polls, debates, and trials from now until election day (and beyond, I’m sure). I have always felt that elections are just short-term catalysts, both positive and negative, for stocks and Presidents don’t really have an affect on stock prices. It will still hold true this year. However, I suspect there will be much more volatility due to politics than normal, especially with addition of the Trump trials to the landscape.

So, let’s take a look at how markets have performed historically in a presidential election year:

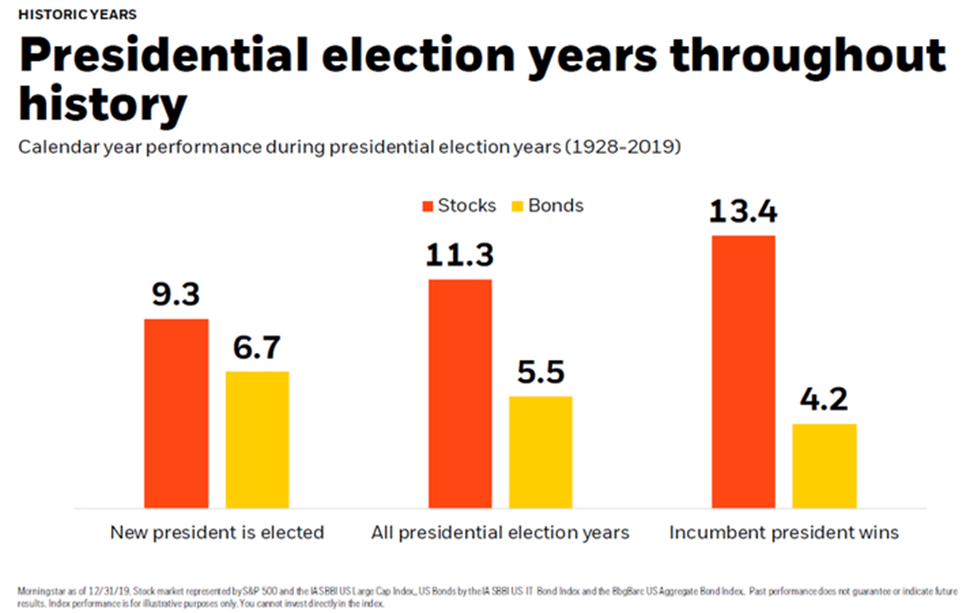
  • Historically, the S&P 500 has averaged a 7% gain during U.S. presidential election years since 1952. This is lower than the average annual gain of around 10% but still positive.
  • Re-election years: Markets tend to perform better in re-election years (such as this year), with the S&P 500 averaging a 12.2% gain since 1952. This could be due to an incumbent president’s focus on maintaining stability and avoiding major policy changes.
  • Party control: The party in control of Congress doesn’t seem to have a significant impact on market performance. However, major policy changes proposed by either party can cause uncertainty and volatility.
  • Economic conditions: The overall health of the economy has a much stronger influence on the stock market than the election itself. Strong economic growth and low inflation are typically associated with positive market returns.

Historically, stocks perform the best when an incumbent president wins and the opposite party controls at least one  section of Congress, either the House of Representatives or the Senate. But this shouldn’t influence your investment strategy for the long term. Holding high-quality, well-run companies will serve you well regardless of the political climate.

Please comment or send an email if you have any questions.

Joe Baker, CFP®

Baker Asset Management, LLC

joebaker@bakerassetmanagement.com