The Federal Open Market Committee (FOMC) just cut its benchmark interest rate, known as the federal funds rate, by a quarter-point (0.25%), bringing the target range to between 4.00% and 4.25%.
This can be considered a continuation of an easing cycle (period of lowering interest rates) that started back in September of 2024 but had been paused at the beginning of this year due to the uncertainty of how the new administration’s trade and immigration policies were going to affect prices and unemployment.
Since then, the data has shown that inflation has picked up mainly due to tariffs but not as much as expected. Our businesses are not passing on the full cost of the tariffs to their customers….for now. However, the labor market has weakened significantly in that same time span. Typically, when inflation picks up, raising rates helps cool it down. When unemployment increases, lowering rates is the standard response to help support employment. This dilemma of rising inflation and rising unemployment, aka stagflation, put the FOMC in a quandary for most of 2025.
Ultimately, at their last meeting, the FOMC chose to prioritize the battle against rising unemployment and restarted their easing cycle by cutting rates.
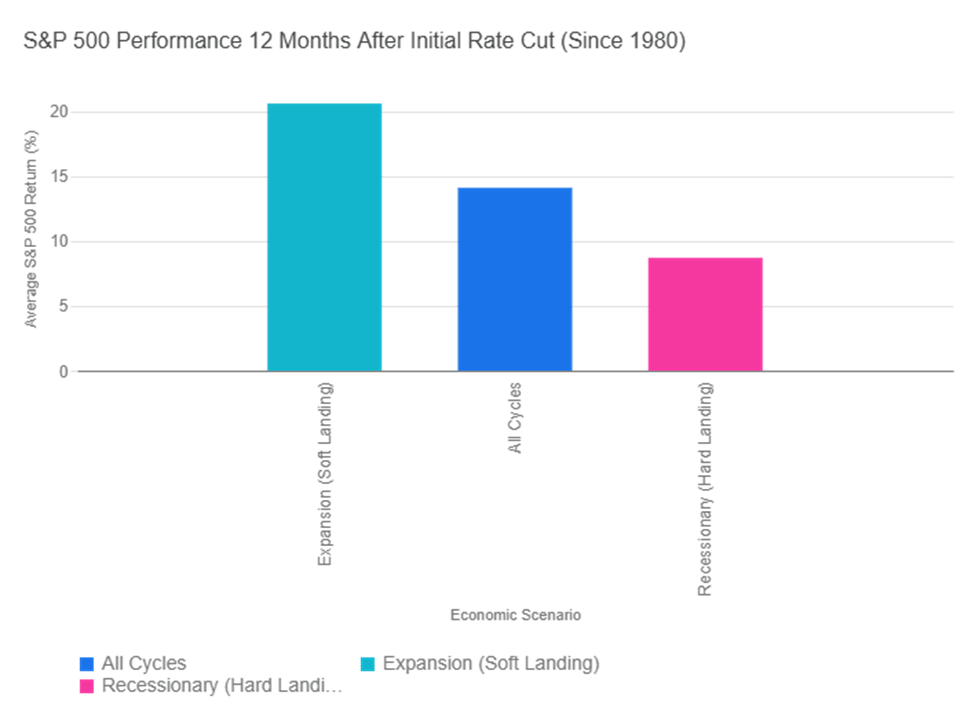
So, how will this affect the stock market? Historically, the market has performed well when interest rates are cut. The graph below illustrates the historical performance of the S&P 500 Index in the 12 months following the Federal Reserve’s first interest rate cut in a new cycle (since 1980). The returns vary significantly based on the underlying economic conditions, but they have always been good for stocks.
If we consider the start of the easing cycle to be September of 2024, we are now at a full year following the first rate cut. Interestingly enough, the S&P 500 has returned about 15.3% for that period, which coincides with its historical returns, as seen on the graph.
Does that mean we are due for a pullback? Not necessarily. If we continue on the trajectory of the soft landing that we were headed for at the beginning of this year, stock prices could continue to move higher. But, if inflation persists and unemployment continues to rise, we could be heading for a downturn.
The S&P 500 is also approaching a significant milestone: 3 years of consecutive double-digit returns. Stringing together three or more years of positive double-digit returns is rare but it happens.
Period (Start Year)
Length of Streak (Years)
Early 1930s (e.g., 1933–1936)
4
World War II / Post-War (e.g., 1942–1945)
4
Post-War Boom (e.g., 1949–1955)
7
Mid-1960s (e.g., 1963–1967)
5
1990s Tech Boom (1995–1999)
5
Post-Financial Crisis (e.g., 2012–2014)
3
Post-Pandemic Era (2019–2021)
3
We will see if stocks can make history as we head into the home stretch of 2025.
Please comment or send an email if you have any questions.
With positive returns in the stock market over the last three years, investors are most likely sitting on some unrealized capital gains in their taxable brokerage accounts. Read on if you are thinking about locking in some of those gains and how to minimize federal taxes on them.
First, let’s get some definitions out of the way.
A capital gain is the profit realized from the sale of a capital asset, such as stocks or bonds, for a price greater than what you paid for it, aka its cost basis.
For example, if a stock was purchased for $100 plus a $5 fee and was later sold for $150 with a $5 fee, the cost basis would be $105, and the net proceeds would be $145, resulting in a realized capital gain of $40.
For this gain to be considered long-term, you would need to have held the asset for more than one year. For example, if an asset is purchased on March 20, 2024, a sale on March 20, 2025, would be a short-term transaction, while a sale one day later on March 21, 2025, would be a long-term transaction.
Now, here’s the important part. These gains are subject to special, significantly lower tax rates of 0%, 15%, or 20%. These are typically lower than your ordinary income tax rate, which could be as high as 37%.
The following table details the specific income limits for 2025 to qualify for the various long-term capital gains (LTCG) tax rates.
Tax Filing Status
0% Rate Taxable Income
15% Rate Taxable Income
20% Rate Taxable Income
Single
Up to $48,350
$48,351 to $533,400
Over $533,400
Married Filing Jointly
Up to $96,700
$96,701 to $600,050
Over $600,050
Head of Household
Up to $64,750
$64,751 to $566,700
Over $566,700
Married Filing Separately
Up to $48,350
$48,351 to $300,000
Over $300,000
So, to be able to avoid LTCG tax in 2025, you will need to have taxable income of less than $48,300 for single filers and less than $96,700 if you’re married. It’s important to note that we are looking at taxable income, which is typically found at the bottom of your 1040 form (Line 15 on the 2024 Form 1040). Taxable income is calculated as adjusted gross income (AGI) minus standard or itemized deductions. This means an individual can strategically reduce their taxable income to fit within the 0% bracket.
For example, a single filer with a gross income of $65,000 using the standard deduction of $15,750 for 2025 and a 401k contribution of $10,900 could get their taxable income to $38,350, $10,000 below the $48,350 threshold. Therefore, a realized LTCG of $10,000 can be added to the taxable income, which would be taxed at 0% since the total taxable income is below the $48,350 threshold.
The decision to sell some winners and realize LTCGs in 2025 is not an isolated one; it must be coordinated with all other income, deduction, and contribution decisions for the year. Obviously, this strategy works best for those that already have a low taxable income, such as retirees.
Before taking any action, it is recommended to consult with a qualified tax professional, financial advisor, or attorney who can provide personalized guidance.
Please comment or send an email if you have any questions.
Talking about your beneficiaries means talking about death, specifically your death. Planning for your death may sound like the worst thing ever but it is really an incredibly thoughtful act on your part and will help to minimize stress for your family and loved ones when you ultimately check out.
Beneficiaries are typically assigned to retirement accounts (401k, IRAs, etc.), life insurance and annuity policies, as well as transfer-on-death (TOD) accounts. Naming beneficiaries on these accounts allow these assets to avoid the probate process after your death. If you don’t name any beneficiaries, these accounts will be passed on to your estate where they will go through probate based on your state laws. Probate is a legal proceeding that determines who will get your stuff. It is a lengthy, complex process that can be pretty expensive.
If you have a will, probate will use that to determine how your assets get divvied up. If you don’t have a will, also known as intestate, the state will do the best they can to determine who gets what. Suffice it to say, naming beneficiaries is the way to go. Getting this done before you pass away will make things simpler, quicker, and cheaper for your heirs during a very stressful time.
Naming beneficiaries can also be a very simple and inexpensive estate plan for most people, especially if you title your real estate property as a TOD asset.
You should name both primary and contingent beneficiaries. The primary beneficiary is first in line to receive your assets. If the primary beneficiary passes away before you, the contingent beneficiary will receive those assets, depending on your selection of per capita or per stirpes (see explanation below). You can have as many primary and contingent beneficiaries as you want.
Now, here is the most overlooked section of the beneficiary page: Choosing per stirpes or per capita.
Per capita (Latin for each head) means that if a beneficiary dies before you die, their share of the inheritance goes back to the estate and gets divided among the other living beneficiaries.
Choosing which one of these for your beneficiaries is very important and should be considered carefully. In the most basic instance, you should elect per stirpes on your beneficiary designations to ensure that your heirs’ heirs receive their share.
I mentioned transfer-on-death (TOD) accounts earlier and just wanted to review what they are and when to use them. TOD is used for taxable accounts, and it allows you to assign beneficiaries just as you do with retirement accounts, annuities, and life insurance. This allows your taxable accounts to bypass the probate process, which is quicker, cheaper, and less stressful for your heirs.
Also, there are about 25 states that currently offer a TOD deed for real estate property. This is a huge time and money saver for your heirs because the property automatically passes down to your beneficiaries named on the deed.
Finally, remember to review your beneficiaries at least annually and certainly after any major life events, such as death, divorce, marriage, adoption, etc.
Please comment or send an email if you have any questions.
Stocks stayed in the green for the third month in a row, climbing a wall of worry built mainly from tariffs. The index reached a series of new all-time highs, driven by strong performances in Q2 by our home-grown big technology companies.
For the month of July, the S&P 500 rose a respectable 2.2%, even with a pretty big drop in the last days of the month. That beat the historical July average of 1.28% and now takes the index to a year-to-date return of 8.50%.
The usually quiet summer months for stocks are anything but this year. With most of the Q2 earnings posted already, the stock market is now going to be fixated on trade policy, the job market, inflation, and interest rates. Each of these four elements can provide a boost or a bust for stocks over the next month. If the new tariffs that were recently implemented stay in place, inflation is going to continue higher as it has over the past few months. Layoffs from both the public and private sectors are now showing up in the data as the effects of DOGE, trade, and immigration policies take hold. Companies are embracing AI to reduce payroll as well. The Federal Reserve is more likely to cut interest rates by their September meeting (no meeting in August) now with the recent poor jobs data most likely outweighing the rising inflation data.
The good news is, as I have said many times this year, the economy can get back on track if we get rid of the tariffs and instead negotiate trade deals with our allies that are beneficial to both parties. This would especially help our small businesses that can’t afford to pay these levies and still remain viable. It would also benefit those that are in the lower- and middle-income tiers that can’t afford the price increases that our companies will have to pass on to their customers due to the tariffs.
Historically, August has been a pretty boring month for stocks, with an average return of about 0.5%. I think this August could be a little more exciting, to say the least.
Take a look at the Outlook section below to see what events could move the markets over the short term.
Bond prices were flat to slightly lower during July as the economy began to show signs of slowing, increasing the potential for short-term interest rates to be lowered by the Federal Reserve. Although the Federal Reserve held rates unchanged after their July meeting, sentiment increased sharply for a cut by the time that they meet again in September due to the poor jobs report that came out just after the Fed concluded their meeting.
While there is a recovery in market sentiment after a temporary pause on new tariffs, concerns over the long-term impact of trade policies and geopolitical risks still persist. This kind of uncertainty can drive investors toward safer assets like bonds, particularly government bonds, increasing demand and pushing prices up. We will most likely see this price action continue if the most recent tariffs stay in place for any significant period of time.
The 10-year US Treasury note yield finished higher in July, settling at 4.36%, higher than the 4.23% yield that it was at the beginning of the month. The 30-year bond yield closed out the month at 4.89%, about 12 basis points higher than a month ago.
With all of the uncertainty in the bond market, it is prudent to invest in bonds that mature sooner rather than later. I like bonds with a 12-to-18-month maturity and plan on holding onto them until they do mature.
Savings rates didn’t move much in July. Money market rates and bank savings accounts are averaging only about 0.46% but the best rates can be found at credit unions and online banks with rates approaching 4.5%. It is worth it to do some research here. With rates staying above 4%, I think more money is going to be funneled into the safe havens of money markets and CDs as the stock market rebound is showing signs of fatigue. So, CDs and MMAs continue to be a great place toput your cash and your emergency fund, for now. Knowing this, it makes sense in most situations to put cash that you don’t immediately need into CDs with up to 2-year maturities. For emergency cash, stick to high yielding money market and savings accounts, of which the best are yielding about 4.4%. As always, keep the total under $250,000 per person at any one bank to ensure you are fully covered by the FDIC.
Mortgage rates mirrored other rate categories and had little movement this past month. The expectations were low for any changes in rates by the Federal Reserve, so this was expected. Higher housing inventory continued to put downward pressure on mortgage rates as well. Active listings rose for the 21st consecutive month, but overall inventory remains below pre-pandemic levels. It has become a buyers’ market in most parts of the country, but prices are still historically high and coupled with high mortgage rates, makes home purchases out of reach for many, especially first-time home buyers.
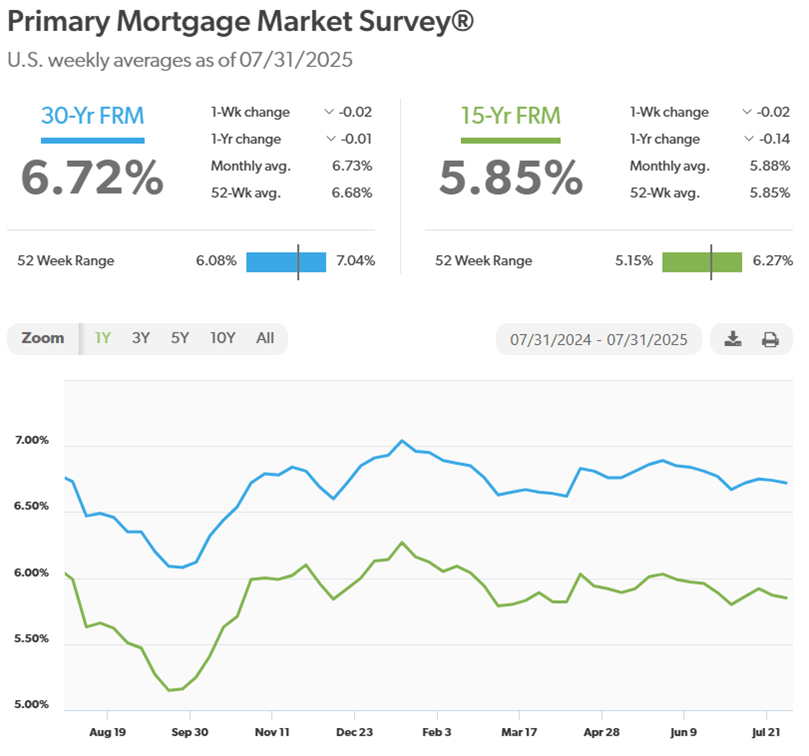
The 30-year fixed rate finished the month at 6.72%, still within the narrow range of 6.5% and 7% that it has been in since October of last year. The trade and immigration policies are causing higher raw materials and labor costs for homebuilders and are starting to show up in new home prices now, making it even harder to afford a new home.
Here is a look at the one-year chart of the 15- and 30-year mortgage rates from Freddie Mac.
Oil prices were much calmer in July than they were in June of this year. That is, until the last week when oil prices surged due to renewed geopolitical risk causing a disruption in the global oil supply. Specifically, when the U.S. issued a deadline to Russia to end the war in Ukraine, threatening additional sanctions and tariffs on countries that continue to buy Russian oil. This, coupled with the seasonally strong summer demand could keep prices elevated at least through the end of August.
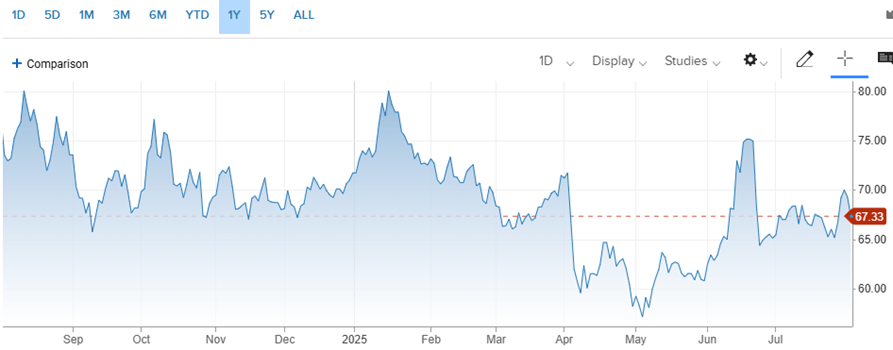
For the month, the price for a barrel of oil closed at $69.26, up from $65.11 at the beginning of July. For the year, it’s down about 3.40%. We certainly don’t want to see oil prices going higher now because that will raise the input costs for companies even higher as the tariffs take hold.
Here’s a look at the one-year chart for U.S. oil:
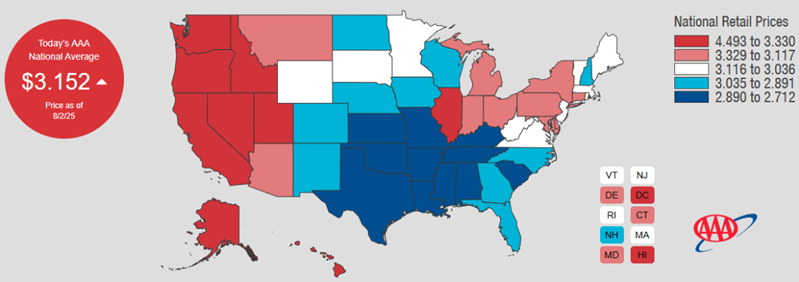
Gasoline prices dipped slightly in July. Regular unleaded gasoline is now averaging $3.15 per gallon, down four cents from last month. However, gas prices could be heading higher in the near future for reasons stated above in the oil prices section. Mississippi has the cheapest gas currently, checking in at $2.71 a gallon. California has the most expensive gasoline at $4.49 per gallon. FYI, a year ago, we were paying $3.48.
Check out the prices at the pump in your area: AAA Gas Prices.
Outlook
Events on the horizon that could move the markets in the near term:
Fed & Inflation: The Federal Reserve had started leaning towards cutting rates even before the bad jobs report came out this past Friday. Cracks have begun to appear in our resilient labor market as layoffs from DOGE and the private sector are reflected in the latest data. Also, inflation is picking up as U.S. companies begin to raise prices to offset the tariffs they are paying on imported goods and raw materials. Higher unemployment and higher prices, aka stagflation, is a tough scenario for the Fed to fight at the same time. Right now, it looks like they need to focus on the labor side of the equation, which would mean to cut rates. However, they have to tread carefully because lower rates combined with tariffs could lead to runaway inflation, which would be devastating to the economy. The ideal situation would be if we cut rates and removed the tariffs. That would help our economy recover and spur growth. I’m still hopeful.
Trump Administration Policies: The trade war is back on the front burner as tariffs are assessed on almost everything that our companies import for the products that they produce. As a reminder, the tariffs that we have been talking about this year are fees that U.S. companies pay our government. I like to think of these tariffs simply as an increase in the corporate tax for our companies. It basically increases the cost of doing business. So, in order for companies to keep the same profit margins pre-tariff, or in the case of many small businesses, to remain profitable at all, they have to either raise the prices that they charge their customers, lower expenses in other areas of their business, or a combination of both. Regardless of which avenue a company chooses, our economy will suffer, especially our small businesses and our lower income population that is already living paycheck to paycheck. As I said last month and will keep saying, the government needs to scuttle this absurd tariff strategy and go back to the drawing board to put together a plan that is realistic and can meet their objectives without damaging so many industries and so many lives. It’s not too late to save our small businesses, keep inflation in check, and get our economy back on track.
A big change is coming when you file your 2025 federal income taxes next year and here’s what you need to know.
Before we go over what has changed, let’s review what the State and Local Tax (SALT) includes. SALT refers to the federal tax deduction that allows taxpayers who itemize their deductions to subtract certain taxes they’ve paid to their state and local governments from their federal taxable income.
The taxes typically included in the SALT deduction are:
State and local income taxes
State and local property taxes
State and local general sales taxes (taxpayers generally choose to deduct either income taxes or sales taxes, but not both)
The SALT deduction cap has undergone significant changes with the recently signed “One Big Beautiful Bill” Act, offering a temporary increase for taxpayers. Here’s a breakdown of the new provisions:
Background:
Prior to 2025, there was a $10,000 cap ($5,000 for married individuals filing separately) on the SALT deduction.
Changes under the New Law (Effective 2025):
Increased Cap: For tax years 2025 through 2029, the SALT deduction cap is increased from $10,000 to $40,000.
Annual Adjustment: The $40,000 cap will increase by 1% each year from 2026 through 2029 to account for inflation.
Income-Based Phase-Down: The increased cap is subject to a phase-down for higher-income taxpayers:
For individuals and families with modified adjusted gross income (MAGI) over $500,000 (for joint filers in 2025, and this threshold also increases annually by 1%), the $40,000 cap is gradually reduced.
The deduction is phased down at a rate of $0.30 for every dollar over the income threshold.
Even with the phase-down, the deduction will not fall below the original $10,000 cap. This means taxpayers with MAGIs above approximately $600,000 in 2025 will effectively be limited to a $10,000 SALT deduction.
Sunset Provision: The higher SALT cap is temporary. Beginning in 2030, the deduction limit will revert to the original $10,000.
Who Benefits the Most:
Residents of High-Tax States: The increased cap provides significant relief to homeowners and taxpayers in states with high property and income taxes, such as California, New York, and New Jersey, who were significantly impacted by the previous $10,000 limit.
Itemizers: This change primarily benefits taxpayers who itemize their deductions, as the standard deduction has also been increased (e.g., to $31,500 for married filing jointly in 2025). Some households that previously took the standard deduction may now find it advantageous to itemize.
Targeted Relief: While the cap is higher, the income phase-down ensures that the full benefit of the increased cap is directed towards middle and upper-middle-income earners, with the highest earners seeing their deduction reduced back to the $10,000 level.
To summarize, the new SALT cap provides targeted relief to a broader segment of the population than the old cap, particularly those in areas with higher tax burdens, while still maintaining some limitations for the ultra-wealthy due to the income phase-down.
It’s important for taxpayers, especially those in high-tax states, to understand these changes and how they might affect their individual tax situations.
Please comment or send an email if you have any questions.
For as long as I can remember, one of the standard ingredients in a diversified stock portfolio has always included small-cap stock mutual funds or ETFs. As a refresher, small-cap stocks are shares in publicly traded companies with a market capitalization between $250 million and $2 billion and are considered to have higher growth potential but also higher risk compared to larger companies, such as those in the S&P 500 index.
Some of the risks that differentiate small-cap stocks from their large-cap siblings are:
Lower Liquidity: Small-cap stocks often have lower trading volumes. This means it can be difficult to buy or sell a large number of shares quickly without significantly impacting the stock’s price. In times of market stress, this lack of liquidity can make it challenging to exit a position, potentially exacerbating losses.
Greater Risk of Failure: Many small-cap companies are still in their early growth stages, with unproven business models and limited financial resources. This makes them more susceptible to business failures, competition, and economic shocks. Investors in these companies face a higher risk of losing their entire investment compared to investing in established, larger firms.
Sensitivity to Economic Conditions: Small-cap companies tend to be more sensitive to macroeconomic factors like interest rates, inflation, and recessions. They often have higher debt burdens and shorter debt cycles, making them more vulnerable to rising interest rates, which increase borrowing costs. During economic downturns, small businesses can be hit harder and take longer to recover than larger, more diversified corporations.
Because of these increased risks, most investors like to use small-cap mutual funds or ETFs to meet their diversification goals because it allows them to invest in a basket of small-cap stocks which normally helps reduce some of the risk. Recently, however, this has not been the best strategy and another reason why too much diversification can lead to diworsification when setting up your stock portfolio.
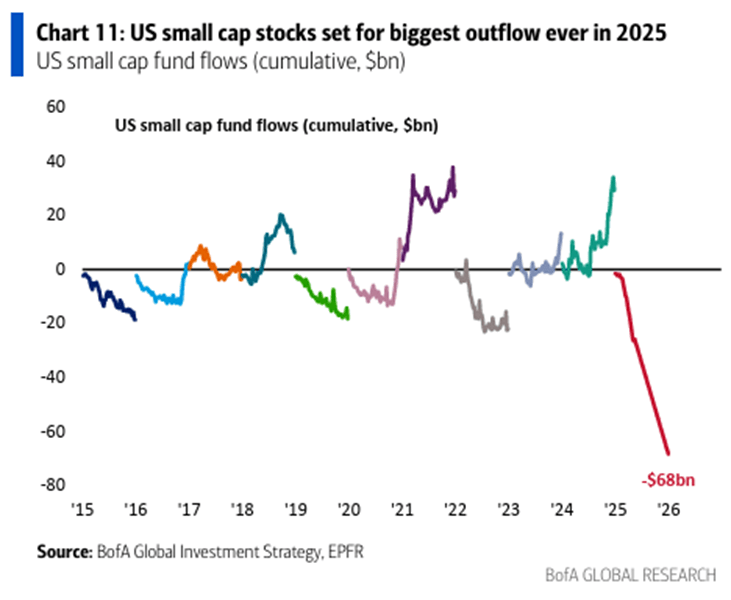
The biggest problem with small-cap funds is that when a small-cap company does well, it either gets bought by a larger company or becomes too big to stay in the small-cap world. Either way, it gets taken out of the small-cap fund, leaving the lower performing companies in it and it looks like investors are starting to realize this:
This illustration shows flow of money into and out of small-cap funds over the last ten years. As you can see, money is moving out big-time this year due to underperformance for the reasons stated above.
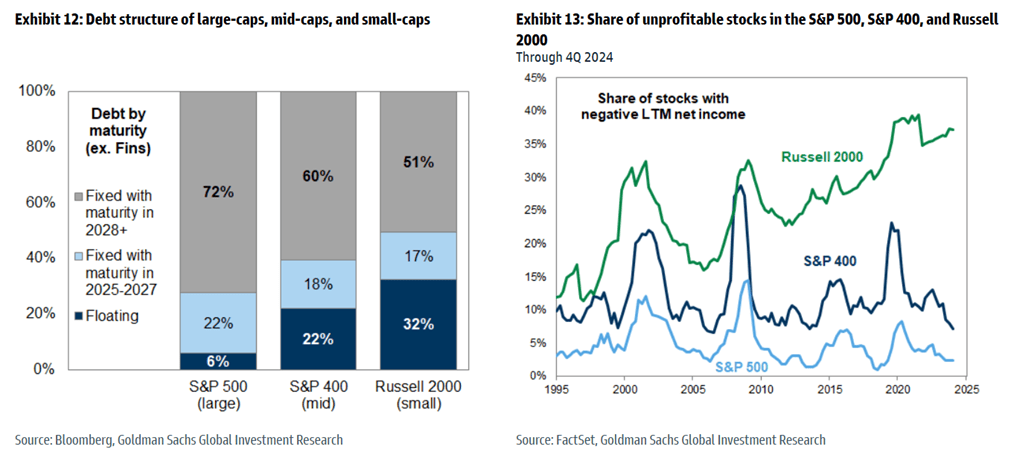
Here’s a few more charts that should scare you away from small-caps:
The chart on the left shows that small companies hold a larger portion of their debt in floating rate loans, which can be a huge risk in a rising interest-rate environment that we are starting to see as the tariffs start to kick in. The graph on the right shows that the number of unprofitable small-cap stocks is increasing while larger companies are becoming more profitable.
While it can pay off investing in small-cap stocks, it just seems like there is too much risk for the reward, especially in the current economic environment.
Please comment or send an email if you have any questions.
Retirement marks a significant financial transition, and with it comes a shift in how federal income taxes are managed. Unlike the years of employment where taxes were typically withheld from each paycheck, retirees often find that their income sources, such as distributions from retirement accounts, investment earnings, and even Social Security benefits, may not have taxes automatically deducted. This necessitates understanding and potentially paying estimated federal taxes, a system designed to ensure that income tax is paid throughout the year rather than in a single lump sum at the time of filing. Navigating these obligations is crucial for retirees to avoid potential penalties and interest imposed by the Internal Revenue Service (IRS) for underpayment.
Many individuals transitioning into retirement may find the concept of estimated taxes unfamiliar, especially if their primary income source for most of their working lives was through wages with automatic withholding. This change in tax responsibility can be a significant adjustment, requiring a proactive approach to tax planning and payment. Furthermore, the diverse nature of retirement income, which can include pensions, annuities, investment portfolios, and Social Security benefits, often makes tax obligations more intricate than during active employment. Each of these income streams has its own set of tax rules and varying degrees of potential withholding, demanding careful management of one’s overall tax situation. By taking a proactive stance in understanding and managing estimated tax obligations, retirees can achieve greater financial security and enjoy their retirement years with the assurance of having met their tax responsibilities, thereby avoiding unexpected tax bills.
How do retirees know if they have to pay estimated taxes?
The fundamental question for retirees is whether they are required to pay estimated federal income taxes. Generally, the rule is that a retiree must pay estimated tax if they anticipate owing at least $1,000 in federal income tax for the year, after accounting for any withholding and refundable credits. Here is a list of the most common forms of income that are not subject to automatic federal income tax withholding:
Taxable distributions from traditional IRAs, 401(k) plans, and other pre-tax retirement accounts may not have sufficient withholding to cover total tax liability.
Interest income, excluding tax-free municipal bonds, generally lacks automatic withholding.
Dividend income, whether ordinary or qualified, typically does not have automatic withholding either.
Capital gains from sales of investments like stocks, bonds, or real estate are usually not subject to withholding at the point of sale.
Rental income often requires estimated tax payments as it is treated as self-employment income for tax purposes.
Self-employed retirees, including freelancers and consultants, should also make estimated tax payments for both income tax and self-employment tax.
Retirees can choose to have federal taxes withheld from Social Security benefits; otherwise, the taxable portion may need estimated tax payments.
How do retirees calculate payments for estimated taxes?
Calculating estimated federal income tax requires retirees to project their expected income, deductions, and credits for the entire current tax year. The primary tool for this process is IRS Form 1040-ES, “Estimated Tax for Individuals”. This form includes worksheets designed to guide taxpayers through the necessary calculations.
Here is a quick summary of the steps to calculate estimated taxes for retirees:
The first step in calculating estimated tax is to estimate total income from all taxable sources anticipated for the year.
Next, estimate any adjustments to income they may be eligible for, such as deductions for contributions to a traditional IRA (if applicable, for instance, for a non-working spouse), health savings account (HSA) contributions, and if self-employed, the deduction for one-half of their self-employment tax.
Following this, retirees need to estimate their deductions, deciding whether to take the standard deduction or to itemize deductions. Seniors who are age 65 or older may be entitled to a higher standard deduction.
Once total deductions are estimated, they are subtracted from the estimated adjusted gross income (AGI) to arrive at the estimated taxable income.
The next step involves calculating the estimated income tax based on the estimated taxable income and the applicable tax brackets for their filing status for the current tax year.
After estimating their total tax liability, retirees should then estimate any tax credits they may be eligible for, such as the Credit for the Elderly or the Disabled , or other credits like the retirement savings contributions credit (Saver’s Credit) if they are still contributing to retirement accounts. These credits directly reduce the amount of tax owed. The total estimated tax is then calculated by subtracting the total estimated tax credits from the total estimated tax liability.
Finally, retirees need to account for any anticipated tax withholding from sources like pensions, annuities, or Social Security benefits throughout the year. If the remaining tax liability, after subtracting withholding, is $1,000 or more, this is the estimated tax payment that will likely need to be made in four quarterly installments.
The worksheets included with the instructions for Form 1040-ES provide a structured framework to assist retirees in performing these calculations. Additionally, the IRS offers an online tool called the Tax Withholding Estimator, which can be particularly helpful for retirees in estimating the tax on their Social Security benefits and pension payments. Given the complexities involved, especially in the initial years of retirement or if a retiree’s financial situation is multifaceted, seeking guidance from a qualified tax advisor is highly recommended.
How do retirees pay their estimated taxes?
Estimated federal income taxes are generally due in four installments throughout the year :
Payment Period
Due Date
January 1–March 31
April 15
April 1–May 31
June 15
June 1–August 31
September 15
September 1–Dec. 31
January 15 of next year
Retirees have several options for paying their estimated federal income taxes to the IRS. One convenient method is IRS Direct Pay, which allows for electronic funds withdrawal directly from a checking or savings account without any fees. Payments can also be made using a debit card, credit card, or digital wallet through third-party payment processors authorized by the IRS, although these processors may charge a small convenience fee. For those who prefer traditional methods, payments can be made by mail by sending the Form 1040-ES payment voucher along with a check or money order payable to the U.S. Treasury to the address specified in the form instructions for their state.
Regardless of the payment method chosen, it is crucial to ensure that payments are made on time to avoid potential penalties for underpayment. Even if a retiree later overpays their taxes, penalties may still be assessed for underpayments made earlier in the year. While the standard payment schedule is quarterly, retirees have the option to pay more frequently, such as monthly or bi-weekly, as long as the total amount due for each quarter is paid by the respective deadline. This can aid in budgeting and managing cash flow throughout the year.
To summarize, understanding how to calculate and pay estimated federal taxes is a critical aspect of financial management for retirees. By determining whether estimated taxes are necessary, accurately calculating the estimated amount, paying on time through the various available methods, and exploring alternatives like adjusting withholding, retirees can fulfill their tax obligations effectively. Also, implementing smart tax planning strategies throughout retirement can potentially reduce their overall tax liability and simplify their tax management. Utilizing the wealth of resources provided by the IRS and considering professional advice when needed will empower retirees to navigate their tax responsibilities successfully and enjoy their retirement with greater financial peace of mind.
Please comment or send an email if you have any questions.
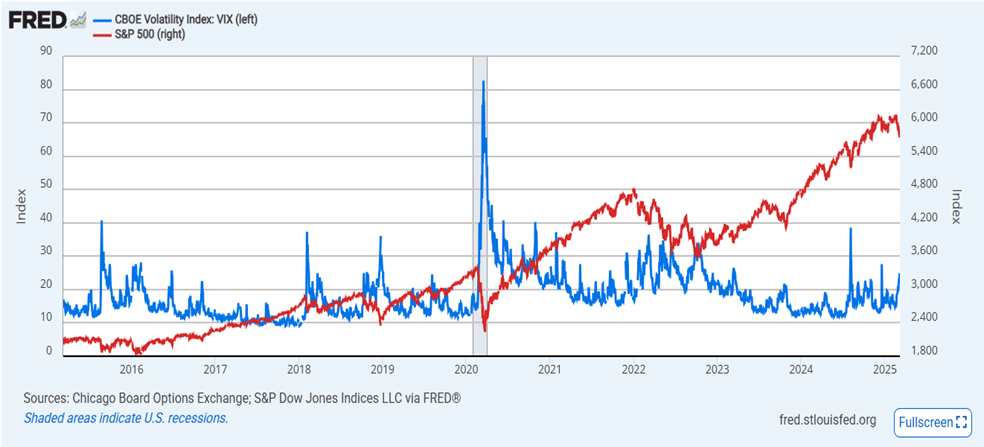
One of the metrics that I like to look at when assessing market risk is the CBOE Volatility Index, more commonly known as the VIX. The VIX measures the level of fear, anxiety, and/or uncertainty in the stock market. Technically, it looks at the options pricing of the S&P 500 index into the near future (about a month). When investors buy a lot of call options, meaning they expect the stock market to go up, the VIX drops. Conversely, when a lot of put options are bought, meaning people expect the stock market to drop, the VIX rises.
Of course, like everything else on Wall Street, there is a saying for the VIX: “When the VIX is high, it’s time to buy. When the VIX is low, look out below!” You’re probably thinking that this doesn’t make sense. A high VIX means there are a lot of pessimistic investors and so it would be bad for stocks. This is true but it is also true that the herd is usually wrong, so the VIX is normally interpreted as a contrarian indicator. This means when everyone is fearful, a high VIX, it’s probably not a bad time to buy stocks and vice versa.
Right now, we have a VIX of a little more than 26, a bit higher than what most investors consider a neutral VIX of 20. This makes sense because there is a lot of uncertainty in the market due to several of the current administration’s policies and there on again, off again status. I suspect that it will stay elevated until the chaos and confusion coming out of D.C. subsides.
An elevated VIX typically brings larger swings in stock market prices. For equity investors with a time horizon of three years or more, this volatility isn’t a big deal, as the major market indices have always trended up over time. For those with a shorter time period, they should have the money that they need in the near-term out of the stock market.
Using the VIX as part of your big picture view of the market’s risk is a useful data point to help with your portfolio management.
Please comment or send an email if you have any questions. Thanks!
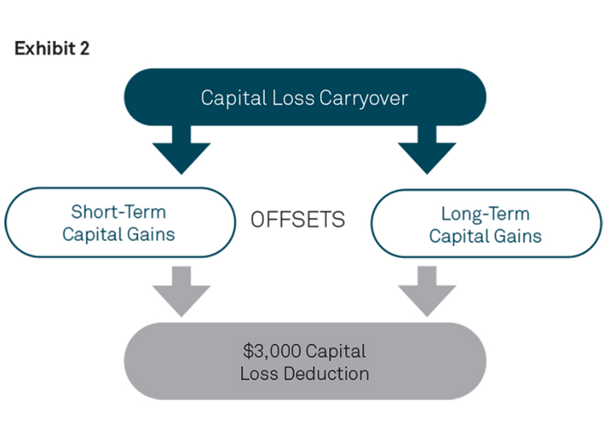
Most investors may not have to worry about capital loss carryover when filing their 2024 federal income taxes since the last two years have been extremely profitable for them. However, because 2022 was such a bad year for the markets, many investors who sold back then may have had more capital losses than capital gains for that year. The good news is that they could have used those excess losses to reduce their capital gains in 2023 and even some of their ordinary income (up to $3,000). If there were still losses left over, they can be used towards offsetting any realized capital gains in 2024 as well as $3,000 of ordinary income.
Capital loss carryover is a tax rule that lets you use investment losses from one year to reduce your taxable income in future years. Before going any further, keep in mind that this rule only applies to taxable accounts, not retirement accounts, such as IRAs.
Here’s how it works:
1. Calculating your net capital loss:
First, you need to calculate your net capital loss for the year. This is the difference between your capital gains (money you made on investments) and your capital losses (money you lost on investments). If it’s less than zero, meaning you have more losses than gains, you can offset some of your income.
You can only deduct up to a certain amount of net capital losses in a single year. This limit is currently $3,000.
2. Carryover of unused losses:
If your net capital loss is greater than the allowable deduction ($3,000), the unused portion automatically carries over to future tax years.
There is no time limit to how long you can carry over capital losses.
You can use the carryover to:
(1) Offset capital gains in future years.
(2) Deduct up to $3,000 against your ordinary income in future years.
3. Applying the carryover:
Each year, you calculate your net capital loss again, considering any new gains and losses.
You can use your current year’s net capital loss first to offset any capital gains you have.
Then, you can apply any remaining unused carryover from previous years to further reduce your taxable income.
4. Important points to remember:
Capital losses are categorized as short-term or long-term based on how long you held the investment before selling. Short-term losses can only offset short-term gains, while long-term losses can offset both short-term and long-term gains.
Wash sales are a strategy where you sell an investment at a loss and then repurchase it shortly after. This is generally not allowed and can prevent you from claiming the capital loss.
It’s important to keep accurate records of your capital gains and losses for tax purposes.
Here’s an example:
In 2022, you had $10,000 in capital losses and no capital gains. You deducted $3,000 of your losses to offset your ordinary income, and the remaining $7,000 carried over to 2023. In 2023, you had $3,000 in capital gains. You can first use your $7,000 loss carryover to completely offset these gains. You then have $4,000 remaining in your carryover that you can offset $3,000 of your ordinary income with, leaving you with $1,000 capital loss carryover to use to offset any gains in 2024.
I hope this explanation helps. Remember, it’s always a good idea to consult with a tax professional for advice specific to your situation.
Please comment or send an email if you have any questions. Thanks!
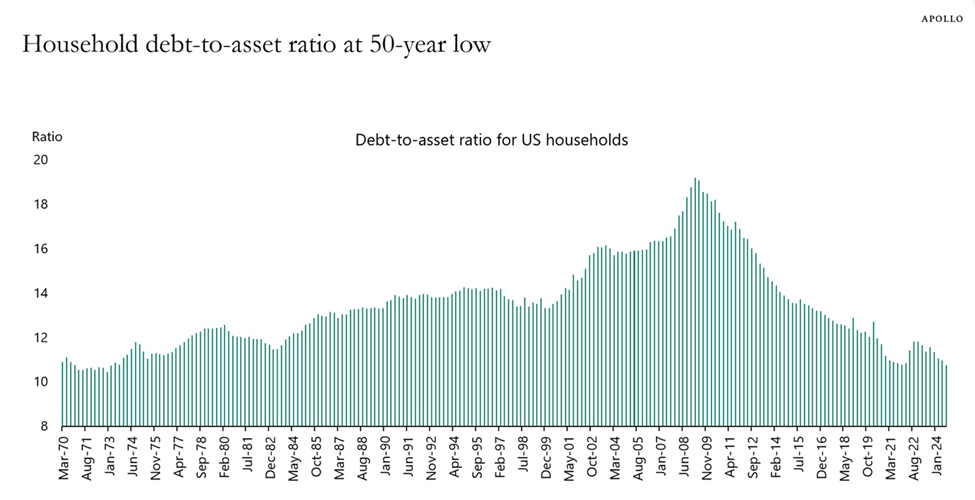
Financially speaking, U.S. households are looking strong heading into 2025. In fact, they have never looked better. Just check out the following chart to see how we are doing compared to the last 50 years:
Source: Federal Reserve, Haver Analytics, Apollo Chief Economist
As you can see, we have come quite a long way from the Great Financial Crisis era in 2008/2009 and are at levels that we haven’t seen since the early 1970’s. There are a few key reasons for such a strong showing:
Home prices have increased at a much faster rate over the past fifteen years than in the past. This has improved the asset side of the balance sheet.
More homes are now owned outright (no mortgage) or have mortgages at a 3% rate or lower than ever before. This has helped reduce household debt quite a bit.
Stellar stock market returns over the past two years have bolstered people’s retirement and investment accounts, thereby increasing their assets and subsequently, their net worth.
Can it keep going?
It’s possible. We still have a shortage of housing which will keep upward pressure on home prices. But mortgage rates are still relatively high which could increase the debt side of the balance sheet of new homeowners.
Regarding stocks, history is on our side. For instance, the S&P 500 has a history of delivering strong gains following two consecutive years of 20%+ gains, which we just had. Since 1950, there have been eight instances where the S&P 500 index has risen by 20% or more for two consecutive years. In six of those cases, the U.S. stock market achieved positive returns in the third year, with an average return of 12%.
Obviously, it’s always tough to predict what’s going to happen over the course of the next year but it’s good to know that we are in a great position now, regardless of what the future holds.
Please comment or send an email if you have any questions.