Are You A Trader or An Investor?

Since November of last year, the S&P 500 index has risen steadily, with just a handful of weeks with negative returns. So, you may be asking yourself if stocks have gone up too far, too fast and are ripe for a pullback. If you are good at timing the market, this may seem like a good time to take some chips off the table. I recently talked about timing the market and you can check that out here: Sell In May And Go Away?

But before you do anything, you should ask yourself this question: Are you a trader or an investor?

Traders and investors both deal with buying and selling financial assets, but they have different goals and timeframes. Here’s a breakdown of the key differences:

Timeframe:

  • Trader: Focuses on short-term gains, buying and selling assets within a short period, like seconds, days, or weeks. This is often called short-term trading or day trading.
  • Investor: Has a long-term perspective, buying and holding assets for years or even decades. They aim to grow their wealth through the overall appreciation of the assets and potentially through dividends (regular payments from companies to shareholders).

Goal:

  • Trader: Aims to capitalize on short-term market movements and price fluctuations. They may be more concerned with technical analysis, looking for patterns in charts and trading data.
  • Investor: Focuses on the underlying value of the asset and the company’s potential for long-term growth. They rely more on fundamental analysis, researching a company’s financials and overall economic conditions.

Effort:

  • Trader: Trading can be a very active process, requiring constant monitoring of markets and frequent buying and selling decisions.
  • Investor: Investing can be more passive, requiring less day-to-day attention. Investors may periodically rebalance their portfolio, but generally don’t need to be glued to the markets.

Risk:

  • Trader: Short-term trading can be riskier, as markets can be volatile and unpredictable.
  • Investor: Long-term investing is generally considered less risky, as history shows the stock market tends to trend upwards over time. However, there are still risks involved, such as economic downturns.

There are many people, me included, who operate as both a trader and an investor. For me, I have trader accounts and investor accounts. My retirement accounts are considered my investor accounts. I also have a small trader account that I manage as well.

For traders, this probably is a good time to take some profits and get some cash ready to make buys after the eventual dip that’s coming since stocks seem over bought currently. Traders can also buy put options (insurance of sorts) to protect their gains without having to sell their existing positions.

For investors, the current state of the markets shouldn’t influence your long-term strategy. If you are holding well-managed companies with strong financials in growing industries and high barriers to entry (wide moat), you stay the course. If their stock prices drop on the eventual pullback, you buy more.

Now, you can categorize your accounts based on how you manage them, as a trader or as an investor.

Finally, just as a reminder, if you need money for something in the immediate future, it should be in an emergency reserve account, like a money market, savings, or checking account.

Please comment or send an email if you have any questions.

Joe Baker, CFP®

Baker Asset Management, LLC

joebaker@bakerassemanagement.com
Must See Stock Charts During Presidential Election Years

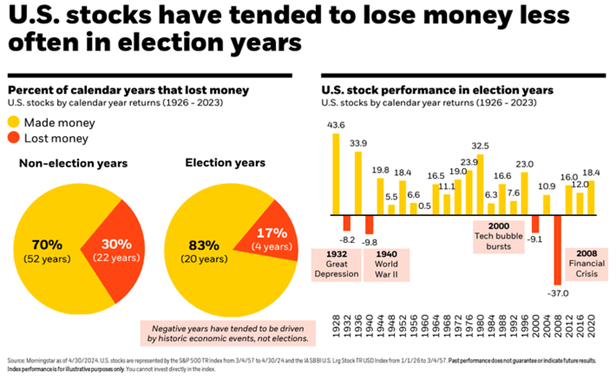
I saw some interesting charts in the past week that illustrate stock performance in a presidential election year.

First, in the chart above, you can see that stocks have performed well in past presidential election years. The four years that stocks had negative returns included some very significant economic and geopolitical events that contributed to their poor performance.

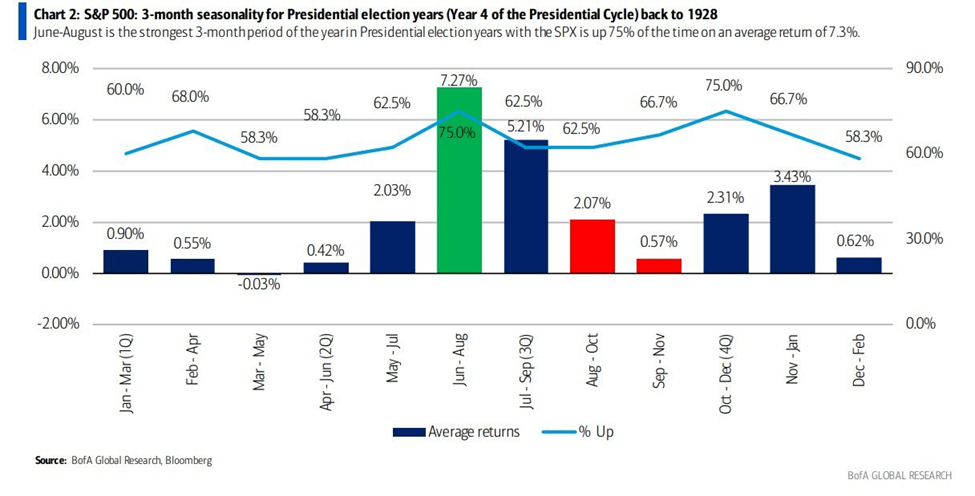
This next chart shows how stocks performed during every rolling three month stretch in an election year going all the way back to 1928. As you can see, the June, July, and August stretch is the best performing with a positive return 75% of the time and an average return of almost 7.3%.

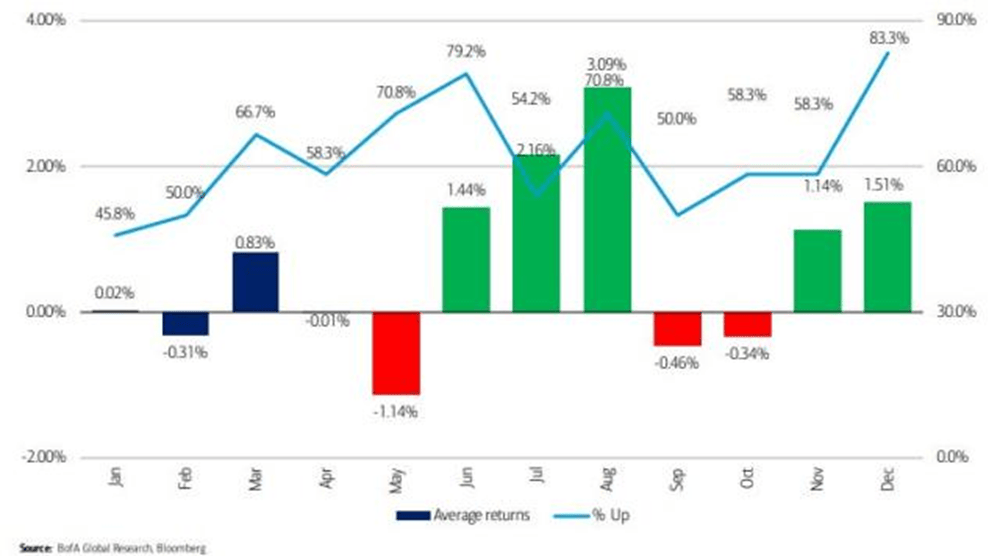
The last chart simply shows the performance of stocks during each month of a presidential election year going back to 1928.

So, it seems that summertime is the best time to be invested in the stock market during a presidential election year. However, we are currently at or near all-time highs in most stock indices and appear to be ripe for a pullback in stock prices. It will be interesting to see if this historical trend can hold up with such a positive return in stocks preceding it over the last eighteen months.

Please comment or send an email if you have any questions.

Joe Baker, CFP®

Baker Asset Management, LLC

joebaker@bakerassemanagement.com
Sell In May And Go Away?

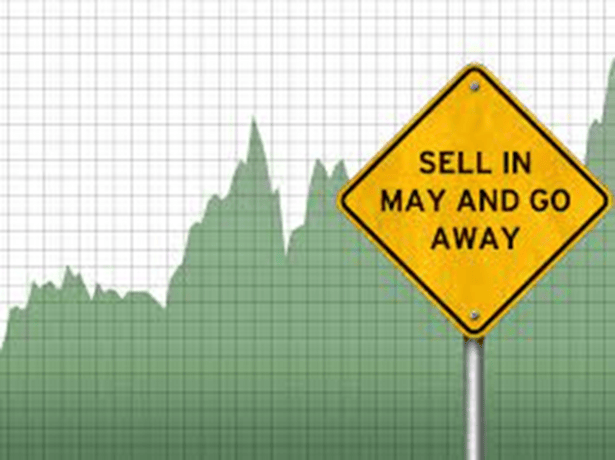
Sell in May and go away is an old Wall Street saying that is the basis for a market-timing investment strategy which calls for you to sell your stock holdings right before summer and buy them back in late fall, or right before Memorial Day and right after Halloween.

Historically, the S&P 500 has performed better during the winter months than in the summer months. So, there is evidence that this strategy could work, but we are really Monday-morning quarterbacking here. In reality, you have to be very good at timing the market not once, but twice every year! You have to pick when to sell and then you have to pick when to buy back in. Plus, you have to consider your holdings’ short-term versus long-term gains and losses as well as the associated tax ramifications.

I don’t know of anyone or any firm that has been able to do this successfully for an extended period of time.

So, whenever I hear the “Sell in May and go away” adage, I like to think of another old Wall Street saying: Time in the market, not timing the market. This means relying on a strategy where you don’t try to guess when the market is at its lowest or highest point. Instead, you invest knowing that your timing is probably going to be off, but that eventually, investing in great companies with strong fundamentals matters more than the timing.

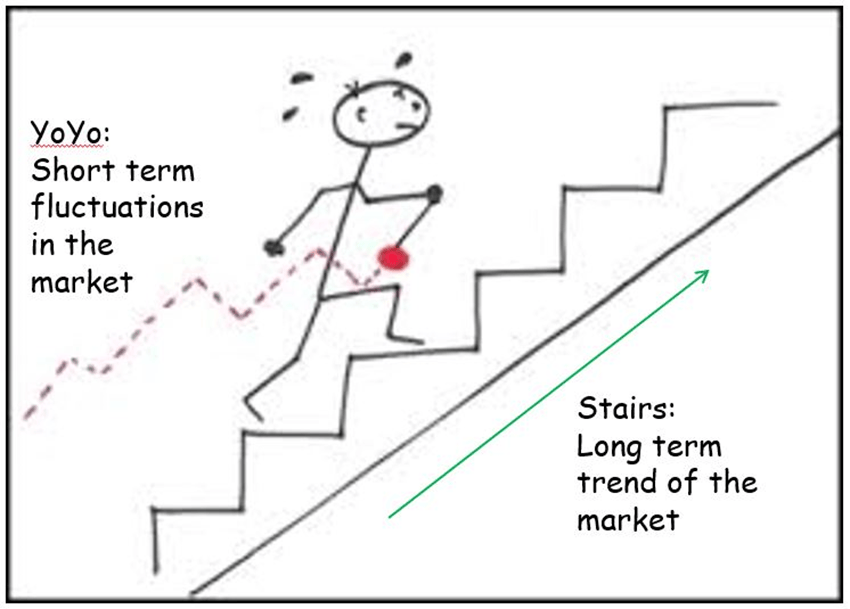
Now is when I roll out my favorite illustration to show why time in the market is better than timing the market for investors.

Picture the movement of the yo-yo as the short-term fluctuations of the stock market and the guy walking up the stairs as the long-term trend of the market. The market has its ups and downs, but over time, has consistently moved higher. This is a simple, but effective, way to illustrate why time in the market is better than timing the market.

Please comment or send an email if you have any questions. Have a great Memorial Day weekend!

Joe Baker, CFP®

Baker Asset Management, LLC

joebaker@bakerassemanagement.com
Monthly Update – May 2024

Calendar Notes

  • Saturday, May 4th, Kentucky Derby
  • Monday, May 27th, Memorial Day. The stock market is closed.

Stocks finally took a breather in April after a five-month run of positive returns. It’s always healthy for the markets to take a break and consolidate to form another base before moving higher again. So, this break in the upward trend is not surprising, but still not fun to watch if you are long stocks. For the month, the S&P 500 was lower by about 4.20%. For 2024, it is up about 5.57%.

Q1 earnings continue to pour in and, for the most part, have been exceeding expectations, supporting the strong economic data that we have seen so far this year. Of course, earnings reports are looking into the past and it is what companies say about future growth that really moves their stock prices. The good news here is that CEOs are signaling that strong revenue growth should continue, although they are concerned about interest rates staying elevated.

Historically, May has been a month where many traders, or short-term investors, like to prepare their portfolios for the summer. Like the saying goes, sell in May and go away. We will see if that holds true this month.

The Federal Reserve met today and held rates steady once again. They are certainly testing the patience of both stock and bond investors, but so far, their stance hasn’t broken the economic momentum that we have seen over the past year (yet).

Take a look at the Outlook section below to see what events could move the markets over the short term.

Bond prices continue to flip flop, this time heading lower during the month of April. This drop was mainly due to the continued signs of a strong economy and inflation remaining sticky in certain areas, such as food and fuel. This is certainly causing the Fed to rethink when they want to start cutting back on interest rates.

The 10-year US Treasury note yield rose in April, finishing the month at 4.69%, higher than the 4.21% that it was at the beginning of the month. The 30-year bond yield closed out the month at 4.79%, higher than the 4.35% that it was a month ago.

Although the path of interest rates still appears to be in the downward direction, it is not a given. Therefore, bond buyers should continue to focus on bonds with short-term maturities. I would keep maturities under 18 months and just plan on holding these bonds to maturity. That way, you won’t have to worry about selling at a discount if interest rates head higher.

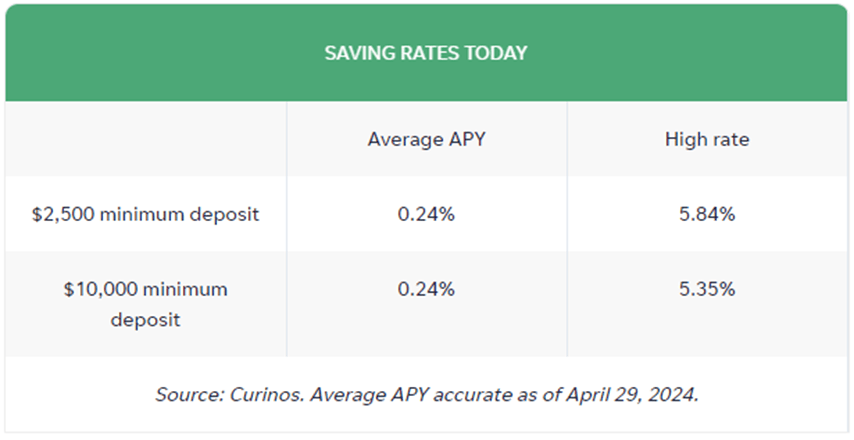
Savings rates stayed about the same in April as compared to March, even as other rates moved higher. But this is expected because savings rates typically follow, but lag, the direction of bond yields. These current savings rates are still quite high, especially with respect to inflation. So, CDs and MMAs continue to be agreat place to park your cash and your emergency fund. These rates continue to be a legitimate alternative to stocks and bonds and will keep pressure on those markets until we see this trend reverse, which looks like it will be happening later in the year than expected.

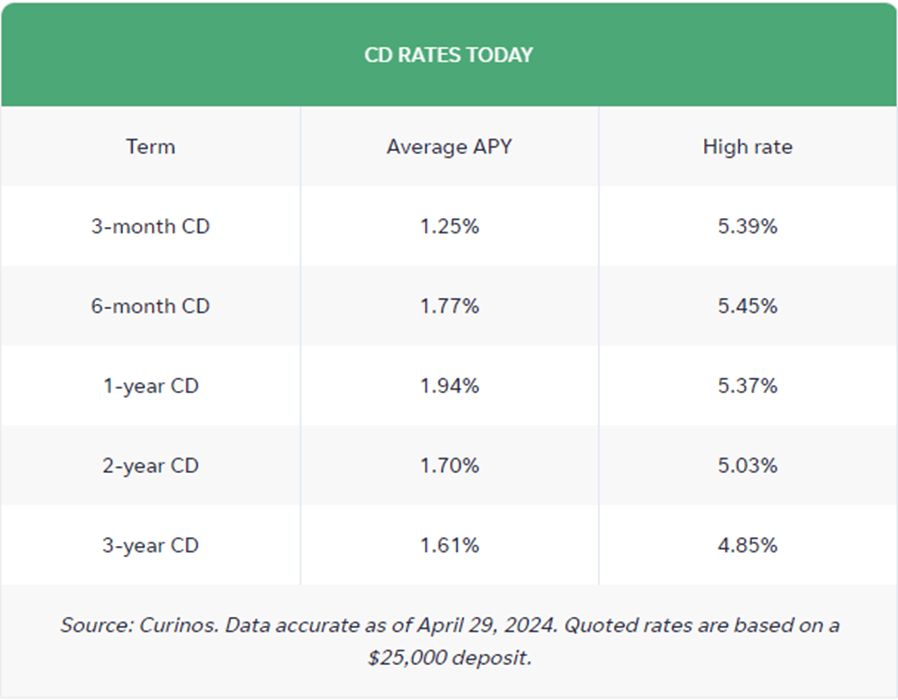
Now, take a look at the top rates for CDs and money market accounts (MMA):

The best 1-year CD interest rate is currently at 5.37%. The best 5-year CD rate right now is around 5.25%. We should see the 5-year CD rate surpass the 1-year rate by the end of the year based on current interest rate trends.

Eventually, savings rates will normalize but not until inflation comes down enough for the Fed to feel comfortable lowering interest rates. That said, I would still put my savings or emergency spending money into short-term CDs, 1 year or less, and reevaluate when they mature. If you would rather have more liquidity, look into an MMA (yielding close to 6% currently). Keep the total under $250,000 per person at any one bank to ensure you are fully covered by the FDIC. CDs and MMAs have become nice alternatives for risk-averse investors and have drawn money away from stocks because of their realtively high rates that carry virtually no risk.

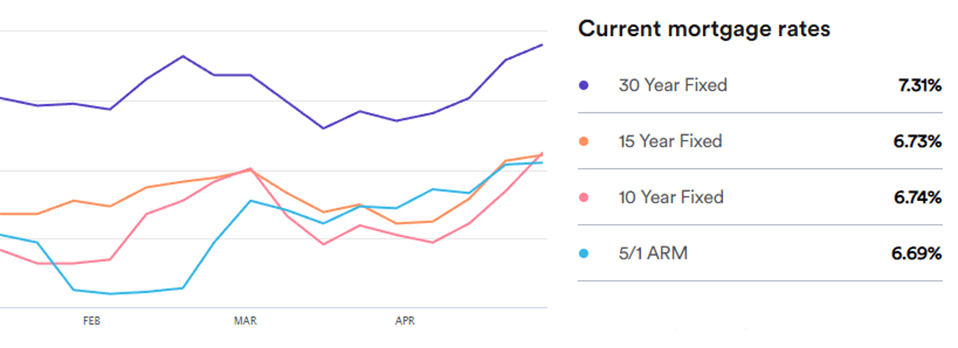
Mortgage rates rose in April as demand picked up most likely due to the spring buying season starting up. Currently, the 30-year rate sits at 7.31%, higher than a month ago, at 7.20%. The housing market continues to be in an unusual situation (high rates, low home inventory, strong demand) and that is making mortgage rates very volatile. Most homeowners either own their home outright or have a mortgage below 3.5%. There is very little incentive to sell a home with rates where they are right now. That will not change until mortgage rates fall. For now, the industry continues to bank on the Federal Reserve to get it squared away.

Oil prices broke their upward moving trend and dropped slightly in April, snapping a three-month streak. The drop could be attributed to the strong dollar due to rates in the U.S. staying higher, causing demand for the dollar worldwide, thus making imported oil cheaper.

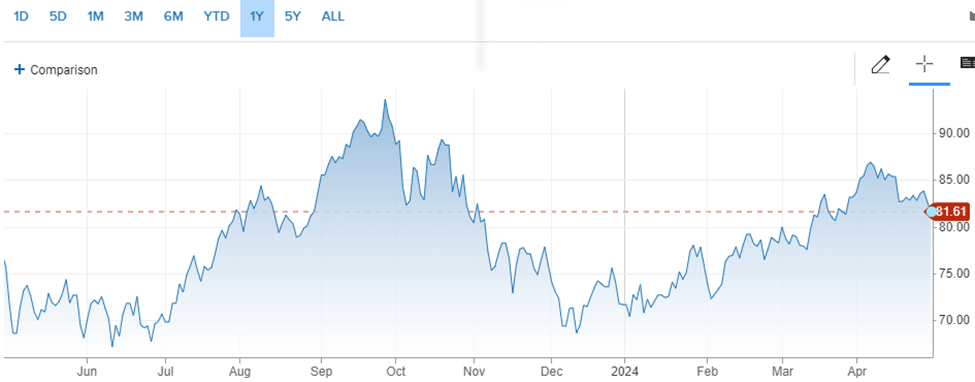
For the month, the price for a barrel of oil settled at $81.61, down from $83.17 at the beginning of April. For the year, it is up about 14%. Although oil prices fell, they are still high and are a big cause of the stubborn inflation that we are seeing in consumer prices, especially in the food and travel/leisure industries. It could be tough to get prices lower with economies worldwide continuing to chug along at a strong pace. It is a quandary that might be resolved only through demand destruction, or put another way, the cure for high oil prices is high oil prices.

Here’s a look at the one-year chart for U.S. oil:

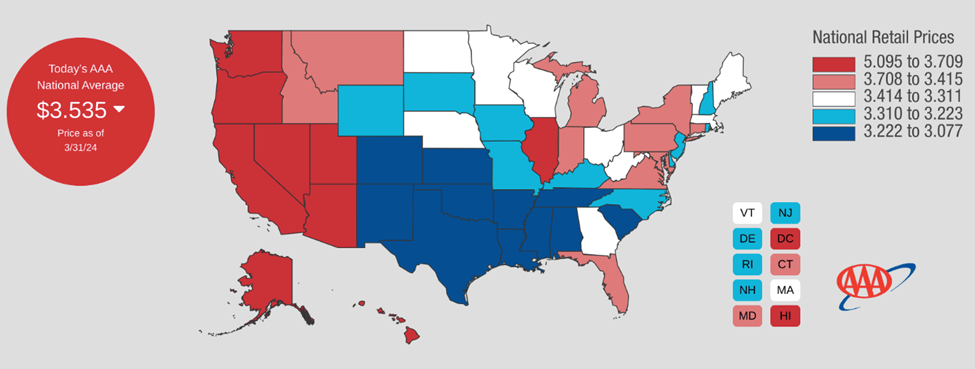
Gasoline prices headed higher again in April. Regular unleaded gasoline is now averaging $3.66 per gallon, up from $3.54 last month. Mississippi has the cheapest gas currently, checking in at $3.10 a gallon. California has the most expensive gasoline at $5.39 per gallon. FYI, a year ago, we were paying $3.61.

Check out the prices at the pump in your area: AAA Gas Prices.

Outlook

Events on the horizon that could move the markets in the near term:

Fed & Inflation: The Fed concluded their scheduled two-day meeting today and kept rates unchanged. They really don’t have a choice: unemployment is at historic lows and wages continue to rise. Both good things but too good, according to the Fed. Although prices have stabilized, especially for groceries, they just haven’t seen enough progress to justify cutting rates anytime soon. They feel what they have done so far is working, but not quite at the pace that they want so it looks like interest rates are going to remain high through at least the summer. Good news for savers, bad news for borrowers. For stock market investors, rate cuts aren’t fully priced into the market anymore so when it does happen, it will be a positive catalyst for stocks, but patience is warranted here.

Joe Baker, CFP®

Baker Asset Management, LLC

joebaker@bakerassetmanagement.com

Your Balance Sheet Is Looking Good!

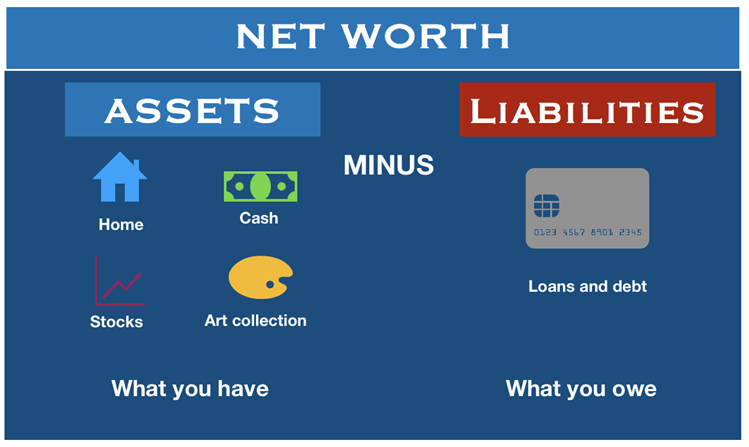
Just like for a company, the balance sheet is one of the most important financial statements that a household can use to monitor its financial health. Put simply, it is a snapshot of your net worth, which is just your assets (stuff you own like your home, stocks, retirement plans, etc.) minus your liabilities (stuff you owe like mortgages, credit card debt, student loans, etc.).

Recently, households in the U.S. have been getting healthier financially than at almost any other time in history. In fact, if you look at homeowners, about 39% have no mortgage and roughly 85% of homeowners that do have a mortgage, their mortgage rate is under 3.5%. When you couple this low amount of debt with all-time highs in the stock market, historically low unemployment, and decent wage growth, household net worth has never looked better.

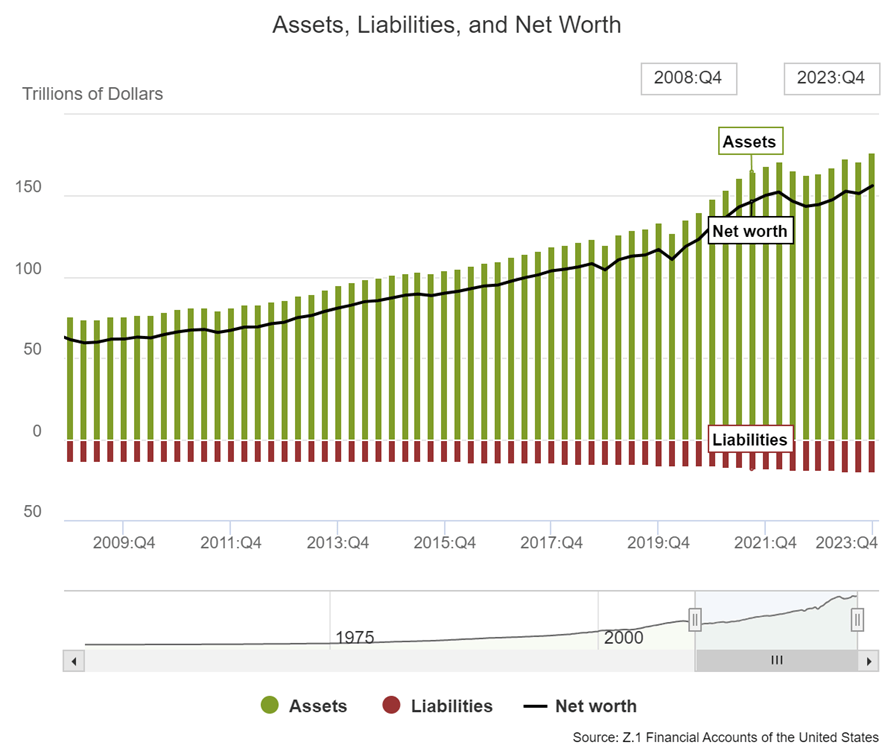
Here are a few charts that illustrate this topic more clearly:

In the chart above, you can see that since the great financial crisis, household net worth has consistently grown over the last fifteen years.

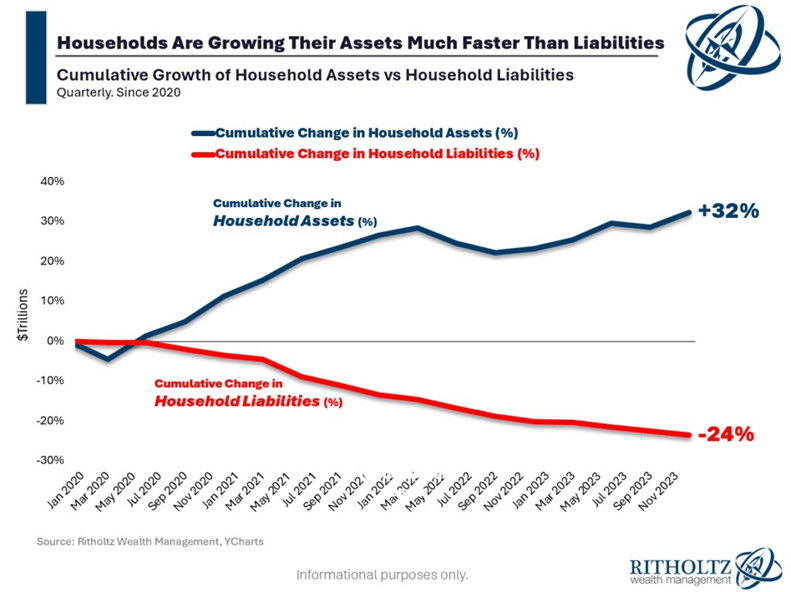
In this illustration, a more recent time period (from the pandemic in 2020 until the end of last year, 2023) shows the significant growth of household assets over the last three years while liabilities have dropped quite a bit.

Of course, the economic picture isn’t as rosy as it appears. There are some under currents to consider despite this encouraging data:

  • There is still significant wealth inequality. The top 1% hold a much larger share of the total wealth compared to the bottom 50% [Pew Research Center]. This falls under the old saying that “The rich get richer”.
  • Stubborn inflation could deplete some of the assets of households as they try to continue their same lifestyle without adjusting their spending habits for inflation.

For most households, things are looking pretty good, financially. If we can win the battle with inflation, we’ll see interest rates head lower, which will benefit the economy even more.

Please comment or send an email if you have any questions. Thanks!

Joe Baker, CFP®

Baker Asset Management, LLC

joebaker@bakerassemanagement.com
Two Most Important Factors To Consider When Choosing SS Benefits Age

Social security retirement benefits provide a major source of income for most retirees in the U.S. In fact, about 40% of retirees rely solely on social security income. So, it is important to know when to start taking it to maximize your benefit. The decision is basically a bet with the government on how long you are going to live. Therefore, like any bet, you should gather as much information as possible to move the odds in your favor.

Here’s what I consider are the two most important factors that you should consider before deciding when to start taking social security:

  • Financial Needs: This should be looked at first because if you need the money, you can stop the analysis and just take the money at age 62. If you’re not sure, then the next step is to consider your retirement income sources. If you have a 401k, IRA, pension, savings, or plan to keep working, you might be able to delay benefits. However, if you plan on relying heavily on Social Security, starting benefits earlier could be necessary. If you can swing it, it definitely pays to wait, because your benefit increases by about 8% for every year you wait. That’s a huge difference in payments, especially extrapolating it out over twenty years or more.
  • Life Expectancy: So, if you decided that you don’t need the money at age 62, then you need to analyze what your expected lifespan will be. If you have a family history of longevity, delaying benefits might be wise to maximize the total amount you receive over your lifetime. Conversely, if you have health concerns or a shorter life expectancy, taking benefits earlier ensures you get more money while you can.

I have run the numbers for a bunch of people with all different scenarios and I have found that the breakeven point for most people is between ten and twelve years. This is the number of years that it would take for the total of your payments starting at age 70 to equal the total payments received if started at age 62. That means if you think that you’ll live to 85 (15 years past age 70), which is the age that you receive the maximum benefit, then you should delay taking benefits until age 70 in order to get the most money over your lifetime.

You also want to consider if you want that extra income while you are younger, to use for things, such as traveling, that you might not be able to do when older.

If you’re still not sure what to do after looking at the two factors above, here are some additional things to consider as well:

  • Work Status: If you continue working past your full retirement age (age 67 for anyone born after 1960), your benefits might be reduced until you reach FRA. However, your benefit amount will be recalculated later to include those working years.
  • Marital Status: Married couples have additional considerations. The benefit you receive might depend on your spouse’s earnings history and claiming decisions.
  • Tax implications: Social Security benefits can be taxed depending on your total income. Here’s the details: http://www.ssa.gov/planners/taxes.html
  • Healthcare coverage: If you retire before 65, you might lose employer-provided health insurance and need to consider alternatives.

Everyone’s situation is unique, so it is worth it to take the time and figure out the best strategy to maximize your social security retirement benefit. By weighing the factors listed above and using the resources available on the Social Security Administration’s website, www.ssa.gov, you can make an informed decision about when to claim your Social Security benefits.

Please comment or send an email if you have any questions. Thanks!

Joe Baker, CFP®

Baker Asset Management, LLC

joebaker@bakerassemanagement.com
Don’t Forget About Your Capital Loss Carryover When Filing Your Taxes This Year

Because 2022 was such a bad year for the stock market, many investors who sold stocks back then had more capital losses than capital gains for that year. The good news is that they can use those excess losses to reduce their capital gains in 2023 and even some of their ordinary income (up to $3,000).

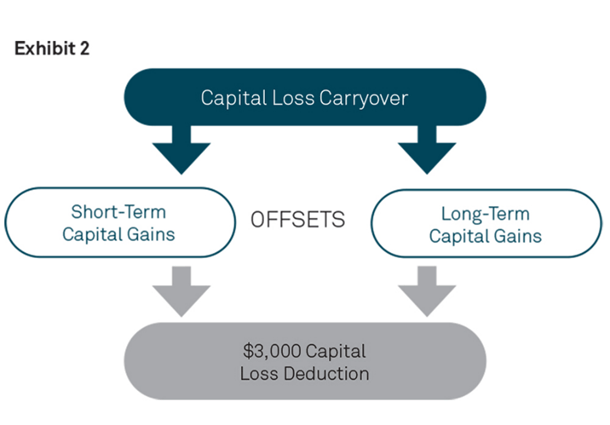
Capital loss carryover is a tax rule that lets you use investment losses from one year to reduce your taxable income in future years. Before going any further, keep in mind that this rule only applies to taxable accounts, not retirement accounts, such as IRAs.

Here’s how it works:

1. Calculating your net capital loss:

  • First, you need to calculate your net capital loss for the year. This is the difference between your capital gains (money you made on investments) and your capital losses (money you lost on investments).
  • You can only deduct up to a certain amount of net capital losses in a single year. This limit is currently $3,000.

2. Carryover of unused losses:

  • If your net capital loss is greater than the allowable deduction ($3,000), the unused portion automatically carries over to future tax years.
  • There is no time limit to how long you can carry over capital losses.
  • You can use the carryover to:

o Offset capital gains in future years.

o Deduct up to $3,000 against your ordinary income in future years.

3. Applying the carryover:

  • Each year, you calculate your net capital loss again, considering any new gains and losses.
  • You can use your current year’s net capital loss first to offset any capital gains you have.
  • Then, you can apply any remaining unused carryover from previous years to further reduce your taxable income.

4. Important points to remember:

  • Capital losses are categorized as short-term or long-term based on how long you held the investment before selling. Short-term losses can only offset short-term gains, while long-term losses can offset both short-term and long-term gains.
  • Wash sales are a strategy where you sell an investment at a loss and then repurchase it shortly after. This is generally not allowed and can prevent you from claiming the capital loss.
  • It’s important to keep accurate records of your capital gains and losses for tax purposes.

Here’s an example:

In 2022, you had $5,000 in capital losses and no capital gains. You deducted $3,000 of your losses to offset your ordinary income, and the remaining $2,000 carried over to 2023. In 2023, you had $1,000 in capital gains. You can first use your $2,000 carryover to completely offset these gains. You then have $1,000 remaining in your carryover that you can offset your ordinary income with, thus using up all of your capital loss carryover.

I hope this explanation helps. Remember, it’s always a good idea to consult with a tax professional for advice specific to your situation.

Please comment or send an email if you have any questions. Thanks!

Joe Baker, CFP®
Baker Asset Management, LLC
joebaker@bakerassemanagement.com

How Stocks Perform In Presidential Election Years

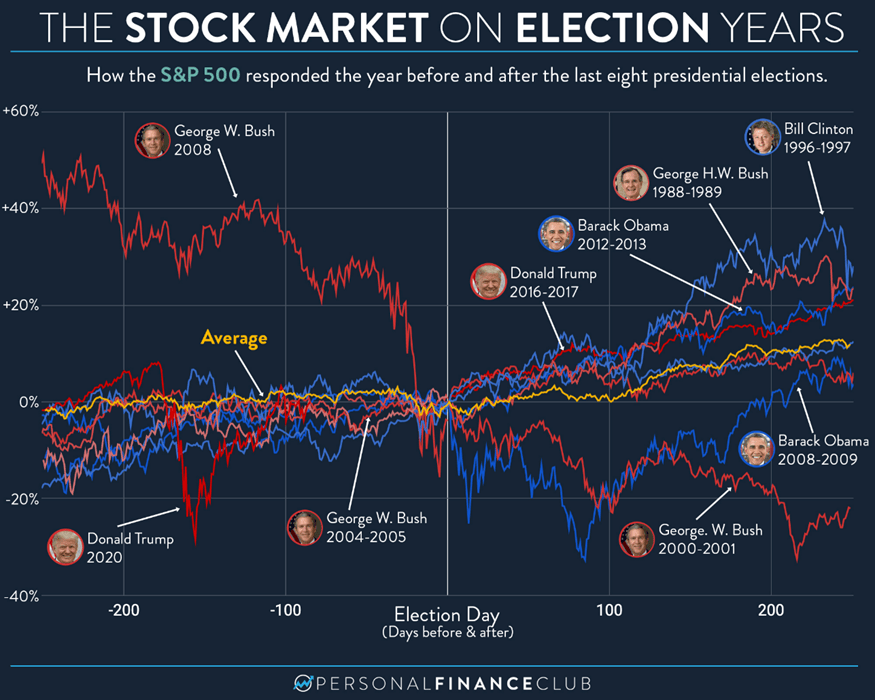
Besides interest rates and The Federal Reserve, stock market volatility is going to be heavily influenced by the presidential election this November. And it’s not going to wait until Fall. Headlines are going to be filled with polls, debates, and trials from now until election day (and beyond, I’m sure). I have always felt that elections are just short-term catalysts, both positive and negative, for stocks and Presidents don’t really have an affect on stock prices. It will still hold true this year. However, I suspect there will be much more volatility due to politics than normal, especially with addition of the Trump trials to the landscape.

So, let’s take a look at how markets have performed historically in a presidential election year:

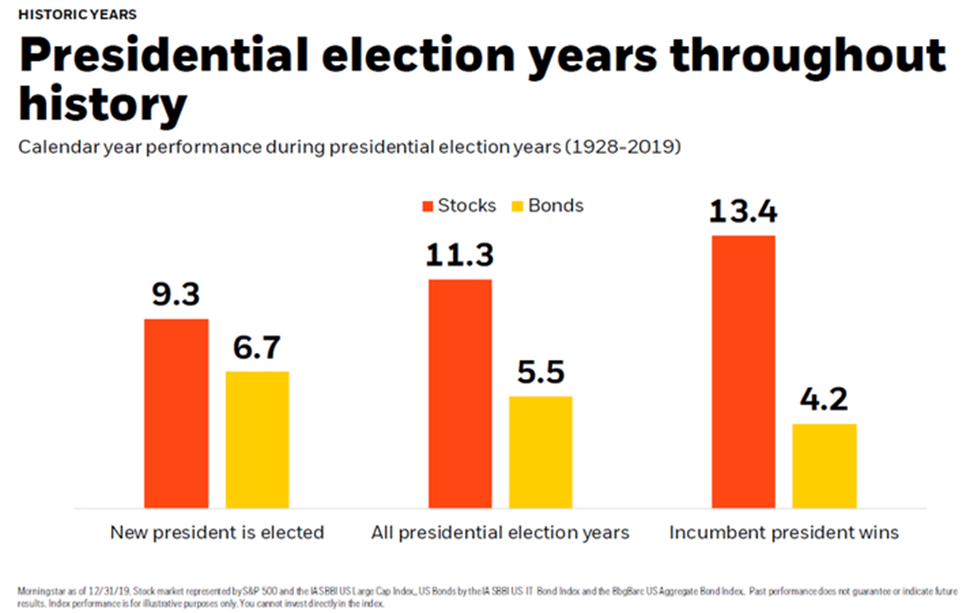
  • Historically, the S&P 500 has averaged a 7% gain during U.S. presidential election years since 1952. This is lower than the average annual gain of around 10% but still positive.
  • Re-election years: Markets tend to perform better in re-election years (such as this year), with the S&P 500 averaging a 12.2% gain since 1952. This could be due to an incumbent president’s focus on maintaining stability and avoiding major policy changes.
  • Party control: The party in control of Congress doesn’t seem to have a significant impact on market performance. However, major policy changes proposed by either party can cause uncertainty and volatility.
  • Economic conditions: The overall health of the economy has a much stronger influence on the stock market than the election itself. Strong economic growth and low inflation are typically associated with positive market returns.

Historically, stocks perform the best when an incumbent president wins and the opposite party controls at least one  section of Congress, either the House of Representatives or the Senate. But this shouldn’t influence your investment strategy for the long term. Holding high-quality, well-run companies will serve you well regardless of the political climate.

Please comment or send an email if you have any questions.

Joe Baker, CFP®

Baker Asset Management, LLC

joebaker@bakerassetmanagement.com