A new rule regarding FDIC insurance for trust accounts became effective on April 1, 2024, that could impact anyone with a trust account held at an FDIC-member bank. The new rule simplifies insurance coverage for trust accounts by:
Reducing the number of insurance rules for trust accounts
Eliminating complexities from the revocable and irrevocable trust rules
Utilizing the same familiar, straightforward insurance calculation for both revocable and irrevocable trusts
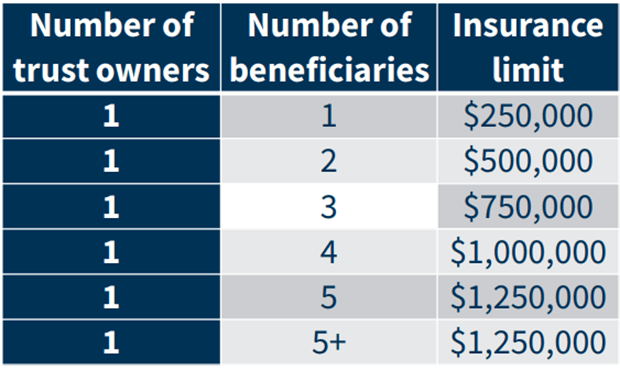
The new rule provides insurance of a trust account(s) of $250,000 per beneficiary, for up to five beneficiaries, for a total of $1,250,000.
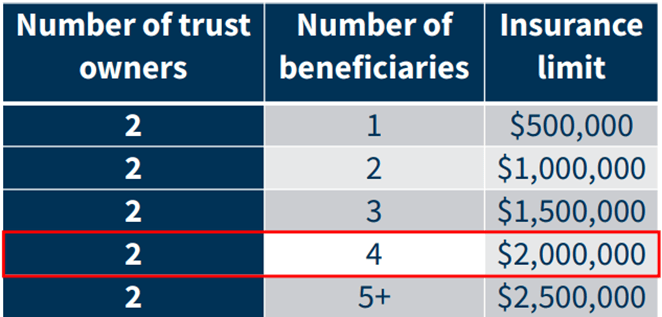
This is per each trust owner for each bank. However, many trusts have multiple owners. So, for example, if you own a trust with your spouse (two owners) and the trust has four beneficiaries, FDIC insures up to $2,000,000 (2 owners x 4 beneficiaries x $250,000).
It’s important to note that $1,250,000 remains the maximum insurance, per bank, for a single owner, regardless of how many trusts and/or beneficiaries that they have at that particular bank. That means if a person has, say, a revocable living trust and an irrevocable charitable trust, those trusts are combined to determine how much the owner is insured for those combined assets.
Although this new rule was enacted to simplify the FDIC insurance rules regarding trust accounts, it still has its complexities. I would definitely recommend working with your financial advisers to maximize coverage for your financial assets.
Please comment or send an email if you have any questions. Thanks!
Monday, May 27th, Memorial Day. The stock market is closed.
Stocks finally took a breather in April after a five-month run of positive returns. It’s always healthy for the markets to take a break and consolidate to form another base before moving higher again. So, this break in the upward trend is not surprising, but still not fun to watch if you are long stocks. For the month, the S&P 500 was lower by about 4.20%. For 2024, it is up about 5.57%.
Q1 earnings continue to pour in and, for the most part, have been exceeding expectations, supporting the strong economic data that we have seen so far this year. Of course, earnings reports are looking into the past and it is what companies say about future growth that really moves their stock prices. The good news here is that CEOs are signaling that strong revenue growth should continue, although they are concerned about interest rates staying elevated.
Historically, May has been a month where many traders, or short-term investors, like to prepare their portfolios for the summer. Like the saying goes, sell in May and go away. We will see if that holds true this month.
The Federal Reserve met today and held rates steady once again. They are certainly testing the patience of both stock and bond investors, but so far, their stance hasn’t broken the economic momentum that we have seen over the past year (yet).
Take a look at the Outlook section below to see what events could move the markets over the short term.
Bond prices continue to flip flop, this time heading lower during the month of April. This drop was mainly due to the continued signs of a strong economy and inflation remaining sticky in certain areas, such as food and fuel. This is certainly causing the Fed to rethink when they want to start cutting back on interest rates.
The 10-year US Treasury note yield rose in April, finishing the month at 4.69%, higher than the 4.21% that it was at the beginning of the month. The 30-year bond yield closed out the month at 4.79%, higher than the 4.35% that it was a month ago.
Although the path of interest rates still appears to be in the downward direction, it is not a given. Therefore, bond buyers should continue to focus on bonds with short-term maturities. I would keep maturities under 18 months and just plan on holding these bonds to maturity. That way, you won’t have to worry about selling at a discount if interest rates head higher.
Savings rates stayed about the same in April as compared to March, even as other rates moved higher. But this is expected because savings rates typically follow, but lag, the direction of bond yields. These current savings rates are still quite high, especially with respect to inflation. So, CDs and MMAs continue to be agreat place to park your cash and your emergency fund. These rates continue to be a legitimate alternative to stocks and bonds and will keep pressure on those markets until we see this trend reverse, which looks like it will be happening later in the year than expected.
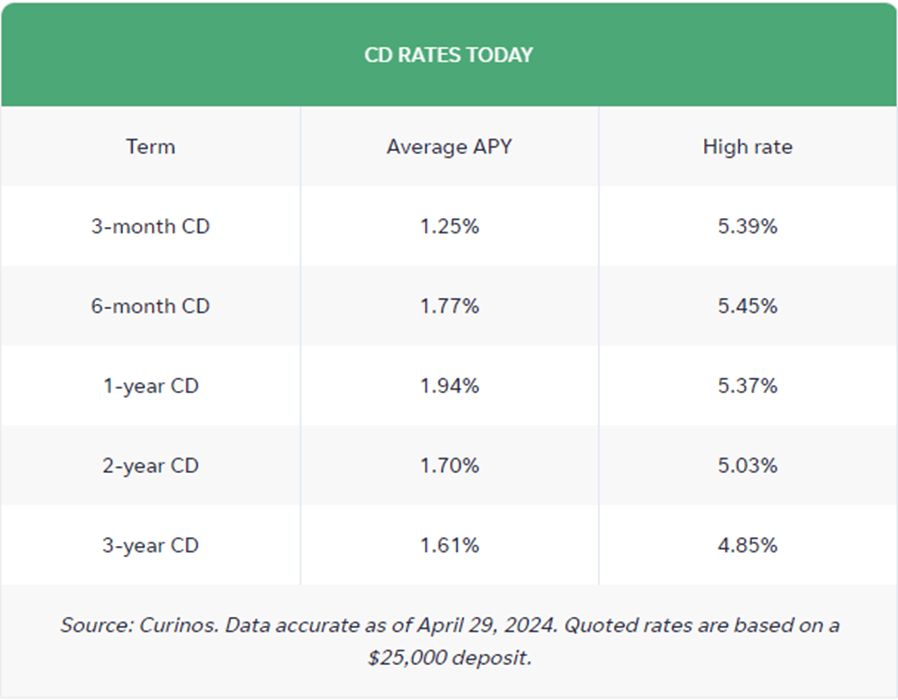
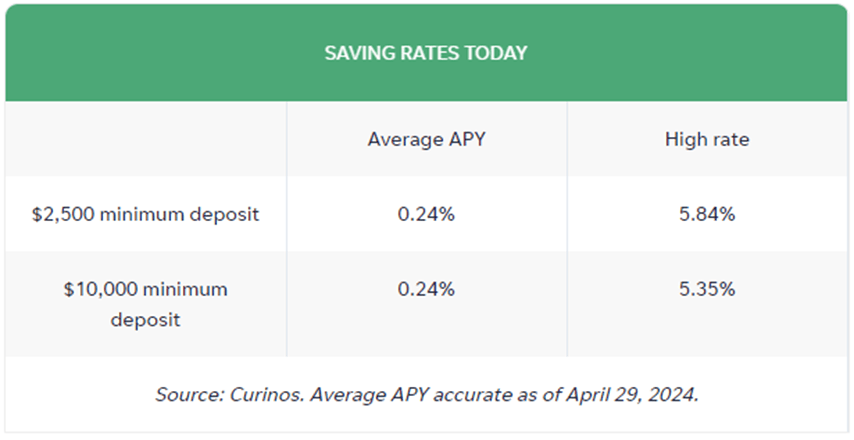
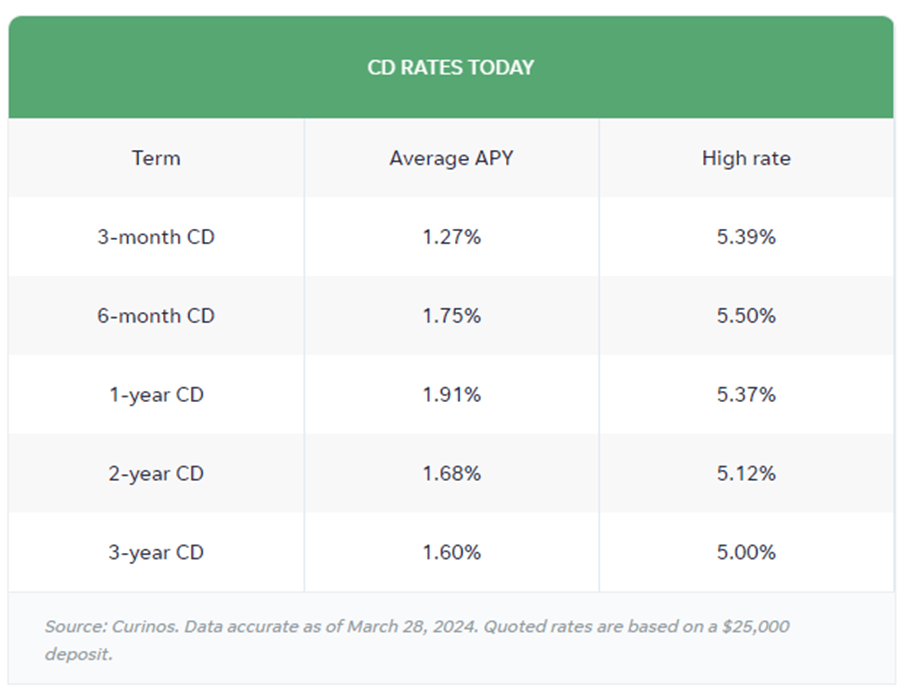
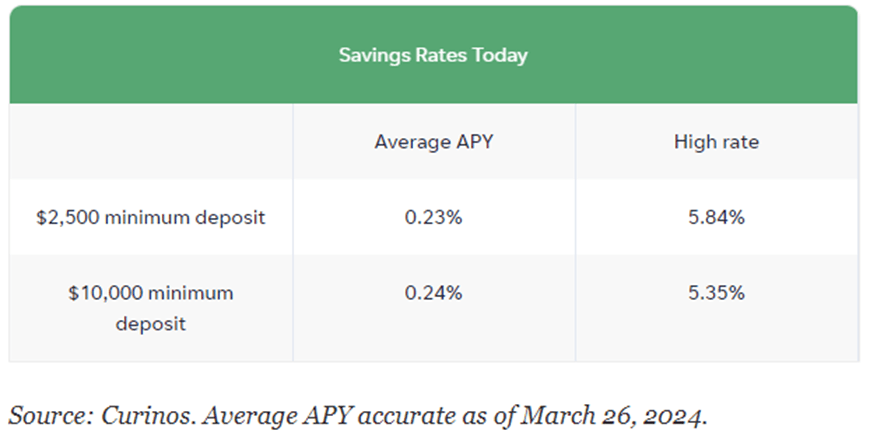
Now, take a look at the top rates for CDs and money market accounts (MMA):
The best 1-year CD interest rate is currently at 5.37%. The best 5-year CD rate right now is around 5.25%. We should see the 5-year CD rate surpass the 1-year rate by the end of the year based on current interest rate trends.
Eventually, savings rates will normalize but not until inflation comes down enough for the Fed to feel comfortable lowering interest rates. That said, I would still put my savings or emergency spending money into short-term CDs, 1 year or less, and reevaluate when they mature. If you would rather have more liquidity, look into an MMA (yielding close to 6% currently). Keep the total under $250,000 per person at any one bank to ensure you are fully covered by the FDIC. CDs and MMAs have become nice alternatives for risk-averse investors and have drawn money away from stocks because of their realtively high rates that carry virtually no risk.
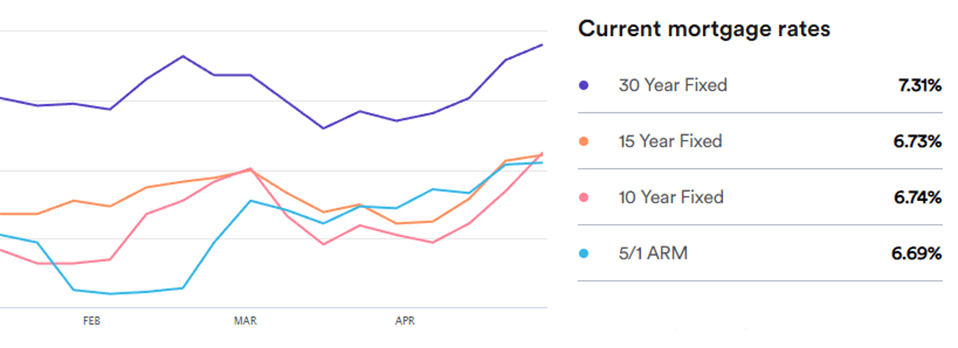
Mortgage rates rose in April as demand picked up most likely due to the spring buying season starting up. Currently, the 30-year rate sits at 7.31%, higher than a month ago, at 7.20%. The housing market continues to be in an unusual situation (high rates, low home inventory, strong demand) and that is making mortgage rates very volatile. Most homeowners either own their home outright or have a mortgage below 3.5%. There is very little incentive to sell a home with rates where they are right now. That will not change until mortgage rates fall. For now, the industry continues to bank on the Federal Reserve to get it squared away.
Oilprices broke their upward moving trend and dropped slightly in April, snapping a three-month streak. The drop could be attributed to the strong dollar due to rates in the U.S. staying higher, causing demand for the dollar worldwide, thus making imported oil cheaper.
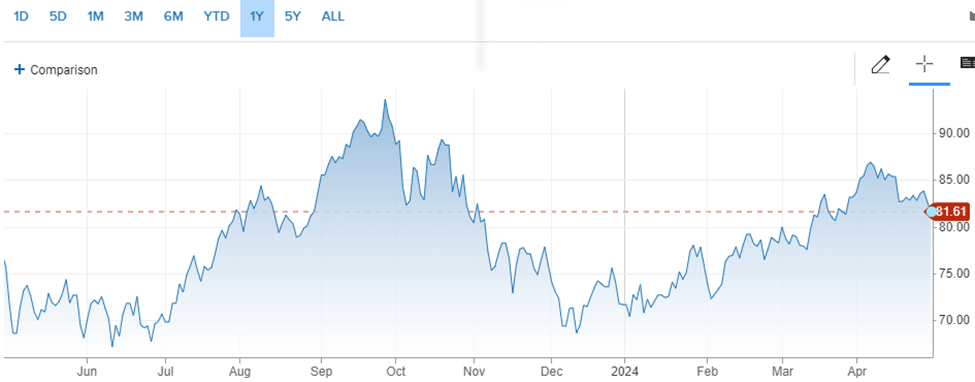
For the month, the price for a barrel of oil settled at $81.61, down from $83.17 at the beginning of April. For the year, it is up about 14%. Although oil prices fell, they are still high and are a big cause of the stubborn inflation that we are seeing in consumer prices, especially in the food and travel/leisure industries. It could be tough to get prices lower with economies worldwide continuing to chug along at a strong pace. It is a quandary that might be resolved only through demand destruction, or put another way, the cure for high oil prices is high oil prices.
Here’s a look at the one-year chart for U.S. oil:
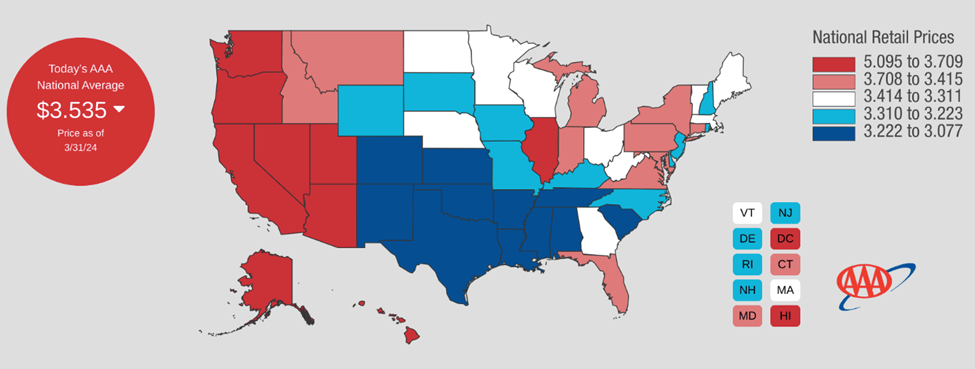
Gasoline prices headed higher again in April. Regular unleaded gasoline is now averaging $3.66 per gallon, up from $3.54 last month. Mississippi has the cheapest gas currently, checking in at $3.10 a gallon. California has the most expensive gasoline at $5.39 per gallon. FYI, a year ago, we were paying $3.61.
Check out the prices at the pump in your area: AAA Gas Prices.
Outlook
Events on the horizon that could move the markets in the near term:
Fed & Inflation: The Fed concluded their scheduled two-day meeting today and kept rates unchanged. They really don’t have a choice: unemployment is at historic lows and wages continue to rise. Both good things but too good, according to the Fed. Although prices have stabilized, especially for groceries, they just haven’t seen enough progress to justify cutting rates anytime soon. They feel what they have done so far is working, but not quite at the pace that they want so it looks like interest rates are going to remain high through at least the summer. Good news for savers, bad news for borrowers. For stock market investors, rate cuts aren’t fully priced into the market anymore so when it does happen, it will be a positive catalyst for stocks, but patience is warranted here.
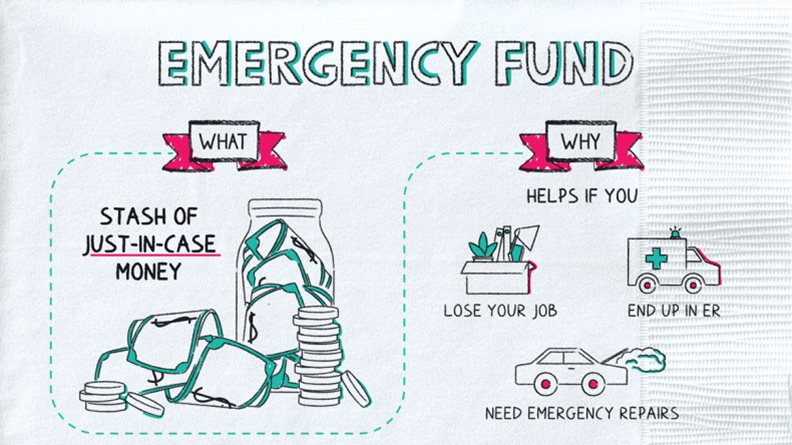
In the current interest rate environment, it is a good idea to shop around for the best savings rates when deciding where to park your emergency funds. As the graphic above suggests, an emergency fund is an account that contains cash that is liquid (easy and quick to access) so that it can be used if something unexpected happens and calls for some money quickly.
An emergency fund should be at the top of the list regarding the order that you should fund your financial accounts. Amazingly, most Americans say that they wouldn’t be able to pay off a $1,000 emergency expense if it ever came up. Almost as amazing is for those fortunate enough to have an adequate emergency fund, about 70% of them keep their emergency fund in their regular checking account, earning zero percent interest or close to it.
Yes, it does take a little effort to find a savings, checking, or money market account that pays a respectable interest rate, but it can be well worth it. There are money market account (MMA) rates near 5.5% right now, far better than the current average savings account yield of 0.08%. For example, $30,000 in an MMA yielding 5% will earn $1,500 in interest annually, versus $24 in the average savings account. That’s not bad for doing a little leg work.
A quick search on Google will give you a ton of options for both online and brick-and-mortar bank rates. Here are two that I like to use:
It’s important to consider other factors besides just the interest rate when choosing a money market account, such as minimum balance requirements, monthly fees, and ATM access.
Please comment or send an email if you have any questions. Thanks!
I thought that I would share some interesting charts and data that I saw this past week regarding the health of the U.S. economy.
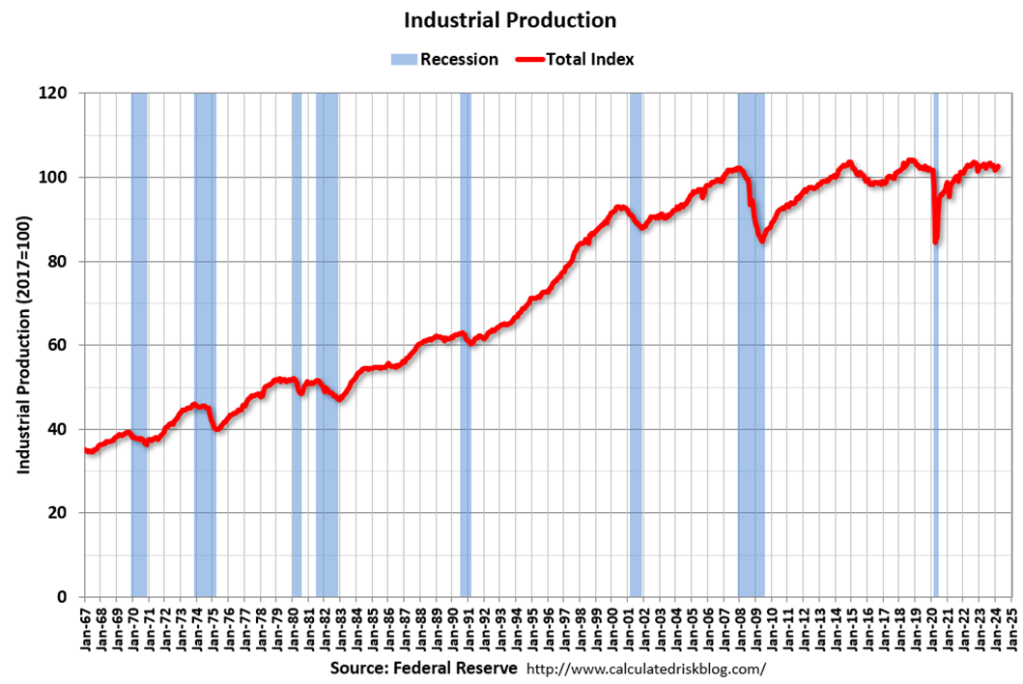
The following graph shows industrial production since 1967.
Industrial production is a measure of output of the industrial sector of the economy. The industrial sector includes manufacturing, mining, and utilities. The industrial sector is not as big a portion of our GDP as it once was but it’s still nice to see some increase in production in this area.
We are still spending like we just got out of a pandemic:
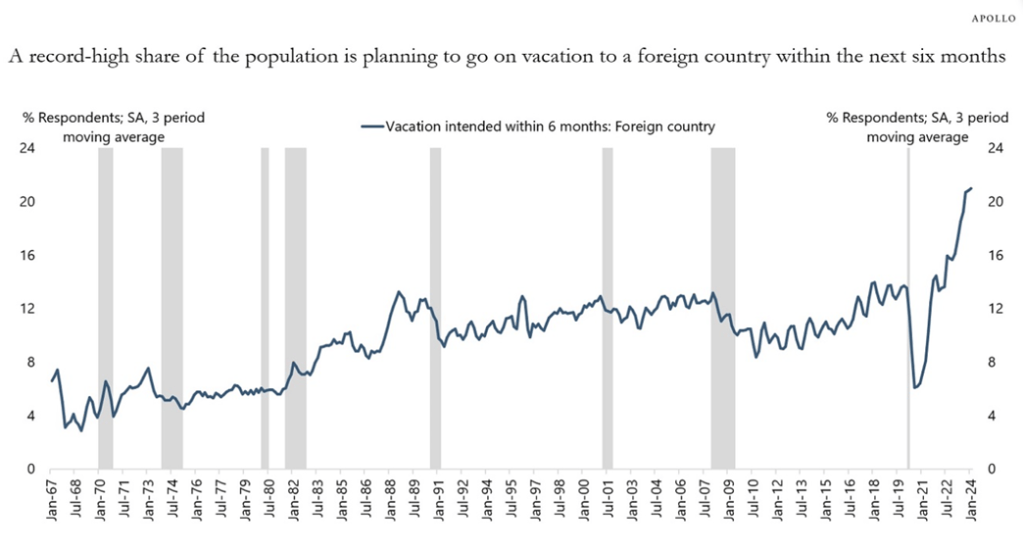
The Conference Board’s consumer confidence survey asks households if they plan to travel to a foreign country, and the chart below shows that a record-high share of US consumers is planning to go on vacation to a foreign country within the next six months.
Because of the significant rise in the stock market and significant cash flows from fixed income, US households have more money to travel on airplanes, stay at hotels, eat at restaurants, go to sporting events, amusement parks, and concerts, and that is why inflation in the non-housing service sector continues to be so high.
There’s a lot of good stuff happening in our economy. Unfortunately, one of the trade offs of a strong economy is inflation. Eventually, the high interest rate environment that we are currently in will help bring prices down but for now, the majority of U.S. consumers are keeping their wallets open. Hopefully, we can hit that soft landing that the Federal Reserve is aiming for so we don’t crash into a recession.
Please comment or send an email if you have any questions. Thanks!
Here is a quick story that illustrates how a reverse mortgage can help free up cash for someone in their retirement years. This is a scenario from an actual client of a colleague of mine, David Heilman of HomeGrown Financial, that specializes in reverse mortgages.
Client Spotlight
We had the pleasure of working with a client recently who was referred by his Certified Financial Planner. We first established a meeting via Zoom with both the client and his advisor to make sure everyone understood exactly how the loan program works and what the expectations were in terms of the process.
The client’s goals and objectives were met as we:
Paid off a small current mortgage
Set up an initial draw for home improvements
Put remaining funds in a line of credit for future needs
Worth noting that this line of credit is very different than a traditional home equity line of credit as it GROWS by 0.5% above the current interest rates. So, this client now has a growing line of credit, expanding as he ages and allowing for more borrowing power.
This was all accomplished using the FHA-Insured Reverse Mortgage which doesn’t require a monthly mortgage payment. The client is still responsible for paying his homeowner’s insurance and property taxes and of course the title/ownership of the home never changed. The loan will be paid in full when the client decides to sell the home, or lives there until death and then the heirs would decide if they want to retain the property (pay off debt) or sell. Any equity still in the home belongs to the estate/heirs!
Reverse mortgages aren’t for everybody, but in the right situation, they can be very beneficial as a source of income in retirement.
Please comment or send an email if you have any questions. Thanks!
Stocks climbed higher once again in March, making it the fifth month in a row of positive returns for the S&P 500. The rally wasn’t limited to the big technology companies either, as gains were more broad-based across many sectors of the economy. For the month, the S&P 500 was higher by 3.1% and reached a new all-time high to close out the month. For 2024, it is up an impressive 10.4%.
Looking ahead, we have Q1 earnings coming out over the next month or so, supplying plenty of ammunition to shake up the markets. We can put the Federal Reserve on the back burner for a little bit since they don’t meet again until May.
From an historical perspective, April has always been a great month for stocks. In fact, it has been in the top three of the best performing months for stocks since forever. Specifically, from 1950 to 2023, April on average is the second best-performing month of the year, with a gain of about 1.5%. Also, since March marks the fifth straight month of positive returns for the S&P 500, history favors strong performance in the future: Since 1950, there have been 30 five-month streaks in the S&P 500. In all but two of the prior 28 cases, the S&P 500 was higher 12 months later, with an average gain of 12.5%. Data on the economic front continues to look very favorable for avoiding a hard landing or recession in the near future. This should translate into some interest rate cuts later this year, which could give a boost to stocks.
Take a look at the Outlook section below to see what events could move the markets over the short term.
Bond prices changed course once again and headed higher as it looks more and more probable that the Federal Reserve will like what it sees on the inflation front. Expectations are for them to start cutting rates by mid-summer as long as the trend in consumer prices continues to head lower. Switzerland has already started to cut rates in an encouraging sign that inflation has been tamed over in Europe.
The 10-year US Treasury note yield took a dip but still stayed comfortably above the 4% level, finishing the month of March at 4.21%, lower than the 4.25% that it was at the beginning of the month. The 30-year bond yield closed out the month at 4.35%, about 2 basis points lower from a month ago.
I would keep maturities under 18 months and just plan on holding these bonds to maturity. That way, you won’t have to worry about selling at a discount if interest rates head higher.
Savings rates moved higher in March as uncertainty abounds on the direction of interest rates. By the way, savings rates typically follow, but lag, the direction of bond yields. These current savings rates are still relatively high, especially with respect to inflation. So, CDs and MMAs continue to be a great place to park your cash and your emergency fund. These rates continue to be a legitimate alternative to stocks and bonds and will keep pressure on those markets until we see this trend reverse, which looks like it will be happening later in the year than expected.
Now, take a look at the top rates for CDs and money market accounts (MMA):
The best 1-year CD interest rate is currently at 5.37%. The best 5-year CD rate right now is around 5.15%. We should see the 5-year CD rate surpass the 1-year rate by the end of the year based on current interest rate trends.
1 year or less, and reevaluate when they mature. If you would rather have more liquidity, look into an MMA (still yielding well over 5% currently). Keep the total under $250,000 per person at any one bank to ensure you are fully covered by the FDIC. CDs and MMAs have become nice alternatives for risk-averse investors and have drawn money away from stocks because of their relatively high rates that carry virtually no risk.
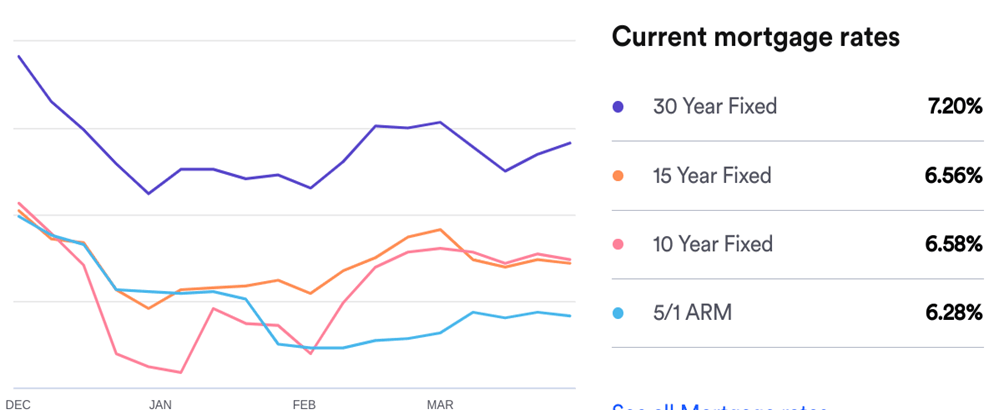
Mortgage rates dipped slightly in March as demand waned, probably due to low inventory and seasonal factors. Currently, the 30-year rate sits at 7.20%, slightly lower than a month ago, at 7.28%. The housing market is in such an unusual situation (high rates, low home inventory, strong demand) that the mortgage rate picture is murky at best. Most homeowners either own their home outright or have a mortgage below 3.5%. There is very little incentive to sell a home with rates where they are right now. That will not change until mortgage rates fall. For now, the industry is dependent on the Federal Reserve to get it squared away.
Oilprices soared higher in March, marking the third consecutive month of higher prices. Some of the reasons for the sustainedhigh prices:OPEC is standing firm on its production cuts. Also, Ukraine is targeting Russia’s oil infrastructure, which is pushing prices upward.
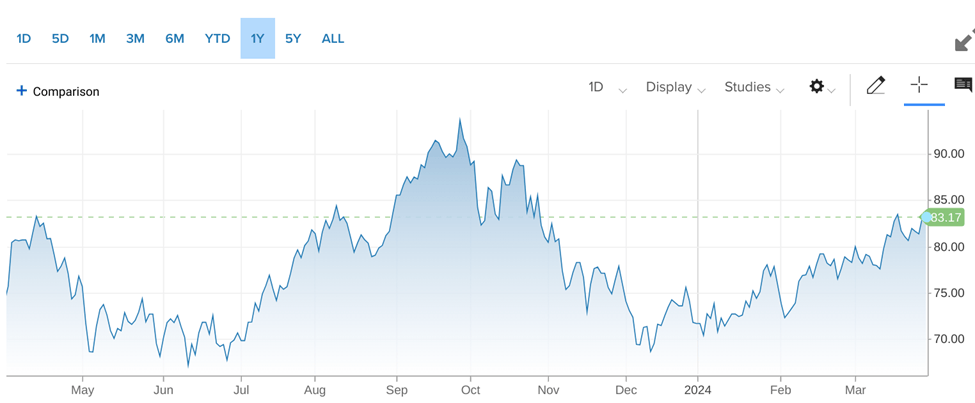
For the month, the price for a barrel of oil settled at $83.17, up from $78.25 at the beginning of March. For the year, it is up about 16%. This is the stickiest part of the inflation equation. And it could be tough to get prices lower with economies continuing to chug along at a strong pace. It is a quandary that might be resolved only through demand destruction, or put another way, the cure for high oil prices is high oil prices.
Here’s a look at the one-year chart for U.S. oil:
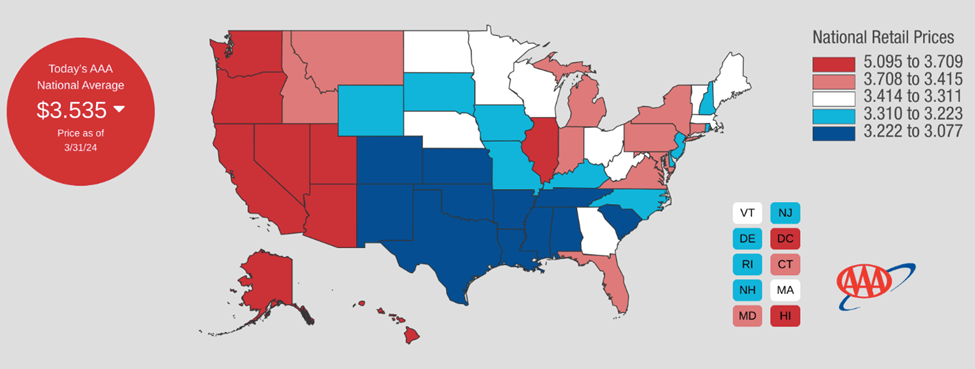
Gasoline prices tracked oil prices higher once again in March. Regular unleaded gasoline is now averaging $3.54 per gallon, up from $3.32 last month. Mississippi has the cheapest gas currently, checking in at $3.08 a gallon. California has the most expensive gasoline at $5.10 per gallon. FYI, a year ago, we were paying $3.50.
Check out the prices at the pump in your area: AAA Gas Prices.
Outlook
Events on the horizon that could move the markets in the near term:
Fed & Inflation: The Fed met this past month and said all the things that we expected: inflation is coming down but still has some stickiness. The inflation data is trending down but prices that we see every day, like gasoline and groceries, are still higher than we would like. Regardless, stocks don’t seem to mind. That’s because the stock market is expecting inflation to continue to drop and is pricing in that action right now. Good stuff for the patient investor.
Savings Rates Peak: This is still in play as savings rates seemed to have stalled and could be heading lower. There are a lot of financial companies competing for deposits so that is definitely helping to keep these rates high, which is great for savers and risk averse investors. If the Fed starts to cut rates sometime this summer, we should see money flowing out of money markets and CDs and back into stocks. This could fund another leg up for stocks over the next 12-18 months.
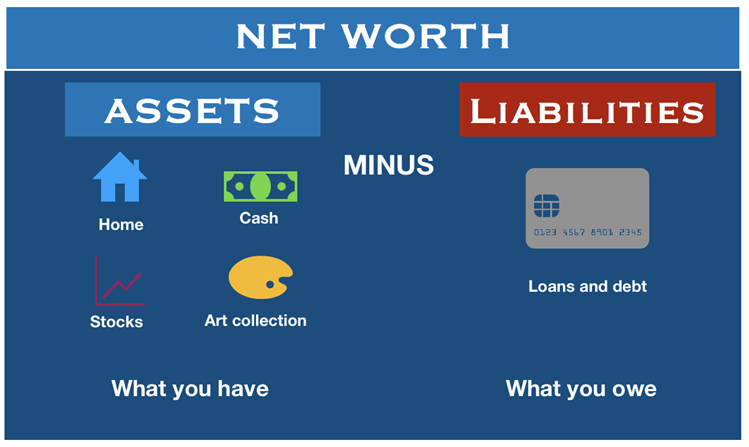
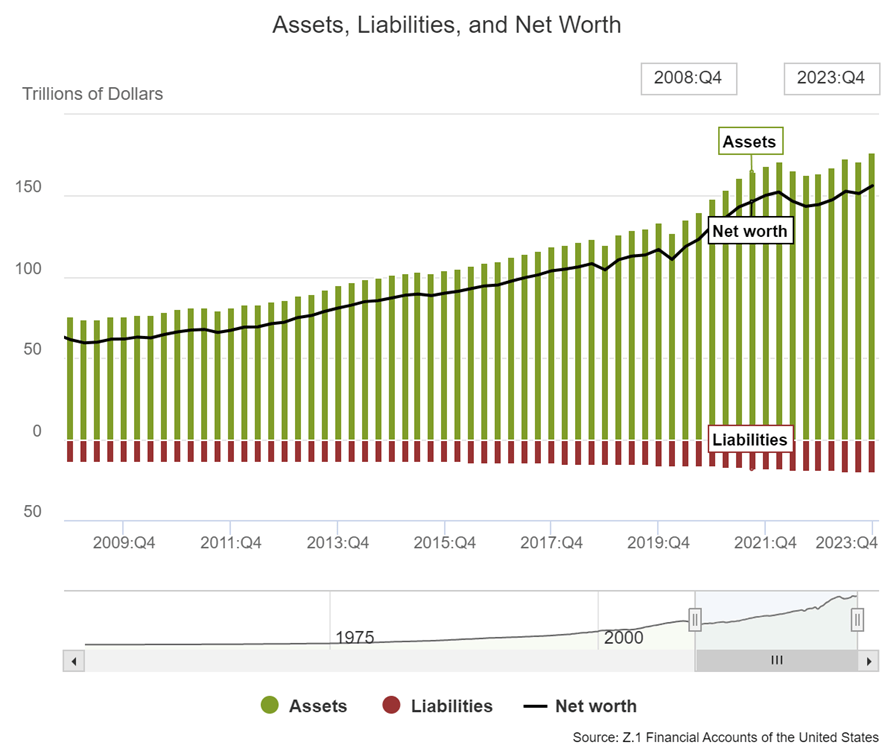
Just like for a company, the balance sheet is one of the most important financial statements that a household can use to monitor its financial health. Put simply, it is a snapshot of your net worth, which is just your assets (stuff you own like your home, stocks, retirement plans, etc.) minus your liabilities (stuff you owe like mortgages, credit card debt, student loans, etc.).
Recently, households in the U.S. have been getting healthier financially than at almost any other time in history. In fact, if you look at homeowners, about 39% have no mortgage and roughly 85% of homeowners that do have a mortgage, their mortgage rate is under 3.5%. When you couple this low amount of debt with all-time highs in the stock market, historically low unemployment, and decent wage growth, household net worth has never looked better.
Here are a few charts that illustrate this topic more clearly:
In the chart above, you can see that since the great financial crisis, household net worth has consistently grown over the last fifteen years.
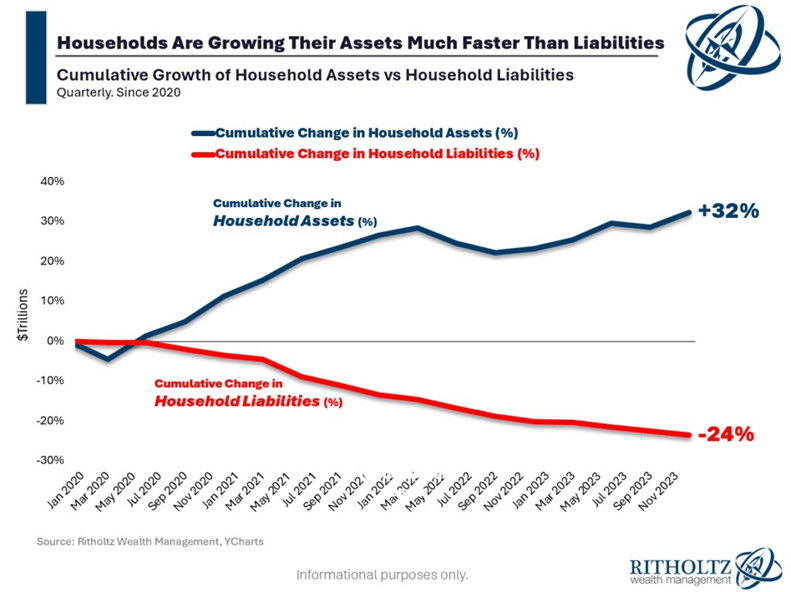
In this illustration, a more recent time period (from the pandemic in 2020 until the end of last year, 2023) shows the significant growth of household assets over the last three years while liabilities have dropped quite a bit.
Of course, the economic picture isn’t as rosy as it appears. There are some under currents to consider despite this encouraging data:
There is still significant wealth inequality. The top 1% hold a much larger share of the total wealth compared to the bottom 50% [Pew Research Center]. This falls under the old saying that “The rich get richer”.
Stubborn inflation could deplete some of the assets of households as they try to continue their same lifestyle without adjusting their spending habits for inflation.
For most households, things are looking pretty good, financially. If we can win the battle with inflation, we’ll see interest rates head lower, which will benefit the economy even more.
Please comment or send an email if you have any questions. Thanks!
Social security retirement benefits provide a major source of income for most retirees in the U.S. In fact, about 40% of retirees rely solely on social security income. So, it is important to know when to start taking it to maximize your benefit. The decision is basically a bet with the government on how long you are going to live. Therefore, like any bet, you should gather as much information as possible to move the odds in your favor.
Here’s what I consider are the two most important factors that you should consider before deciding when to start taking social security:
Financial Needs: This should be looked at first because if you need the money, you can stop the analysis and just take the money at age 62. If you’re not sure, then the next step is to consider your retirement income sources. If you have a 401k, IRA, pension, savings, or plan to keep working, you might be able to delay benefits. However, if you plan on relying heavily on Social Security, starting benefits earlier could be necessary. If you can swing it, it definitely pays to wait, because your benefit increases by about 8% for every year you wait. That’s a huge difference in payments, especially extrapolating it out over twenty years or more.
Life Expectancy: So, if you decided that you don’t need the money at age 62, then you need to analyze what your expected lifespan will be. If you have a family history of longevity, delaying benefits might be wise to maximize the total amount you receive over your lifetime. Conversely, if you have health concerns or a shorter life expectancy, taking benefits earlier ensures you get more money while you can.
I have run the numbers for a bunch of people with all different scenarios and I have found that the breakeven point for most people is between ten and twelve years. This is the number of years that it would take for the total of your payments starting at age 70 to equal the total payments received if started at age 62. That means if you think that you’ll live to 85 (15 years past age 70), which is the age that you receive the maximum benefit, then you should delay taking benefits until age 70 in order to get the most money over your lifetime.
You also want to consider if you want that extra income while you are younger, to use for things, such as traveling, that you might not be able to do when older.
If you’re still not sure what to do after looking at the two factors above, here are some additional things to consider as well:
Work Status: If you continue working past your full retirement age (age 67 for anyone born after 1960), your benefits might be reduced until you reach FRA. However, your benefit amount will be recalculated later to include those working years.
Marital Status: Married couples have additional considerations. The benefit you receive might depend on your spouse’s earnings history and claiming decisions.
Healthcare coverage: If you retire before 65, you might lose employer-provided health insurance and need to consider alternatives.
Everyone’s situation is unique, so it is worth it to take the time and figure out the best strategy to maximize your social security retirement benefit. By weighing the factors listed above and using the resources available on the Social Security Administration’s website, www.ssa.gov, you can make an informed decision about when to claim your Social Security benefits.
Please comment or send an email if you have any questions. Thanks!
March 29th: Good Friday – The stock market is closed.
March 31st: Easter Sunday
Stocks continued to push higher in February, led once again by most of the big tech companies, some major pharmaceuticals, and also firms associated with crypto currencies. Both the S&P 500 and the NASDAQ 100 indices closed the month at all-time highs.
For February, the index was up about 5.2%. So far this year, it is up 6.8%. This should bode well for the stock market for at least the rest of the year because when the S&P 500 is higher in both January and February, which it was this year, the next 12 months have been higher 27 out of 28 times since 1950, with an average return of 14.8%. Hopefully, the stock market can follow this historical trend.
The economy continues to power ahead, with very low unemployment and most inflation indicators continuing to drop. This is helping to pull stocks up, but the stickiness of most food prices and home prices are giving investors angst as to what the Federal Reserve will do with regards to interest rates. On top of all of that, we have elections coming up in November which always put some extra volatility in the markets.
Take a look at the Outlook section below to see what events could move the markets over the short term.
Bond prices moved lower across the board in February. Inflation data that came in this past month added uncertainty to the Fed’s rate cut timeline, pushing prices lower and rates higher.
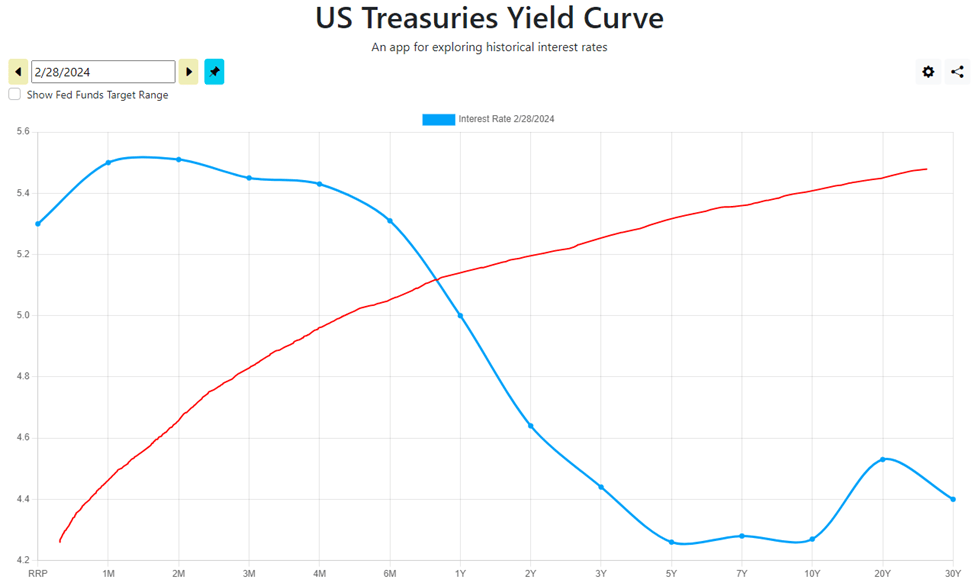
I haven’t shown the yield curve in a while so wanted to add this to the monthly update this time to show you how out of whack it still is:
The blue line is the current yield curve for U.S. Treasury bonds, with the term of the bonds on the x axis (horizontal) and their corresponding interest rates on the y axis (vertical). The red line is my freehand drawing of what a normal yield curve is supposed to look like. Obviously, we have a ways to go to get back to a normal yield curve.
The 10-year US Treasury note yield breached the 4% level once again, finishing the month of February near 4.25%, higher than the 3.94% that it was at the beginning of the month. The 30-year bond yield closed out the month at 4.37%, about 20 basis points higher from a month ago.
With so much uncertainty surrounding the direction of interest rates, bond buyers should continue to focus on bonds with short-term maturities. I would keep maturities under 18 months and just plan on holding these bonds to maturity. That way, you won’t have to worry about selling at a discount if interest rates continue to head higher.
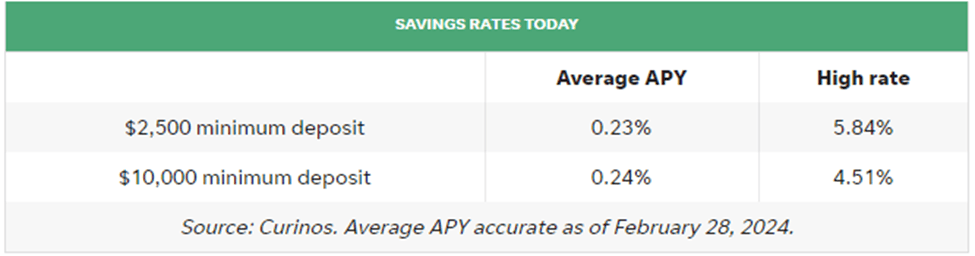
Savings rates moved slightly higher in February as hopes for rate cuts in March dissipated. Fyi, savings rates typically follow, but lag, the direction of bond yields. These current savings rates are still relatively high, especially with respect to inflation. So, CDs and MMAs continue to be a great place to park your cash and your emergency fund. These rates continue to be a legitimate alternative to stocks and bonds and will keep pressure on those markets until we see this trend reverse, which looks like it will be happening later in the year than expected.
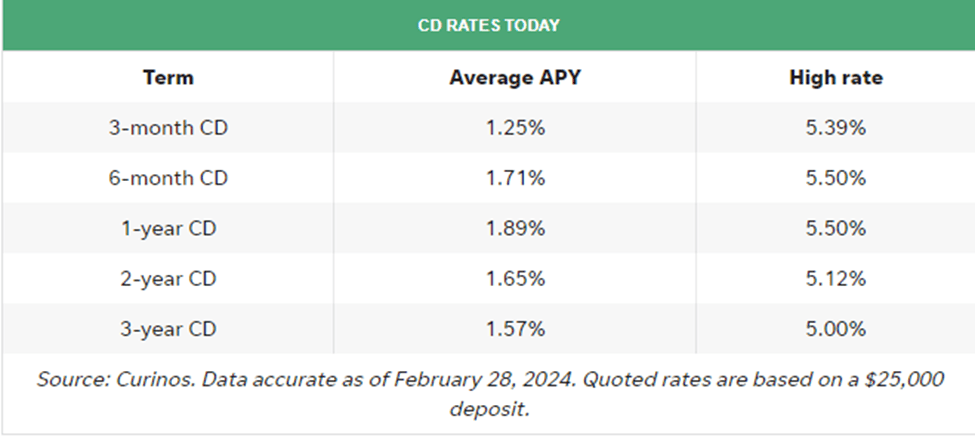
Now, take a look at the top rates for CDs and money market accounts (MMA):
The best 1-year CD interest rate is currently at 5.50%. The best 5-year CD rate right now is around 4.61%. These rates are still inverted and may stay that way for a while based on the consensus of the Federal Reserve holding steady on interest rates.
Eventually, they will normalize but not until the inflation comes down enough for the Fed to feel comfortable lowering interest rates. As such, I would still put my savings or emergency spending money into short-term CDs, 1 year or less, and reevaluate when they mature. If you’d rather have more liquidity, look into an MMA (still yielding well over 5% currently). Keep the total under $250,000 per person at any one bank to ensure you are fully covered by the FDIC. CDs and MMAs have become nice alternatives for risk-averse investors and have drawn money away from stocks because of their relatively high rates that carry virtually no risk.
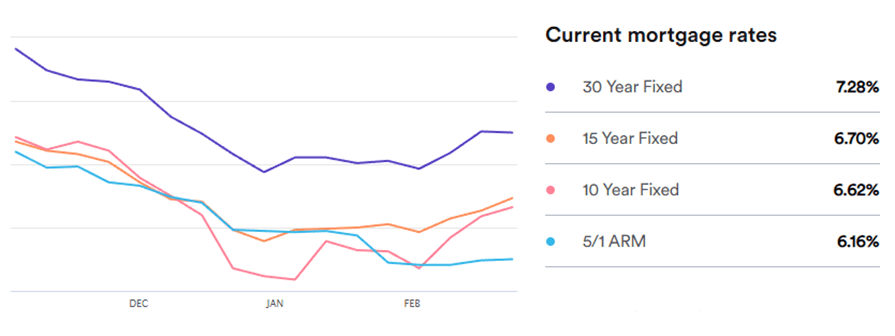
Mortgage rates continued to head higher during February as hopes faded for an interest rate cut anytime soon by the Federal Reserve. Currently, the 30-year rate sits at 7.28%, slightly higher than a month ago, at 7.03%. These relatively high rates along with very little existing home inventory for sale have dropped mortgage applications to their lowest since 1995.
Although rates went up again for the second month in a row, I don’t think this is a long-term trend. That said, demand for mortgage loans will most likely pick up as we head into the spring even if the Fed stays the course and takes no action on interest rates.
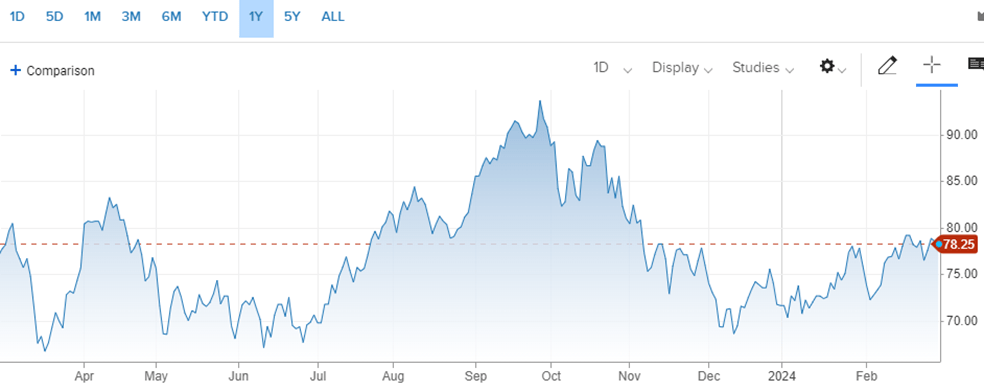
Oilprices moved higher for the second consecutive month in February. Some of the causes for this rise in prices are OPEC+ extending its production cuts that it started last year as well as the potential for disruptions in oil shipping in the middle east due to Houthi militants. The U.S., Brazil, and Canada are continuing to produce at a near-record pace to help offset the OPEC+ cuts.
For the month, the price for a barrel of oil settled around $78.25, up from $75.76 at the beginning of February. OPEC+ is signaling that they would like to keep the production cuts in place through the end of this year, which is not going to help move prices lower. Plus, if China’s economy starts to fully recover, we could see higher oil prices before we see lower prices.
Here’s a look at the one-year chart for U.S. oil:
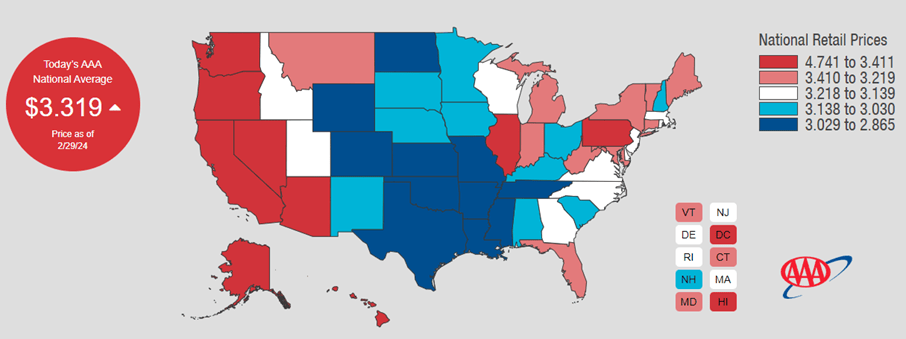
Gasoline prices tracked oil prices higher in February. The record warm winter temperatures helped fuel (pun intended) some of this increase.
Regular unleaded gasoline is now averaging $3.32 per gallon, up from $3.14 last month. Mississippi has the cheapest gas currently, checking in at $2.87 a gallon. California is back on top with the most expensive gasoline at $4.74 per gallon. FYI, a year ago, we were paying $3.36.
Check out the prices at the pump in your area: AAA Gas Prices.
Outlook
Events on the horizon that could move the markets in the near term:
Fed & Inflation: The Fed did not meet in February, but they said plenty during their members’ many scheduled guest speaker events. As a result, many of their talking points coupled with the latest economic data are keeping the inflation embers glowing. Word on the street now is that The Fed won’t cut rates until mid-summer. Surprisingly, it may not matter to the economy or the stock market. They are both humming along in spite of persistently high interest rates. Just the expectation that the Fed will be cutting rates at some point in the near future is giving the markets strong support so far this year. We’ll certainly no more on this front when they meet again in late March.
Regarding inflation, here’s a big picture look at raw material prices over the last few years. The chart below shows the Bloomberg Commodity Index, which is a measure of raw materials used throughout our economy, such as fossil fuels, grains, and metals.
As you can see, it has been steadily decreasing over the past year. However, many of the consumer products that we use, particularly groceries, have not decreased in price at the same rate. I think the retail companies that sell these products are starting to feel the consumer blowback on their sustained high prices in the form of reduced demand. Hopefully, this will trigger some price reductions to match some of this drop in raw materials that we have seen. This should help move overall inflation lower towards the Fed’s two percent target so they can start cutting rates. This would be a positive for stock and bond holders in the near term.
Savings Rates Peak: This is still in play as savings rates seemed to have stalled and could be heading lower. If the Fed starts to cut rates sometime this summer, we should see money flowing out of money markets and CDs and back into stocks. This could fund another leg up for stocks over the next 12-18 months.
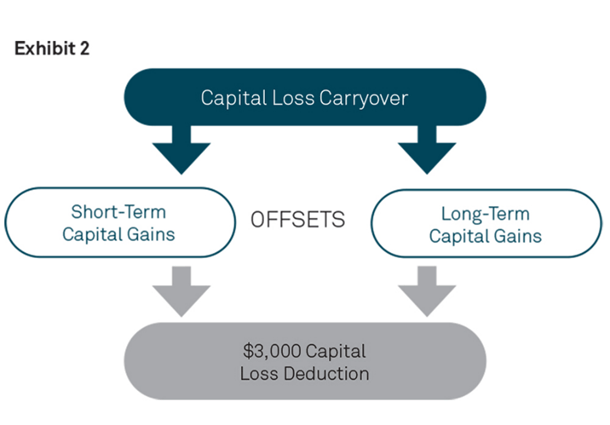
Because 2022 was such a bad year for the stock market, many investors who sold stocks back then had more capital losses than capital gains for that year. The good news is that they can use those excess losses to reduce their capital gains in 2023 and even some of their ordinary income (up to $3,000).
Capital loss carryover is a tax rule that lets you use investment losses from one year to reduce your taxable income in future years. Before going any further, keep in mind that this rule only applies to taxable accounts, not retirement accounts, such as IRAs.
Here’s how it works:
1. Calculating your net capital loss:
First, you need to calculate your net capital loss for the year. This is the difference between your capital gains (money you made on investments) and your capital losses (money you lost on investments).
You can only deduct up to a certain amount of net capital losses in a single year. This limit is currently $3,000.
2. Carryover of unused losses:
If your net capital loss is greater than the allowable deduction ($3,000), the unused portion automatically carries over to future tax years.
There is no time limit to how long you can carry over capital losses.
You can use the carryover to:
o Offset capital gains in future years.
o Deduct up to $3,000 against your ordinary income in future years.
3. Applying the carryover:
Each year, you calculate your net capital loss again, considering any new gains and losses.
You can use your current year’s net capital loss first to offset any capital gains you have.
Then, you can apply any remaining unused carryover from previous years to further reduce your taxable income.
4. Important points to remember:
Capital losses are categorized as short-term or long-term based on how long you held the investment before selling. Short-term losses can only offset short-term gains, while long-term losses can offset both short-term and long-term gains.
Wash sales are a strategy where you sell an investment at a loss and then repurchase it shortly after. This is generally not allowed and can prevent you from claiming the capital loss.
It’s important to keep accurate records of your capital gains and losses for tax purposes.
Here’s an example:
In 2022, you had $5,000 in capital losses and no capital gains. You deducted $3,000 of your losses to offset your ordinary income, and the remaining $2,000 carried over to 2023. In 2023, you had $1,000 in capital gains. You can first use your $2,000 carryover to completely offset these gains. You then have $1,000 remaining in your carryover that you can offset your ordinary income with, thus using up all of your capital loss carryover.
I hope this explanation helps. Remember, it’s always a good idea to consult with a tax professional for advice specific to your situation.
Please comment or send an email if you have any questions. Thanks!
Joe Baker, CFP® Baker Asset Management, LLC joebaker@bakerassemanagement.com