I was looking at some data last week to see if the U.S. still had a good chance of avoiding a recession and came upon some interesting charts that I wanted to share with you.
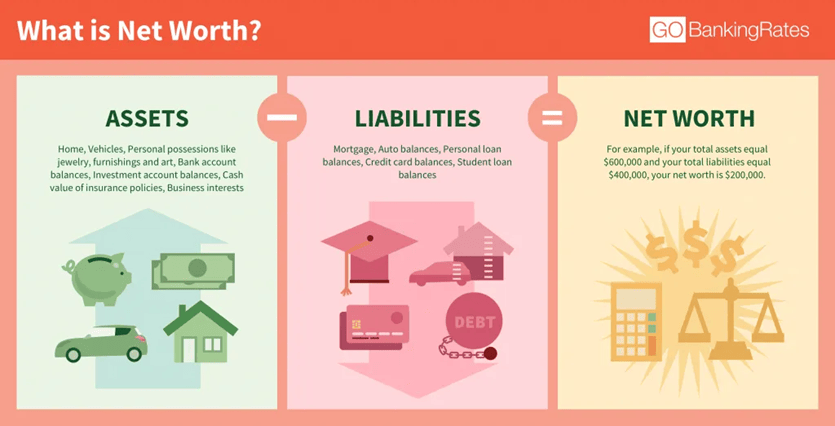
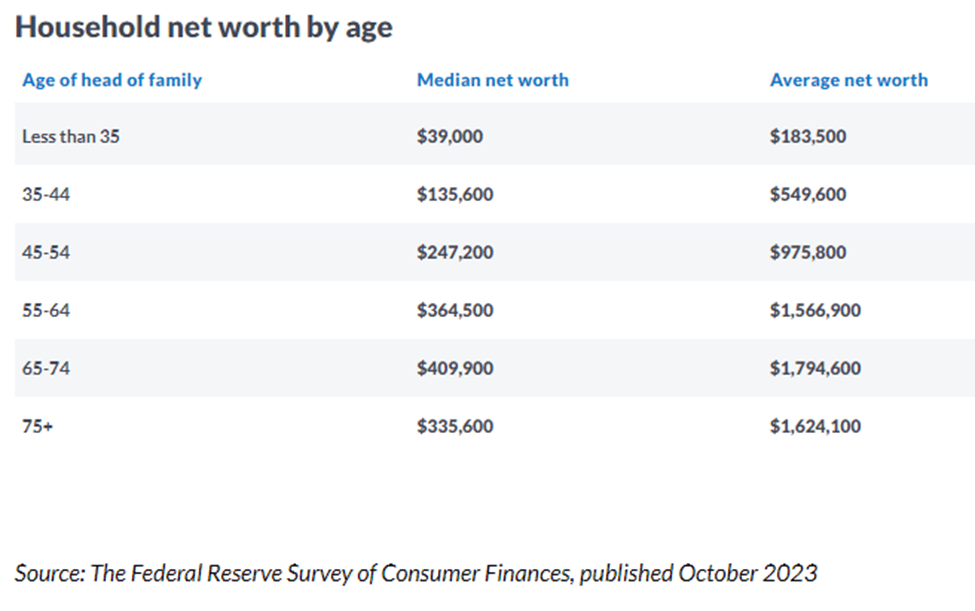
The first chart takes a look at the average and median net worth of U.S. citizens categorized by age as of 2023. Remember, net worth is just your assets minus your liabilities. The illustration above gives a great example of how net worth is calculated.
You can see there is quite a difference between average and median values. That’s because there are a bunch of households that are extremely wealthy and that will skew the average higher. The more realistic values are the ones in the Median Net Worth column. These amounts are calculated simply by locating the middle value of all the net worth values in that age group. That said, both show that the net worth of U.S. households is the highest that it’s ever been.
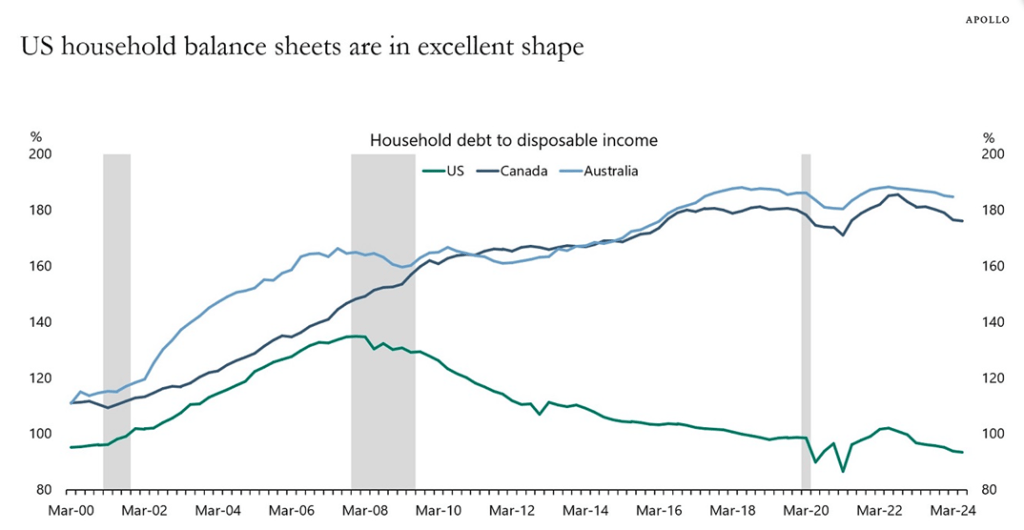
This next chart compares our household debt as a percentage of disposable income to our buddies in Canada and Australia. The lower the percentage, the better:
As you can see, we are below 100% which means that we have enough disposable income to pay off our debts. Also, we are in much better shape than our Canadian and Australian friends.
This is good news any way you slice it. The combination of rising asset values (homes, stocks, etc.), decent job growth, solid wage growth, and the Fed cutting interest rates, almost ensures that there is no recession on the horizon.
Please comment or send an email if you have any questions.
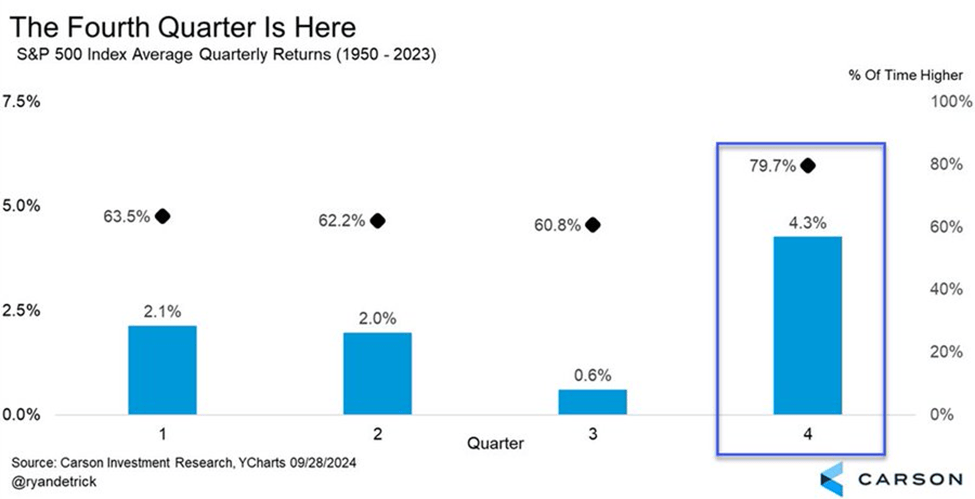
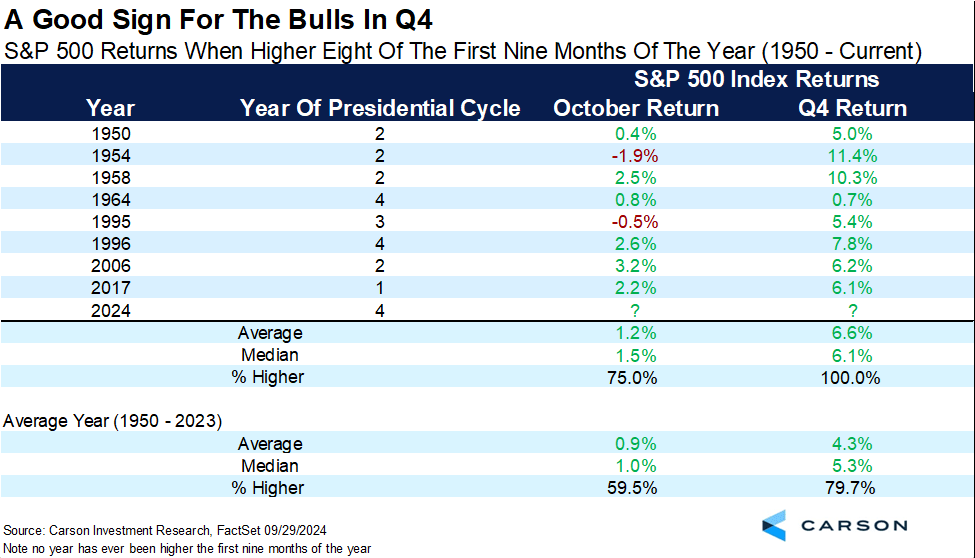
History tells us that the fourth quarter of the year is typically a very good time to be invested in stocks. Take a look at this chart:
As you can see, the S&P 500 index has an average return of 4.3% in the fourth quarter over the past seventy-three years. This is more than twice as good a return as any other quarter of the year.
Historical data gets even better for stock market bulls when it comes to this year. When the S&P 500 index is higher the first eight of the nine months of a year, like it has been in 2024, then the fourth quarter is positive every single time (8 for 8), with an average gain of 6.6%. FYI, the index has never been up each of the first nine months of a year. This year, April has been the only down month.
I have to hedge this blog by stating that the upcoming election could have a greater influence on the markets than any other election in recent history. Even so, if history repeats itself, or at least rhymes, we should expect a pretty good quarter for the stock market to finish out 2024.
Please comment or send an email if you have any questions.
Stocks bucked the historical data and stayed positive to end the month of September. The Federal Reserve cutting interest rates 50 basis points in the middle of the month certainly helped. Economic data continue to come in supporting a soft landing for the economy, meaning no recession on the horizon.
For the month, the S&P 500 was higher for the fifth month in a row, this time by 2.02%. For 2024, it is up 20.81%.
Interest rates are still the main driver for stocks in the short term. Based on the Fed and the most recent economic data, rates should trend lower over the next year or so. This is bullish for stocks as investors look for a place to get a better rate of return for their money than in money markets, CDs, and bonds.
Historically, October has been a very volatile month. Some of the worst market drops in history happened in October: 1929, Black Monday in 1987, and multiple plunges in 2008 during the financial crisis. Also, since 1950, election-year Octobers have been the worst month for the Dow, S&P 500, and NASDAQ. However, more recently, October has been one of the best performing months for stocks, averaging about a 1.1% gain over the past two decades. It will be interesting to see how this October ends up.
Take a look at the Outlook section below to see what events could move the markets over the short term.
Bond prices moved higher once again, making it five months in a row of higher prices. Government, corporate, and high yield bonds all moved higher as inflation continues to drop and the Federal Reserve sets the table for more rate cuts in the near future.
The 10-year US Treasury note yield fell in September, finishing the month at 3.79%, lower than the 3.91% that it was at the beginning of the month. The 30-year bond yield closed out the month at 4.12%, lower than the 4.20% that it was a month ago.
Bond investors can now feel more confident buying bonds with longer maturities since they can be fairly certain that interest rates will be trending lower over the next year or so. Therefore, bond buyers holding to maturity could extend their maturity range out to two to three years. If rates drop faster than expected, you can sell those bonds before they mature with some nice capital gains.
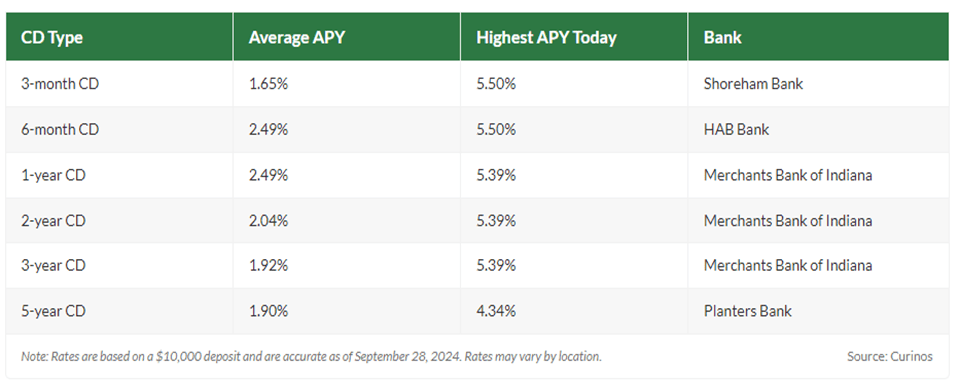
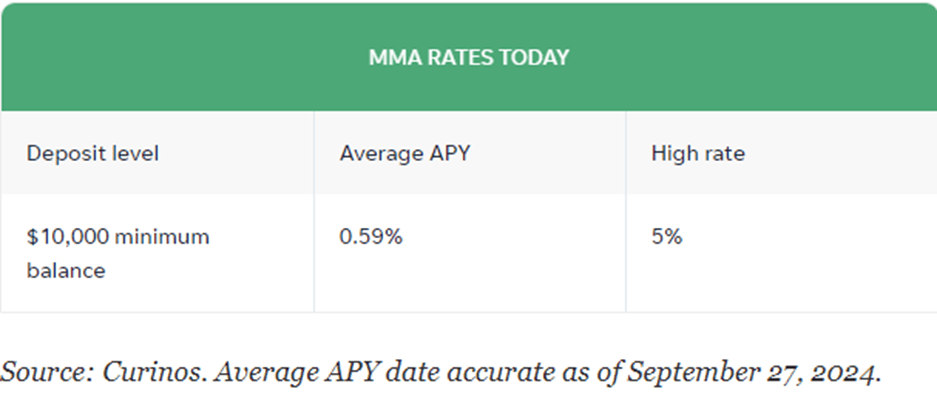
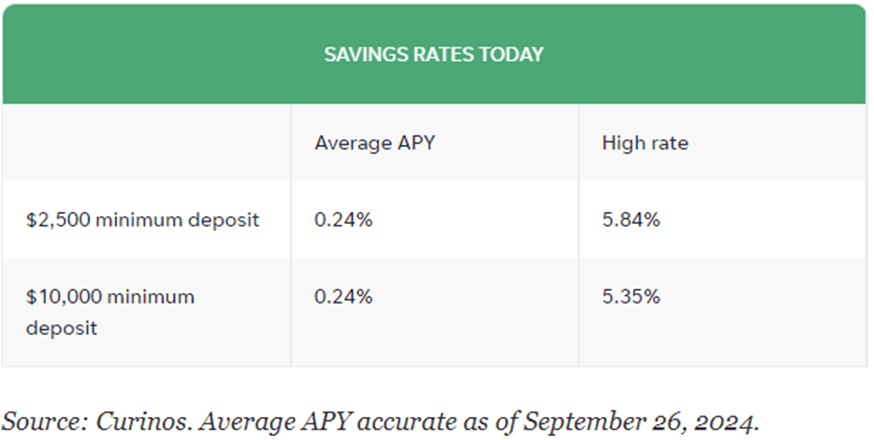
Savings rates are showing signs of weakness and should start dropping more convincingly as the Federal Reserve continues to cut the short-term lending rates between banks. That said, rates are still pretty juicy and because of that, there is still a ton of money parked in cash (CDs, MMA, Savings). You can still get over 5% return on your money, risk free. So, CDs and MMAs continue to be a great place to put your cash and your emergency fund, for now.
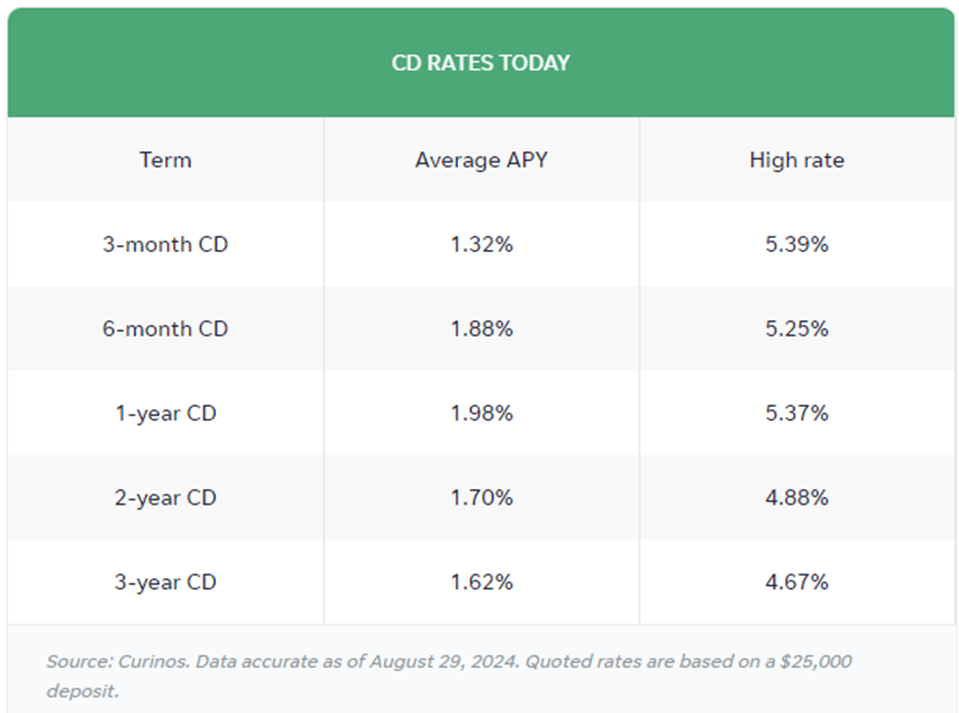
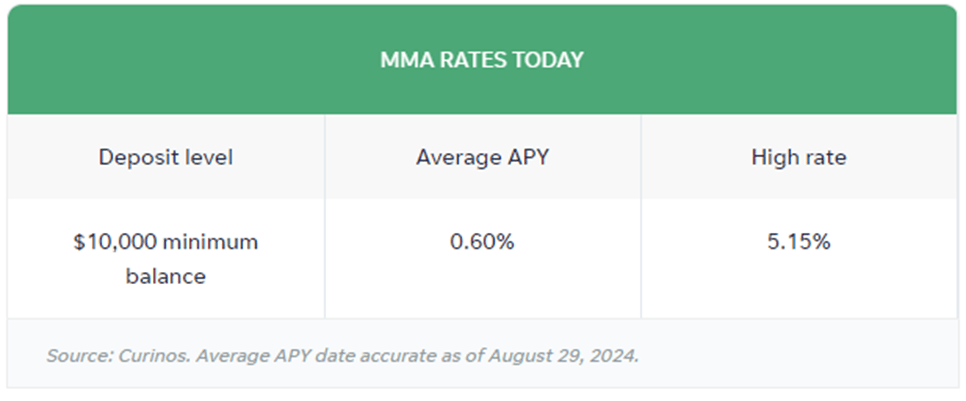
Now, take a look atthe top rates for CDs and money market accounts (MMA):
The best 1-year CD interest rate is currently at 5.39%, about the same as last month. The best 5-year CD rate right now is around 4.34%, a 16-basis point drop from last month. All the other rates pretty much stayed the same.
Savings rates are going to be coming down over the next year or so as long as inflation remains tame. If this holds true, it would be okay to put cash that you don’t need immediately in CDs with up to 2-year maturities. For emergency cash, stick to high yielding money market and savings accounts, which are still yielding well over 5%. As always, keep the total under $250,000 per person at any one bank to ensure you are fully covered by the FDIC.
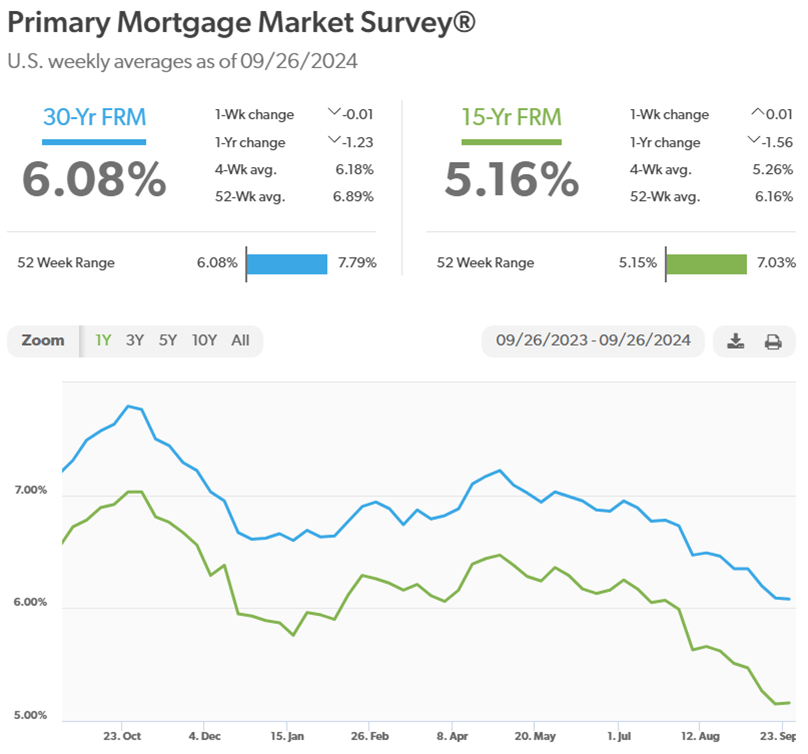
Mortgage rates continued to head lower in September, with the 30-year loan close to breaking 6%. Currently, the 30-year rate sits at 6.08%, lower than a month ago, at 6.35%. It’s still a seller’s market in the housing sector but with rates expecting to drop more over the next year, we should see homes become more affordable to first-time buyers and those owners who want to downsize but can’t let go of that 3% mortgage that they currently have.
Oil prices took another dip in September, despite chaos in the Middle East. Saudi Arabia’s plans to increase production and the slow economy in China are some of the reasons for the drop.
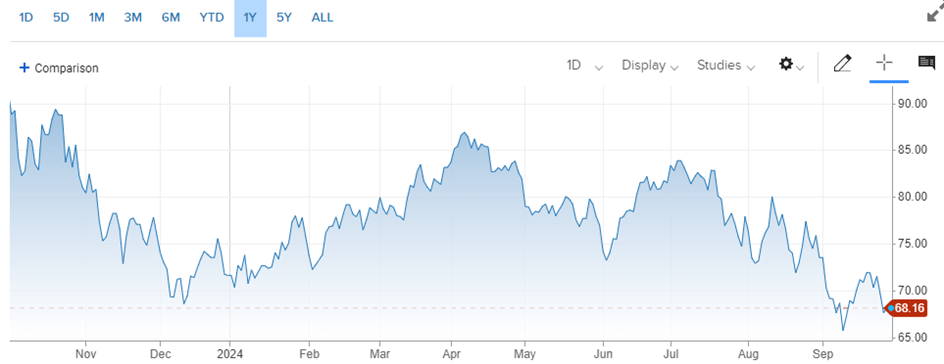
For the month, the price for a barrel of oil settled at $68.16, down from $73.43 at the beginning of September. For the year, the price difference is now negative, down about 5.0%. If China’s economy starts to rebound, we might not see oil dropping much lower than it is now. Oil, diesel, and gasoline prices are input costs for almost every product or service consumers use. So, watching the price trends of fossil fuels is a great leading indicator as to where consumer prices should be heading, which has been lower.
Here’s a look at the one-year chart for U.S. oil:
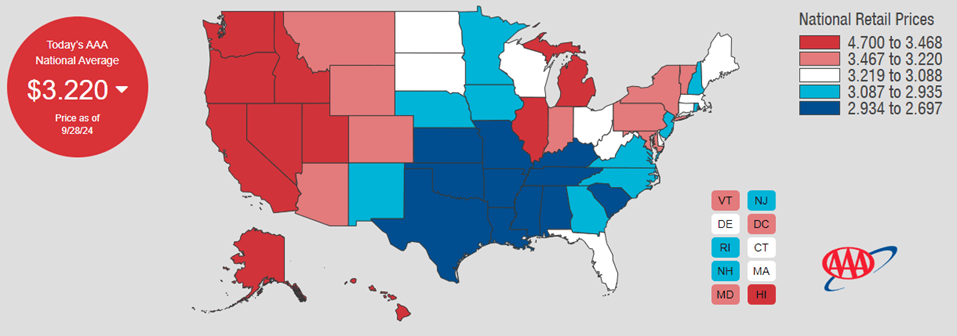
Gasoline prices continued to drop in September. Regular unleaded gasoline is now averaging $3.22 per gallon, down from $3.35 last month. Mississippi has the cheapest gas currently, checking in at $2.70 a gallon. California is back on top with the most expensive gasoline at $4.70 per gallon. FYI, a year ago, we were paying $3.84.
Check out the prices at the pump in your area: AAA Gas Prices.
Outlook
Events on the horizon that could move the markets in the near term:
Fed & Inflation: Everyone knew it was coming so it wasn’t a surprise when the Federal Reserve cut interest rates this past month. Stocks and bonds got a little bump, but it was pretty much factored into prices already. Data keeps coming in indicating that inflation continues to drop and also showing that the economy will most likely avoid a recession. If this comes to fruition along with more expected rate cuts by the Fed, this is a goldilocks scenario and could kickstart another leg higher for stocks.
Potential Asset Shift: Interest rates are coming down the other side of the mountain now. As money market and CD rates fall, some of that cash will start looking for a better rate of return and it could find its way into stocks, particularly high-quality stocks that pay a good dividend. It hasn’t really happened yet (there is still a record $6.3 trillion in money markets/CD/savings accounts) and there may be a few reasons. The first is that rates are still high compared to the past fifteen years so there’s no reason to move cash yet. The second reason could be that some investors may want to wait until after the election is over in November. Regardless, some portion of that cash will be coming over to the stock market and should provide some dry powder as rates drop and a floor for stock prices if there are any down swings in the stock market.
East Coast Port Strike: Longshoremen unions operating the east coast and gulf coast ports are set to strike this week which could disrupt the U.S. economy in a big way. Almost half of all containers coming into the country arrive on the east coast and every day the strike goes on, it will take a week to get the supply chain back to normal. This could cause a spike in inflation as demand outstrips supply during the strike and will shake up both the bond and stock markets until the strike is resolved.
Election: This year’s elections in early November will probably cause some volatility in the markets but shouldn’t last too long unless one party controls both houses of congress along with the executive branch, i.e., the president.
I think everybody knows the answer as to why we don’t make much stuff in the U.S. anymore. It’s because companies can make it cheaper, a lot cheaper, somewhere else. And in a capitalist society/economy, companies have to make a profit or won’t exist for long.
There are several factors that contribute to the higher cost of manufacturing in the United States, such as stricter regulations and higher infrastructure costs. But the biggest factor is higher labor costs.
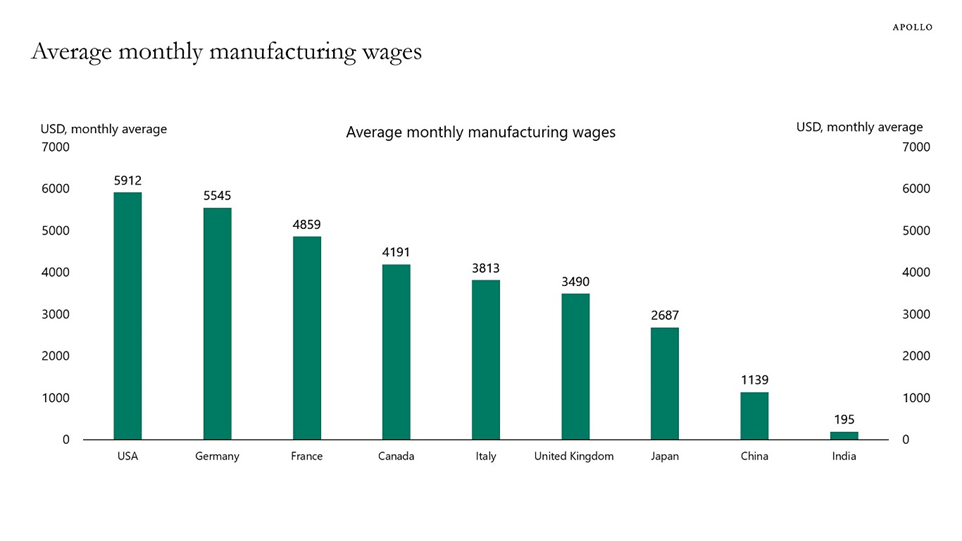
This chart below is all you need to see:
Note: Canada, United Kingdom, United States of America and India data is for 2023. Germany, France, Italy and China data is for 2022. Japan data is for 2021. Source: ILO, National Bureau of Statistics of China, Apollo Chief Economist
We are competitive with Germany and France, as you can see in the chart above. But it is an easy decision to make when deciding where to build something when comparing labor costs between the U.S. and China or India. That’s even if you factor in the cost of shipping it here as well.
Wages in the U.S. are higher mainly because our cost of living is higher, and the amount of available labor is so much more in both China and India. These two factors would be near impossible to change unless wages are reduced, and we allow more foreign workers to enter the country.
Made in America has value to many people and does get some people to buy the same product at a higher price, but not enough to make sense financially for a company.
Companies could cut prices, but that would reduce profits. They could reduce costs to offset the price cuts by becoming more efficient, especially by utilizing the latest advances in artificial intelligence. They could also trim some salaries of the higher ups, specifically the CEO.
In 2022, it was estimated that the CEO-to-worker compensation ratio was 344.3 in the United States. This indicates that, on average, CEOs received more than 344 times the annual average salary of production and nonsupervisory workers in the key industry of their firm. There’s got to be some wiggle room there.
It’s possible to restore our manufacturing prowess back to its glory days, but it would take some major improvements in the wages of most foreign countries and some sacrifices back here on our end to make it happen.
Please comment or send an email if you have any questions.
I was doing some research for a client on this topic a few days ago and thought it would be beneficial to post some basics of how the Social Security and Medicare programs interact with each other.
Social Security and Medicare are separate programs serving our country’s senior citizens as well as the disabled. But they do intersect in a big way: Social Security handles enrollment for Medicare Part A (hospital insurance) and Part B (medical insurance).
For most people, Medicare eligibility starts at age 65. If you are already receiving social security benefits at that time, you will be automatically enrolled in parts A and B. If you need a refresher on Medicare, here’s a nice overview of its different parts: https://www.ssa.gov/medicare/plan/medicare-parts.
If you have not yet filed for Social Security benefits, you will need to apply for Medicare yourself. You can do so any time during the initial enrollment period, which lasts seven months. This period starts three months before the month you turn 65 and ends three months after your birthday month. So, if your birthday is July 15th, the sign-up window runs from April 1 through Oct. 31. If you do not enroll during that period, you could end up paying penalty fees if you do so later.
Now let’s look at how you pay for Medicare. Most people don’t pay a monthly premium for Part A because they or a spouse paid Medicare taxes for at least 10 years while working.
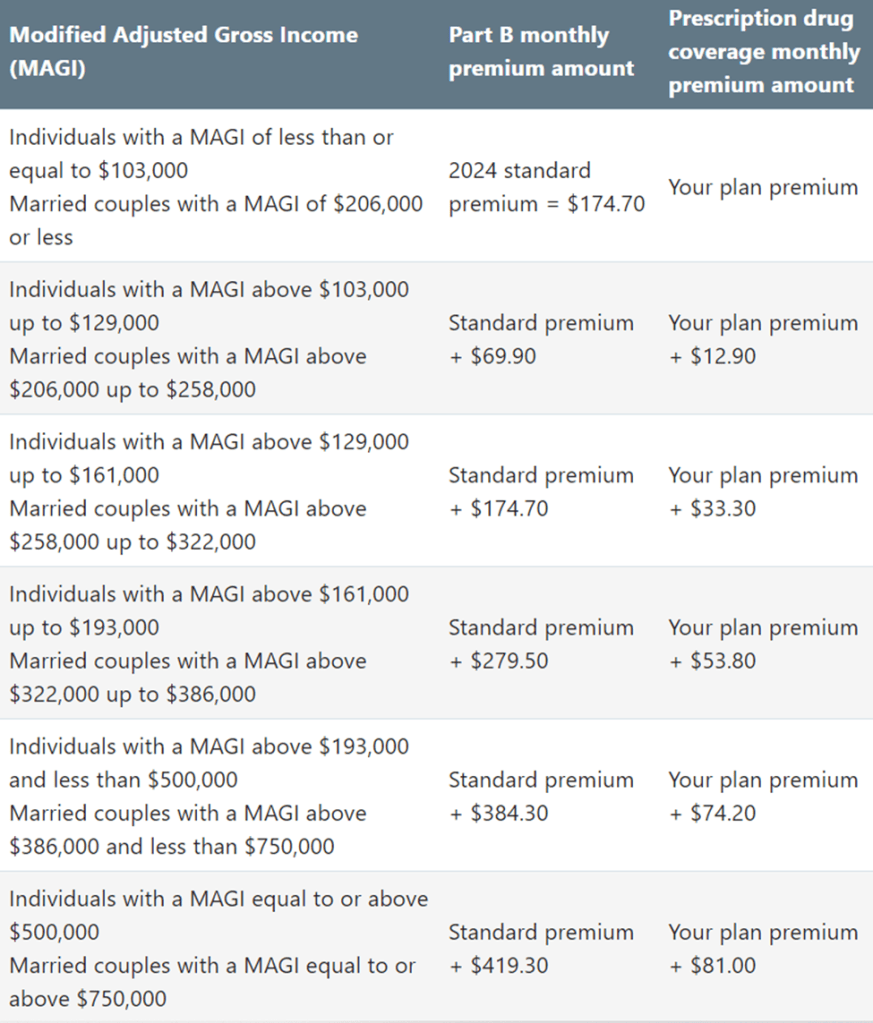
For Part B, there is a monthly premium that you pay, currently $174.70 per person in 2024. This is automatically deducted out of your Social Security benefit payments, if you are receiving them. If you haven’t started receiving your Social Security benefit payments yet, you can pay by mail or via online bill payment.
If your annual income exceeds a certain amount, you will have to pay a higher premium for Part B and Medicare prescription drug coverage premiums (also known as Medicare Part D).
Here’s the 2024 table for monthly Medicare premiums:
So, if you are a married couple with a MAGI below $206,000, you’ll only be paying $174.70 each per month in 2024.
Both the Social Security and Medicare programs are so complex. Be sure to do your research or contact program experts to answer your questions.
If you want more details on all things Medicare and Social Security, the best source is here: https://www.ssa.gov/.
Please comment or send an email if you have any questions.
Do you want to get paid by the IRS for contributing to your IRA or other retirement plans? Well, you can because they will pay you to save for retirement.
There is a little-known tax rule that has been around since 2002 called the Retirement Savings Contributions Credit (Saver’s Credit). This tax credit essentially pays you to put money into your IRA, Roth IRA, 401k, TSA, and most other retirement plans. Here’s a quick summary of how it works:
Eligibility
You are eligible for the credit if you meet certain criteria:
Income limits: Your adjusted gross income (AGI) must be below a certain threshold. The exact threshold varies depending on your filing status and whether you are a qualifying individual.
Contributions: You must make qualifying contributions to a traditional or Roth IRA, or to an eligible employer-sponsored retirement plan.
Age: You must be at least 18 years old and not a full-time student.
Credit Amount
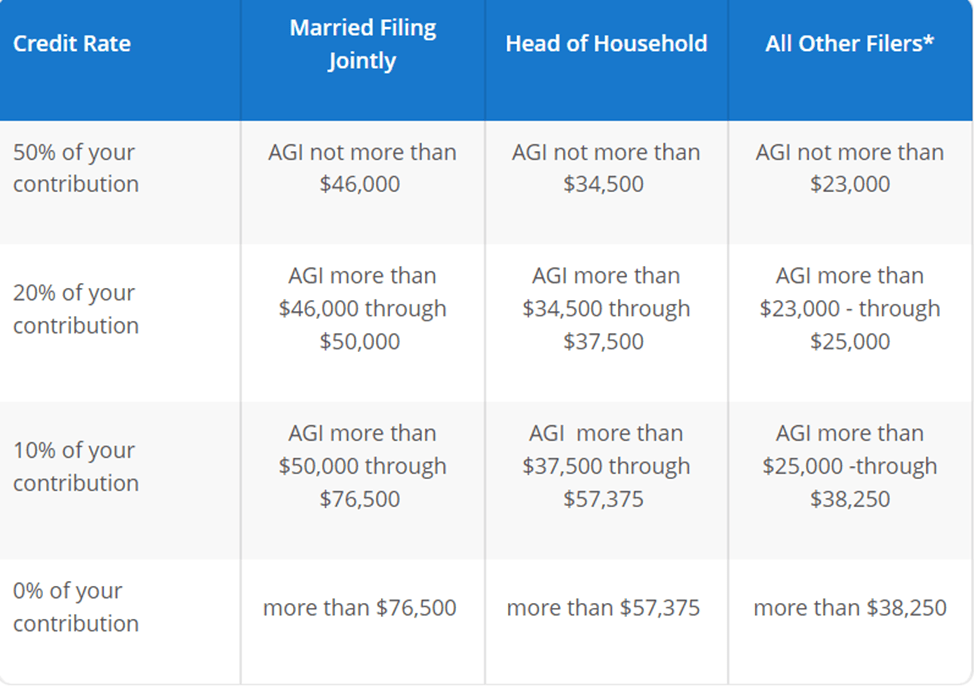
As with most tax credits, the amount is based on your adjusted gross income (AGI) in the year that you contribute. The maximum amount of the credit is 50% of the amount that you contribute to your retirement plan. The maximum contribution amount that can qualify for the credit is $2,000, making the maximum credit $1,000. Here is an example:
Jill, who works at a retail store, is married and earned $41,000 in 2024. Jill’s spouse was unemployed in 2024 and didn’t have any earnings. Jill contributed $2,000 to her IRA for 2024. After deducting her IRA contribution, the adjusted gross income shown on her joint return is $39,000. Jill may claim a 50% credit of $1,000 for her $2,000 IRA contribution on her 2024 tax return.
The following table shows how much of a credit that you are eligible for:
2024 Saver’s Credit Rates and Filing Status
For those that are eligible, it is like getting a match from the government on your contribution. Every little bit helps!
Please comment or send an email if you have any questions.
September 2nd – Labor Day. Stock and bond markets are closed.
September 22nd – First day of Autumn
Stocks made it a positive month in August, but it was quite the wild ride. Right at the beginning of the month, we had some weak economic data come in sparking fears that the U.S. was heading into a recession. It seemed like that coupled with Buffet selling almost all of his Apple shares and the federal courts finding Google guilty of violating antitrust laws all on the same day was enough for panic selling to ensue. As surprising as that all was, it was even more surprising how quickly stocks bounced back once everyone took a deep breath.
For the month, the S&P 500 was higher for the fourth month in a row, this time by 2.28%. For 2024, it is up 18.4%.
The Federal Reserve did not meet in August but had plenty of speaking time during their retreat at Jackson Hole, Wyoming. They basically said that it was time to start cutting interest rates. Everyone knew it was coming but the fact that they said it certainly helped calm the markets a little bit.
Besides rate cuts, we have another potential mover of stocks in September: The Past. Historically speaking, September is almost always the worst month for stocks. For the last twenty years, the S&P 500 has had a negative return of 0.60%. We will have to see if interest rate cuts or history will be more influential over the next 30 days.
Take a look at the Outlook section below to see what events could move the markets over the short term.
Bond prices made it four months in a row of positive gains, their longest run in three years. Government, corporate, and high yield bonds all moved higher as inflation continues to drop and the Federal Reserve gets ready to cut short-term interest rates this month.
The 10-year US Treasury note yield fell once again in August, finishing the month at 3.91%, lower than the 4.07% that it was at the beginning of the month. The 30-year bond yield closed out the month at 4.20%, lower than the 4.35% that it was a month ago.
Bond investors can rest a little easier now because it looks fairly certain what direction rates are going for at least the next year. Therefore, bond buyers holding to maturity could extend their maturity range out to two to three years and feel confident. If rates drop faster than expected, you can sell those bonds before they mature with some nice capital gains.
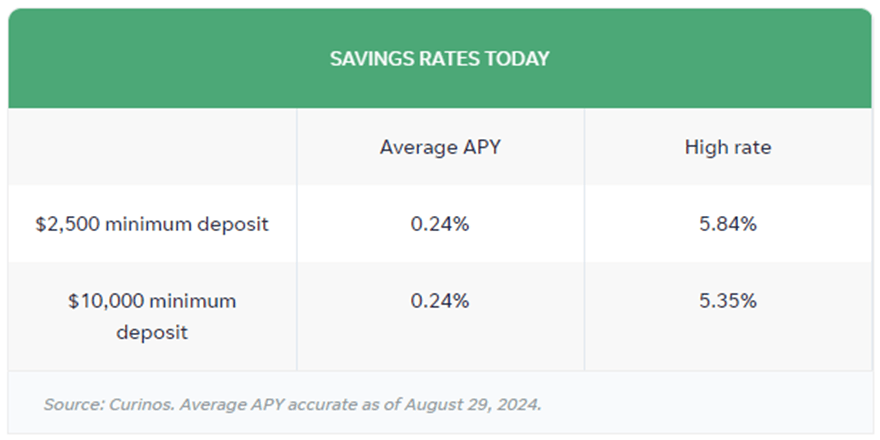
Savings rates have peaked, I believe, and are starting to roll over as a cut in interest rates by the Federal Reserve is imminent. There is still a ton of money parked in cash (CDs, MMA, Savings) and why not? You can still get over 5% return on your money, risk free. However, I don’t think these rates are going to be around much longer, especially if the Federal Reserve starts chopping rates. Having said that, CDs and MMAs continue to be a great place topark your cash and your emergency fund, for now.
Now, take a look at the top rates for CDs and money market accounts (MMA):
The best 1-year CD interest rate is currently at 5.37%, same as last month. The best 5-year CD rate right now is around 4.50%, a 25-basis point drop from last month. All the other rates pretty much stayed the same.
Savings rates are going to be coming down over the next year or so as long as inflation remains tame. If this holds true, it would be okay to put cash that you don’t need immediately in CDs with up to 2-year maturities. For emergency cash, stick to high yielding money market and savings accounts, which are still yielding well over 5%. As always, keep the total under $250,000 per person at any one bank to ensure you are fully covered by the FDIC.
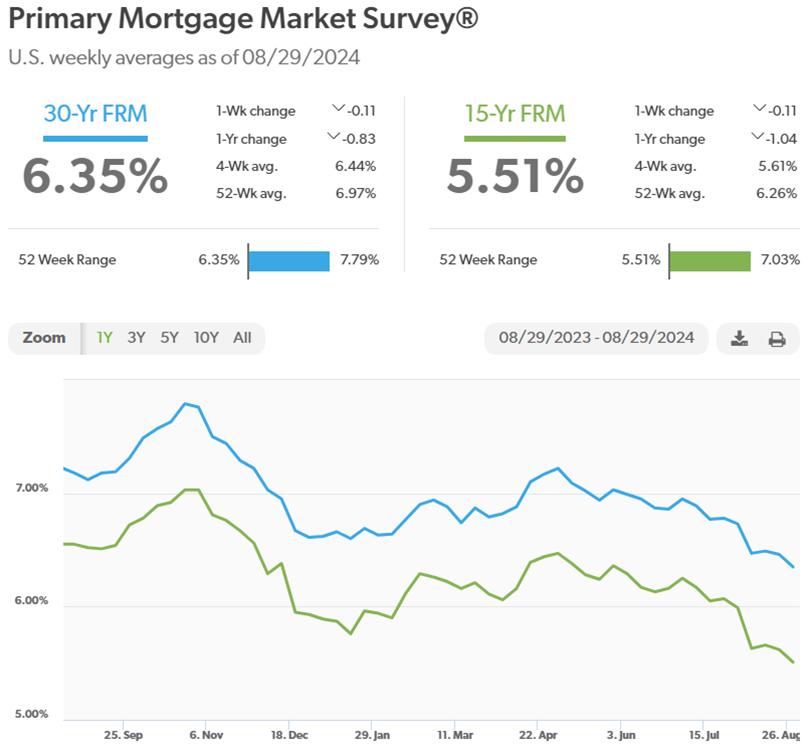
Mortgage rates dropped once again in August, hitting 15-month lows and falling further from the dreaded 7% mark for the 30-year rate. This is welcome news for the housing industry. Hopefully, 7% mortgages are in the rearview mirror for a long time. Currently, the 30-year rate sits at 6.35%, lower than a month ago, at 6.78%.
Oil prices fell again in August, even as tensions ramp up in the Middle East. Producers are pumping out the black gold, but demand hasn’t picked up as expected so we are seeing some excess supply.
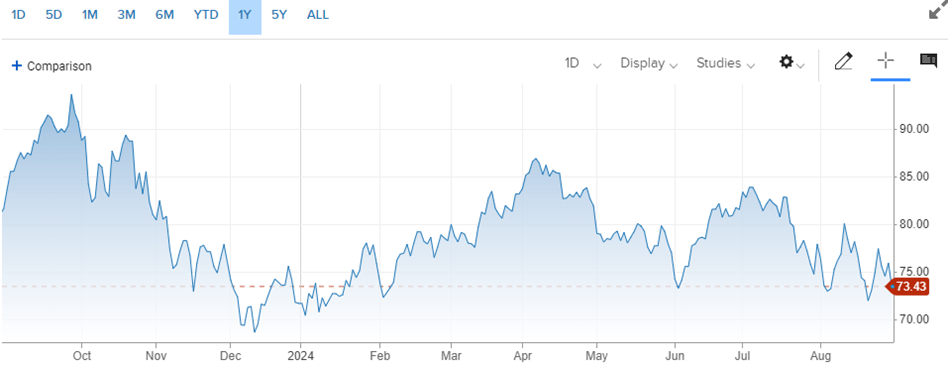
For the month, the price for a barrel of oil settled at $73.43, down from $77.91 at the beginning of August. For the year, it is only up about 2.4%. Oil, diesel, and gasoline prices are input costs for almost every product or service consumers use. So, watching the price trends of fossil fuels is a great leading indicator as to where consumer prices should be heading, which should be lower now.
Here’s a look at the one-year chart for U.S. oil:
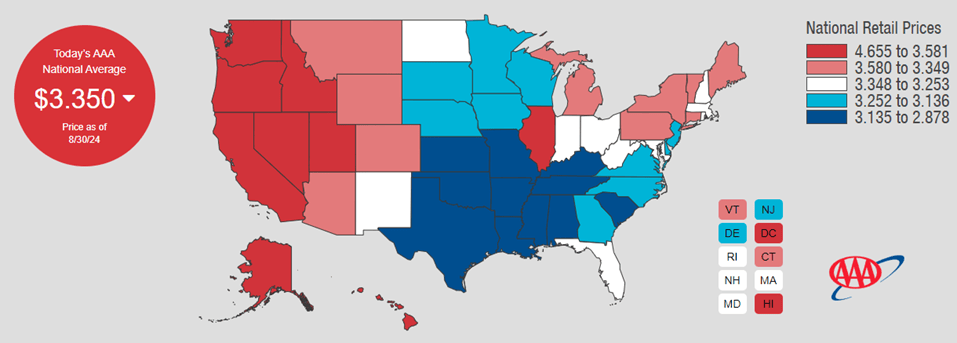
Gasoline prices dropped nicely in August, following oil’s lead. Regular unleaded gasoline is now averaging $3.35 per gallon, down from $3.49 last month. Mississippi has the cheapest gas currently, checking in at $2.88 a gallon. Hawaii has the most expensive gasoline at $4.66 per gallon. FYI, a year ago, we were paying $3.83.
Check out the prices at the pump in your area: AAA Gas Prices.
Outlook
Events on the horizon that could move the markets in the near term:
Fed & Inflation: Well, it’s pretty much a lock that the Federal Reserve Open Market Committee (FOMC) will cut short-term interest rates at least 25 basis points at their next meeting this month. Inflation is on a steady glide path to the Fed’s 2% target. For consumers, that just means prices have stopped going up so fast but are still high. We will need deflation to get prices down to where they were before the pandemic, but that’s probably not going to happen. So, wages will have to continue to rise, which they have been for most professions, albeit at a slower pace more recently. It will remain tough for people on fixed incomes, such as retirees.
Back to the rate cut, I don’t expect it to move the markets very much since it is probably baked into the cake already. However, if this is the start of several cuts in the months ahead, this should provide the next catalyst for stocks and bonds to move higher.
Potential Asset Shift: Interest rates have rolled over and should continue downward as the Fed starts hacking away at them over the next year or so. We are already starting to see money flow from bonds and money markets to stocks. I suspect that it will flow to the highflyers in technology but also to dividend- paying stocks, such as utilities, REITs, etc., so investors can continue to generate investment income similar to what they were getting in the fixed income markets. There’s still about $6 trillion sitting in money market funds which could provide a nice boost to stocks if rates continue to drop.
When will we see food prices come down to where they were before the pandemic? Probably not anytime soon, if ever. The combination of the pandemic, the Russia-Ukraine war, and more recently, droughts and an avian flu outbreak, have cut supply and raised the costs of producing and transporting food products. These increased costs have been passed on to us, the consumers. The good news is that grocery inflation has come down to levels that were around before the pandemic so we should expect prices to not rise as much going forward.
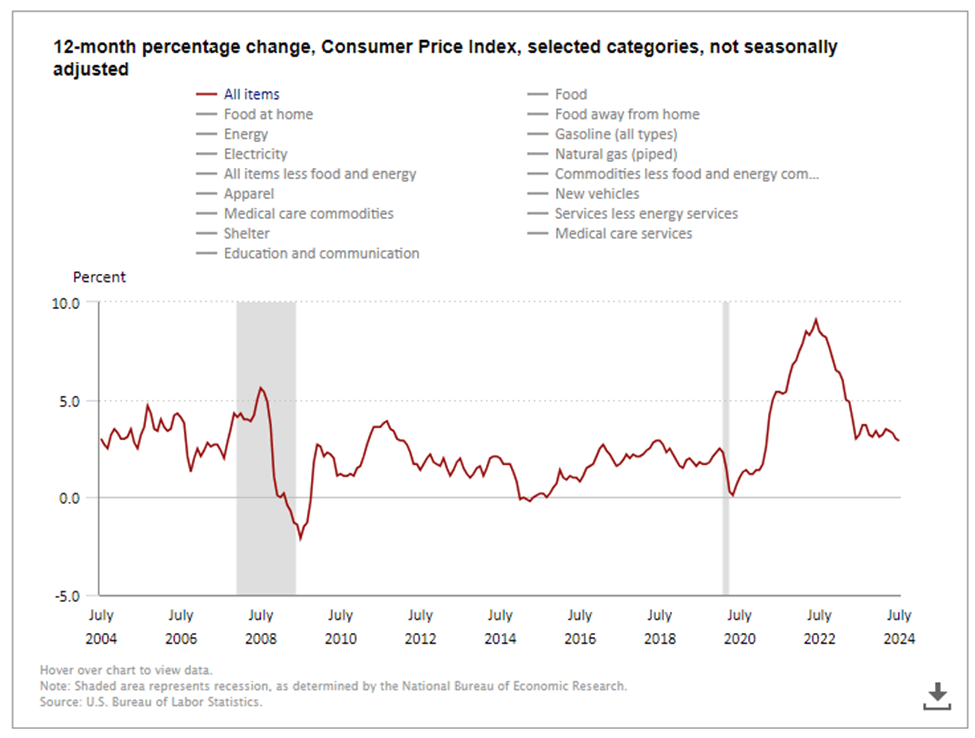
One piece of data that supports this is the most recent Consumer Price Index (CPI) reading that came out today. It shows that price hikes slowed more than expected in July, and, for the first time in more than three years, the CPI has landed below 3%. Here is a chart of CPI over the last twenty years. Shaded areas are periods of recession.
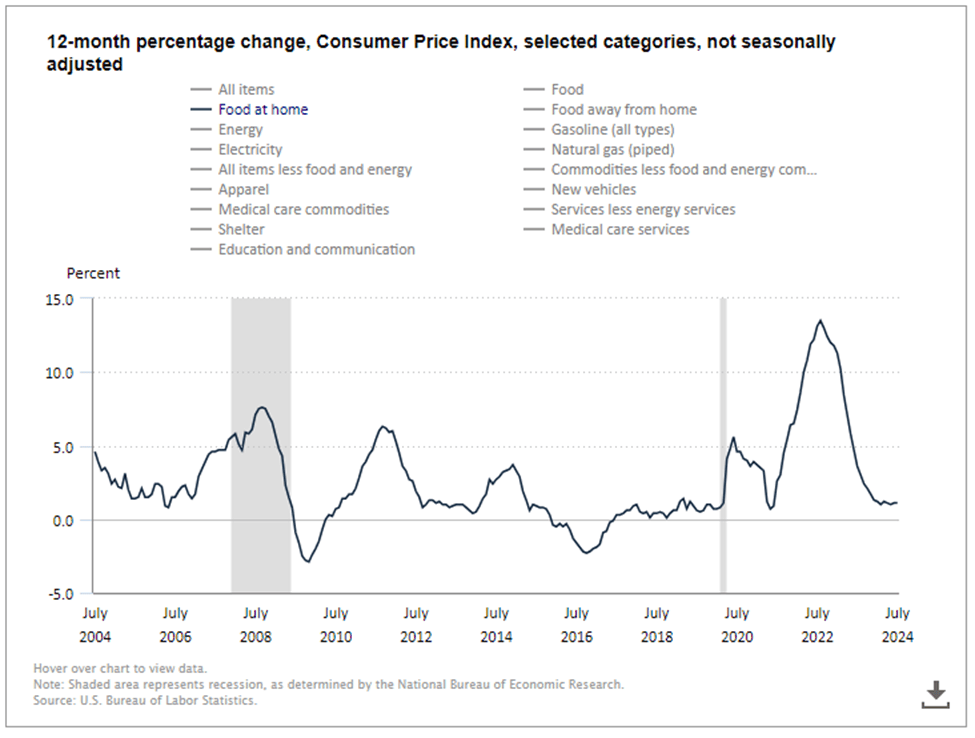
As you can see, it peaked at about 9.1% in June of 2022. Since we’re talking about groceries, specifically, here is the chart of Food at Home, or groceries:
Grocery inflation peaked at 13.5% in August of 2022. Since then, it has steadily declined and has levelled off throughout 2024 so far. Remember, this shows that price increases have slowed down, not that actual prices have dropped. If prices were dropping, we would be in a deflationary period (negative inflation, if you will). Historically, food deflation happens about once a decade and lasts about eight months. The last times this happened were in 2008/2009 and 2016/2017. This is where the CPI line dips below the 0% horizontal line in the chart above.
All this to say that prices at the grocery store should be stabilizing going forward but very unlikely to come down signficantly. You can check out prices of specific grocery items on the U.S. Bureau of Labor Statiistics’ website. They have all sorts of interesting data and charts on our economy.
Please comment or send an email if you have any questions.
As the old Wall Street adage goes, it is time in the market, not timing the market, that will make you a successful investor. We are coming up on an event that will test this saying once again.
As the presidential election approaches, many investors are contemplating whether or not to sell their investments and put the proceeds in cash, depending on who they think will be in the White House in 2025. This has been the case during every election since I have been in the business (over 25 years) but has been much more pronounced in the past two presidential elections, in 2016 and 2020.
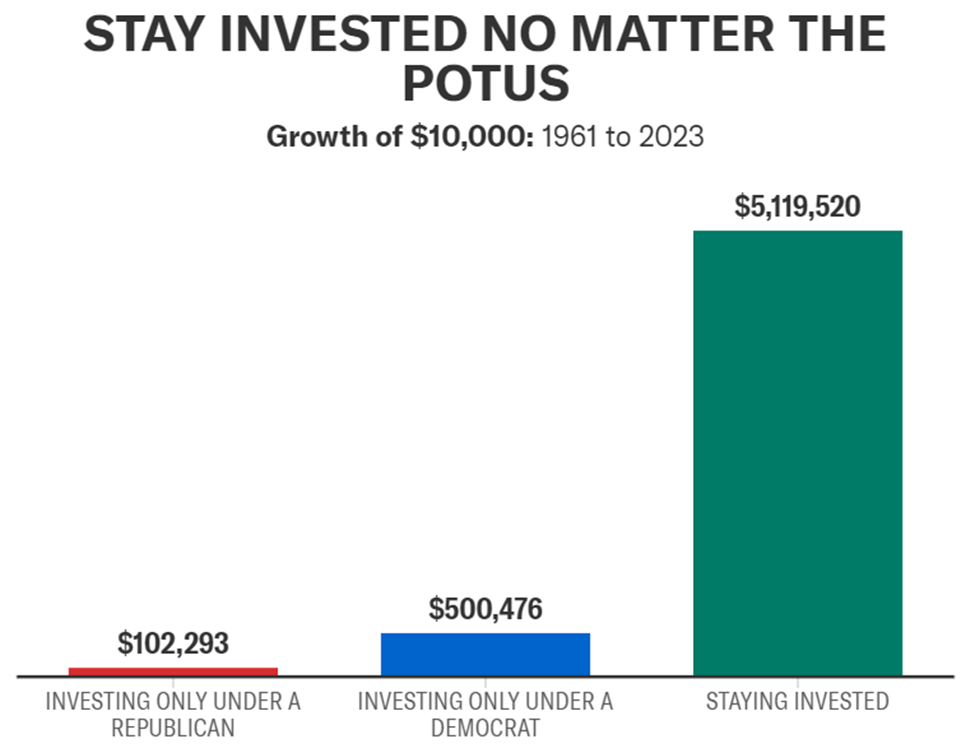
Sadly, this strategy never works. I have seen investors wait years to get back in the market, missing out on huge gains because of their political preferences. Presidents have little influence on the economy and even less on stock market performance. In fact, Schwab strategists recently produced a great observation of historical data about this very topic:
If you started with $10,000 in 1961 and invested in the S&P 500 only when there was a Republican in the White House, your investment would have grown to $102,000 in 2023. If you did the same but with a Democrat in the White House, that investment would have grown to $500,000. But none of that compares with the $5.1 million you would have had if you had stayed invested the whole time, regardless of who was president.
So, go vote for your candidate and feel good about it, but regardless of who wins, stick with your investment plan. You’ll be glad you did.
Please comment or send an email if you have any questions.
Stocks eked out a monthly gain after a huge day yesterday mainly due to the Federal Reserve meeting and what they said once it ended. The big technology stocks, however, took a beating this past month, which means the markets were helped by other sectors of the economy. This is good to see that the gains are more broad-based, which is a sign of a healthy stock market.
For the month, the S&P 500 was higher by 1.13%. For 2024, it is up 15.8%.
The Federal Reserve kept interest rates unchanged after their meeting ended yesterday but greased the skids for a rate cut when they meet next in September. Q2 earnings are coming out in droves right now and are moving stocks along with the Fed in an otherwise quiet time in the markets.
Historically, August has been the worst month for stocks over the last forty years. This is not surprising since most of the financial world is on vacation, Europe is on holiday, and Congress is out of session until September. Nothing is getting done in August.
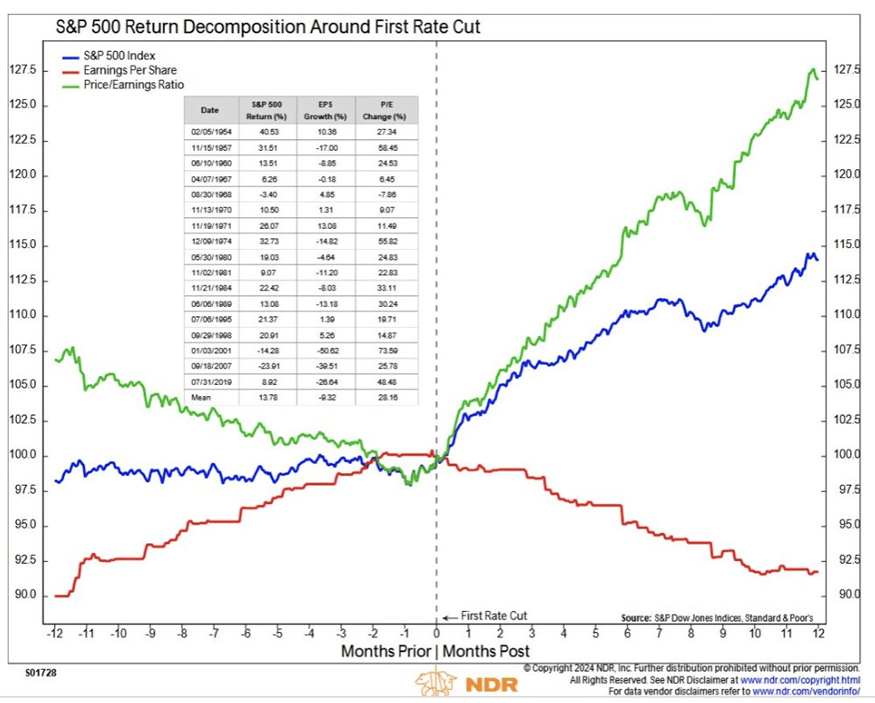
Besides history, another potential market catalyst is interest rate cuts, which appear to be imminent, so let’s go to the charts. The only thing I want you to take away from the following chart is the blue line, which is how the S&P 500 index has performed one year before and one year after the Federal Reserve does their first rate cut:
As you can see, stocks are relatively flat the year prior to starting rate cuts and perform pretty good in the year following the first rate cut by the Fed. In the current scenario, stocks have done extremely well in the past twelve months, assuming a rate cut is coming in September. So, can we expect stocks to follow this blue line after a rate cut? Personally, I feel rate cuts have been telegraphed for so long that the first few might already be baked into stock prices, but we will have to wait and see.
Take a look at the Outlook section below to see what events could move the markets over the short term.
Bond prices marched higher for the third consecutive month as inflation continues to cool. Although the Federal Reserve held rates steady again yesterday, their comments laid the groundwork for a rate cut in September. As of right now, if they don’t cut rates in September, that would be a surprise.
The 10-year US Treasury note yield fell in July, finishing the month at 4.07%, lower than the 4.39% that it was at the beginning of the month. The 30-year bond yield closed out the month at 4.35%, lower than the 4.55% that it was a month ago.
Bond investors still need to be cautious even if the data points to rates trending lower in the near future. Therefore, bond buyers should continue to focus on bonds with short-term maturities. I would keep maturities under 18 months and just plan on holding these bonds to maturity. That way, you won’t have to worry about selling at a discount if interest rates head higher.
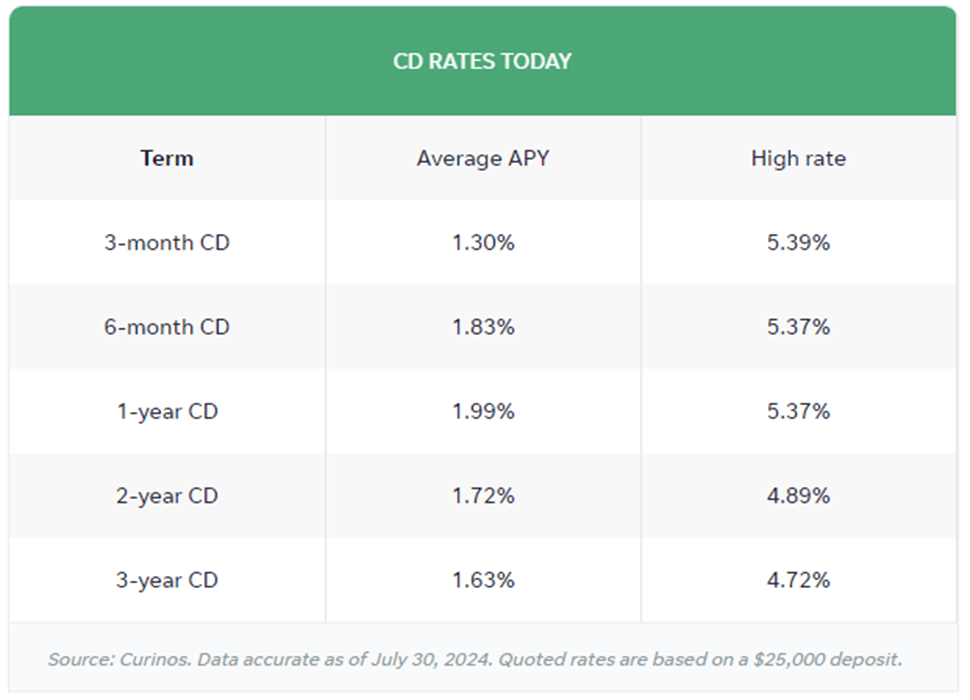
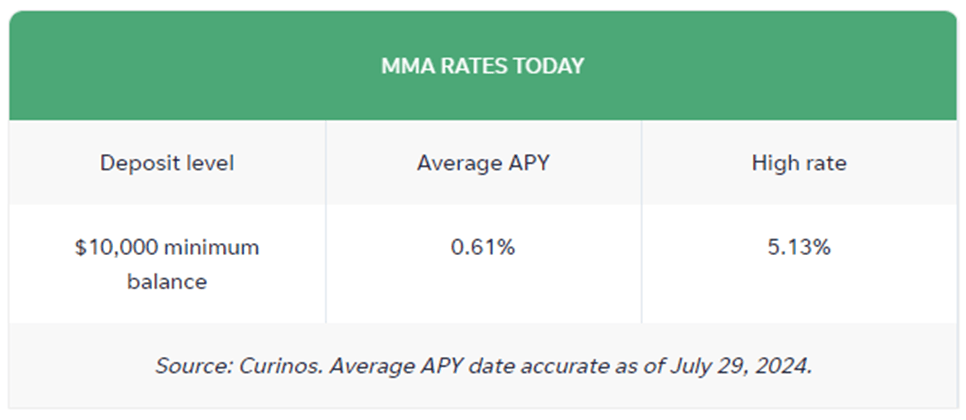
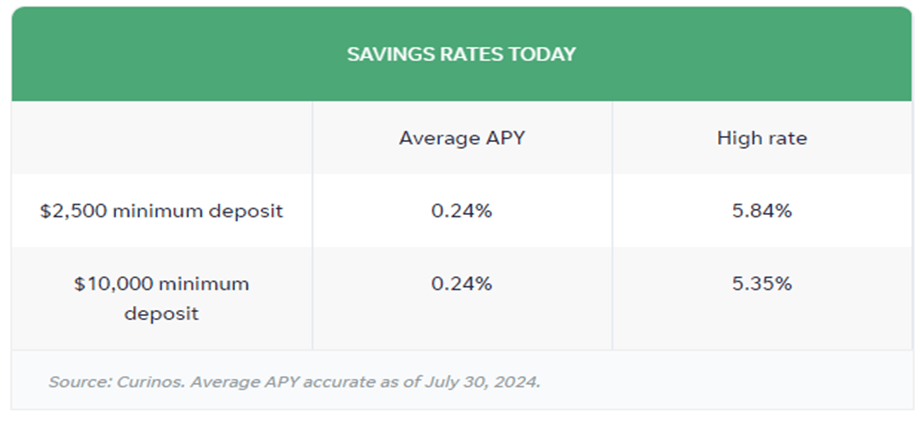
Savings rates are starting to roll over as we get closer to a rate cut by the Federal Reserve. You can definitely see the drop in rates the farther that you go out on the CD maturity timeline. Still, if you shop around, you can park money in savings and get almost double the interest that you are paying on a mortgage that was refinanced back in 2020/2021. That is fantastic for those homeowners. High interest rates aren’t always bad. CDs and MMAs continue to be a great place to park your cash and your emergency fund. These rates keep savings accounts in the running as a legitimate alternative to stocks and bonds, especially for risk-averse investors, and will keep pressure on those markets until we see this trend reverse, which looks like it will be happening most likely in Q4 of this year.
Now, take a look at the top rates for CDs and money market accounts (MMA):
The best 1-year CD interest rate is currently at 5.37%. The best 5-year CD rate right now is around 4.75%. Rates became inverted again after only a short time with the 5-year yielding more than the 1-year.
Eventually, savings rates will normalize but not until inflation comes down enough for the Fed to feel comfortable lowering interest rates. That said, I would still put my savings or emergency spending money into short-term CDs, 1 year or less, and reevaluate when they mature. If you would rather have more liquidity, look into an MMA (some yielding close to 5.5% currently). Keep the total under $250,000 per person at any one bank to ensure you are fully covered by the FDIC. CDs and MMAs have become nice alternatives for risk-averse investors and have drawn money away from stocks because of their relatively high rates that carry virtually no risk.
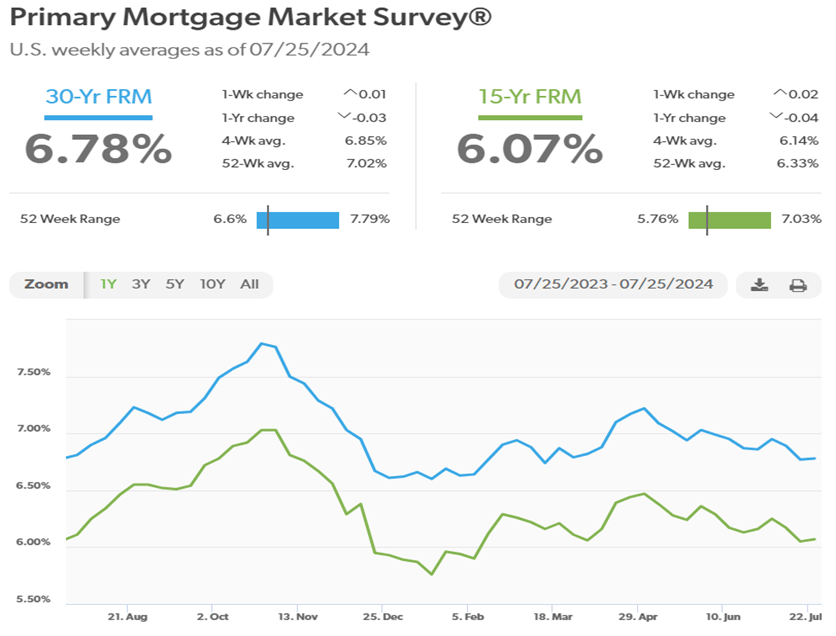
Mortgage rates dropped once again in July, remaining below the 7% mark once again for the 30-year rate. If this downward trend continues, this could be the last we see of 7% mortgages for a while. Currently, the 30-year rate sits at 6.78%, lower than a month ago, at 6.87%. Housing inventory continues to build. In fact, it is at its highest level since June 2020, but it is still far below pre-pandemic levels. This should keep a floor under home prices for now.
Oilprices took a welcomed dip in July as the U.S. continues to increase production, now the largest oil producer on the planet. The drop would have been even bigger if it weren’t for the charlie foxtrot going on in the Middle East between Israel and Hamas.
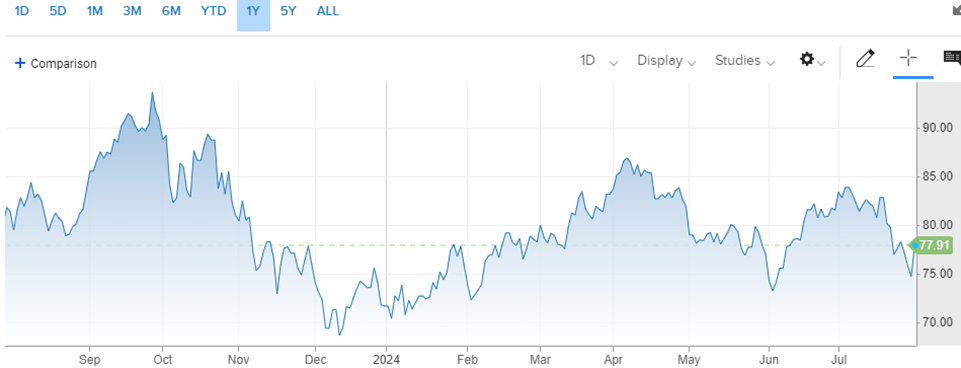
For the month, the price for a barrel of oil settled at $77.91, down from $81.46 at the beginning of July. For the year, it is up about 9%. Oil, diesel, and gasoline prices are input costs for almost every product or service consumers use. So, watching the price trends of fossil fuels is a great leading indicator as to where consumer prices should be heading.
Here’s a look at the one-year chart for U.S. oil:
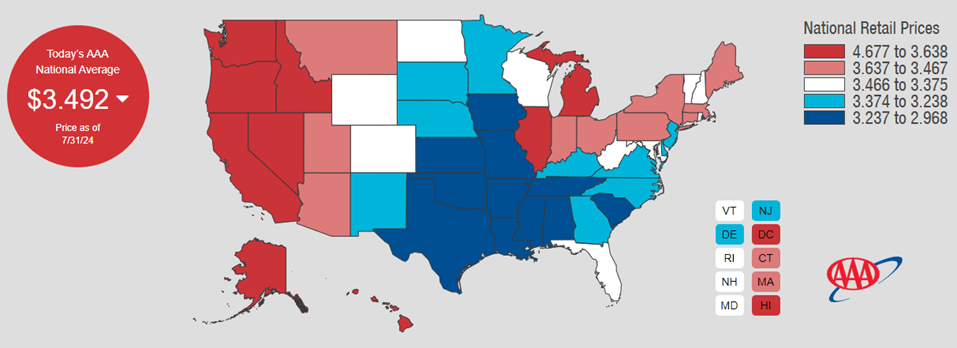
Gasoline prices dropped slightly in July even as hurricane season ramped up along with summer driving. Hopefully, the big drop in oil prices will be reflected in gas prices this month. Regular unleaded gasoline is now averaging $3.49 per gallon, down from $3.50 last month. Mississippi has the cheapest gas currently, checking in at $2.97 a gallon. Hawaii has the most expensive gasoline at $4.68 per gallon. FYI, a year ago, we were paying $3.76.
Check out the prices at the pump in your area: AAA Gas Prices.
Outlook
Events on the horizon that could move the markets in the near term:
Fed & Inflation: The Federal Reserve Open Market Committee (FOMC) held short-term interest rates steady once again, following the conclusion of their meeting yesterday. Inflation data continues to trend lower and now we are also seeing wage growth slowing. This isn’t great news, but it is better than mass layoffs. Also, there are still almost 8.2 million job openings out there, which is a positive. Also, consumers will be more discerning about where to spend their money – read tightening our belts. Like I said earlier, it feels like a 25-bps rate cut is already priced into the stock market but if it leads to a few more cuts, we could get a nice boost for both stock and bond prices.
Potential Asset Shift: Interest rates appear to have peaked and are rolling downward as inflation cools and in anticipation of rate cuts by the Fed. If we have peaked and rates continue to drop, we could see money flow from savings accounts, money market accounts and CDs to stocks, especially high-quality dividend paying stocks. This is the potential source for the fuel to send the stock market higher after its impressive run in the past 18 months. Just looking at money market assets, there is currently about $6.1 trillion sitting in MMA. That’s a lot of fuel.