I recently took a look at a whole bunch of economic data charts compiled by economists and strategists from the financial world. Much of this information shows that the U.S. economy can still achieve a soft landing coming out of the interest rate hiking cycle of the past few years.
Regarding the stock market, there are mixed reviews with some showing further room to run in this current bull market while others expect a pullback, especially with uncertainty picking up as we approach the November elections.
Here are a few of those charts that I wanted you to see:
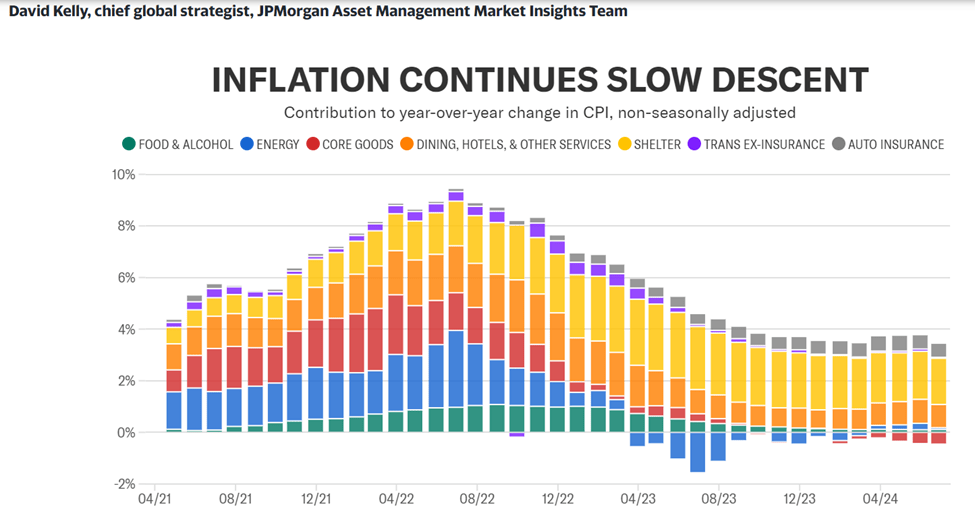
Shelter and auto insurance have been the two stubborn pieces of inflation that haven’t subsided yet. The good news is that rents and mortgage rates are rising much slower or even dropping in some areas, which should help get inflation down to the Federal Reserve’s target of 2% sometime in 2025.
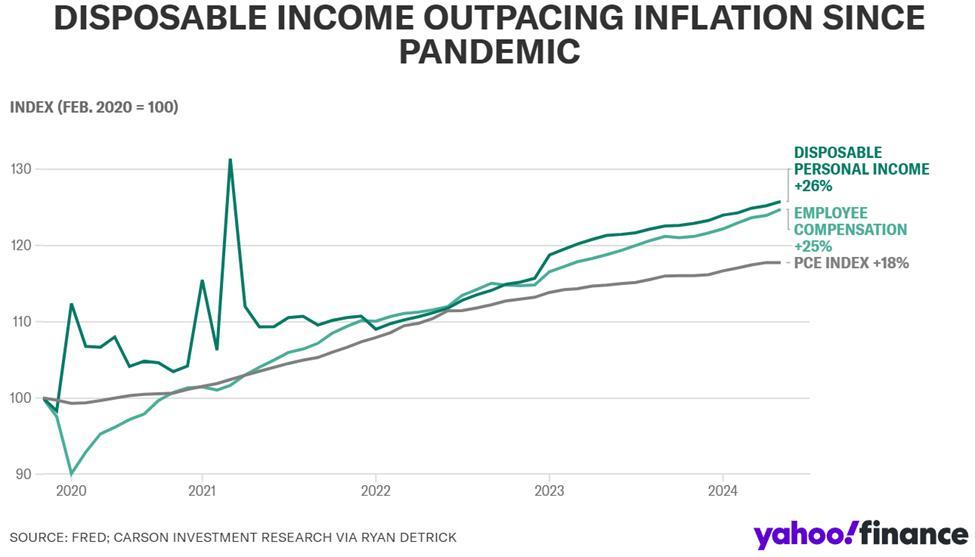
Because inflation has taken up all the oxygen in the room over the past few years, disposable income outpacing inflation is not a well-known statistic, but here it is. Both employee compensation and disposable personal income have increased more than inflation since the pandemic. Also, inflation is expected to continue to drop through the rest of this year, so consumers should see their disposable income increase, assuming their salaries remain the same.
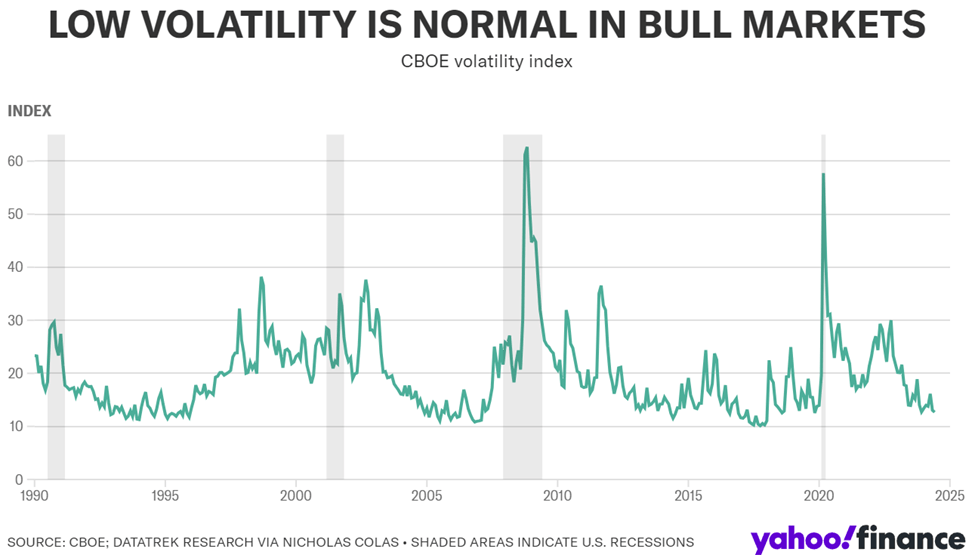
Chicago Board Options Exchange (CBOE) Volatility Index, more commonly known as the VIX, is an options-based measure of expected S&P 500 volatility over the next 30 days. When this indicator is consistently below 20, stocks tend to perform well. This was the case in the mid-1990s, mid-2000s, and much of the 2010s. When the VIX spikes, it is an indicator of a recession, of which the four most recent are shown as the shaded regions in the chart above. So, we could be in a period of low VIX, which is good for stocks, or about to enter a period where the VIX spikes. Interest rate and election forces will be what moves this index through the rest of this year.
To summarize, the economy and markets have done well so far in 2024 but it feels like we are at an inflection point now. The two big influencers are interest rates and the elections. These will dictate how we finish up in 2024. It should be an interesting ride into the end of the year.
Please comment or send an email if you have any questions.
The Letter of Final Instruction (LOFI) should be a major part of everyone’s estate plan. Unfortunately, I rarely see one when reviewing a client’s financial documents.
The LOFI isn’t a legal document like a will or trust. It is simply a document that provides your family with guidance upon your death on little things that wouldn’t necessarily go into a legal document. It is a godsend for family members, especially after a sudden, unexpected death. I have seen many a family become completely stressed out and overwhelmed when dealing with the aftermath of a death of a loved one.
The LOFI provides important information to heirs, such as location of safe deposit box keys, insurance policy info, financial account numbers, online passwords, etc. It also allows you to direct where you want your personal belongings to go to, such as your 100-year-old china set or your vintage ‘65 Mustang. These items typically aren’t specified in a will or trust. However, you can reference a LOFI in a will or living trust. That way, if you need to make changes, you can simply change the LOFI without having to amend the will or trust, since that takes the assistance of an attorney.
The LOFI should be distributed to all immediate family members and updated annually, if needed. I keep mine as a pdf file on my computer as well as a hard copy that I leave on my desk when I travel.
You can also just do an internet search for letters of final instructions, and you’ll find a bunch of resources to use.
Get going on this, even if you don’t have a will. Something is better than nothing. Having a LOFI for your family will give you peace of mind and will help your heirs deal with settling your estate without all the stress and confusion.
The construction industry has finally recovered from the financial crisis of 2008, although the recovery didn’t happen in the same sectors that went bust sixteen years ago.
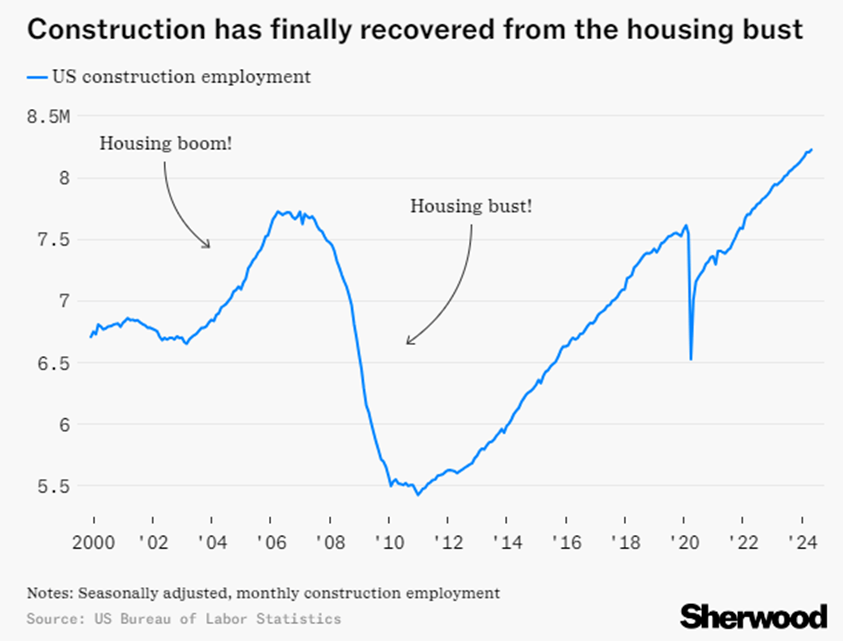
First, take a look at the following graph that shows construction employment from 2000 until now:
As you can see, employment in the construction industry plummeted by about 2.25 million jobs following the ’08 financial crisis and almost made it back until the pandemic hit in 2020. But now, the industry has fully recovered and then some.
What’s most interesting is that much of the job growth is coming from specialty contractors working in the non-residential sector. The building boom is occurring in the technology industry: AI data centers and microchip fabrication plants to be specific.
This has ripple effects for many industries, such as raw materials, construction machinery, and of course, technology. It can be a good starting point if you are looking for investment ideas and is very helpful if you are a real estate investor, especially if you want to diversify away from office properties, which have still not recovered from the pandemic.
Please comment or send an email if you have any questions.
Thursday, July 4th, Independence Day. The stock market is closed. Also, markets will close early at 1:00 pm on Wednesday, July 3rd.
Stocks delivered positive returns again in June as investors continue to bank on the Federal Reserve cutting rates sooner rather than later. It appears that a rising stock market and above average interest rates can coexist, just like they did forever until the financial crisis of 2008.
For the month, the S&P 500 was higher by almost 3.50%. For 2024, it is up 14.5%.
Economic data continue to show inflation cooling down. Regarding food prices, I have seen actual proof at Walmart with all of the Rollback price signs out, especially in the grocery section.
Companies are going to start reporting Q2 earnings shortly and that should cause some short-term market volatility.
Historically, July has emerged as the best month of the year, on average, in terms of stock-market performance. Since 1928, the S&P 500 has experienced an average gain of 1.7% in July, according to Dow Jones Market Data. We beat the average gain in June. Now, let’s see if we can do it again in July.
Take a look at the Outlook section below to see what events could move the markets over the short term.
Bond prices continued higher for a second month in a row as inflation data confirmed that prices were rising at a slower pace on a year-over-year basis. This is giving the Federal Reserve more confidence that inflation is cooling down enough for them to cut rates at some point this year. That said, nobody expects them to cut rates at the next FOMC meeting at the end of July, but more and more economists expect a cut in September.
The 10-year US Treasury note yield fell in June, finishing the month at 4.39%, lower than the 4.51% that it was at the beginning of the month. The 30-year bond yield closed out the month at 4.55%, lower than the 4.65% that it was a month ago.
Bond investors still need to be cautious even if the data points to rates trending lower in the near future. Therefore, bond buyers should continue to focus on bonds with short-term maturities. I would keep maturities under 18 months and just plan on holding these bonds to maturity. That way, you won’t have to worry about selling at a discount if interest rates head higher.
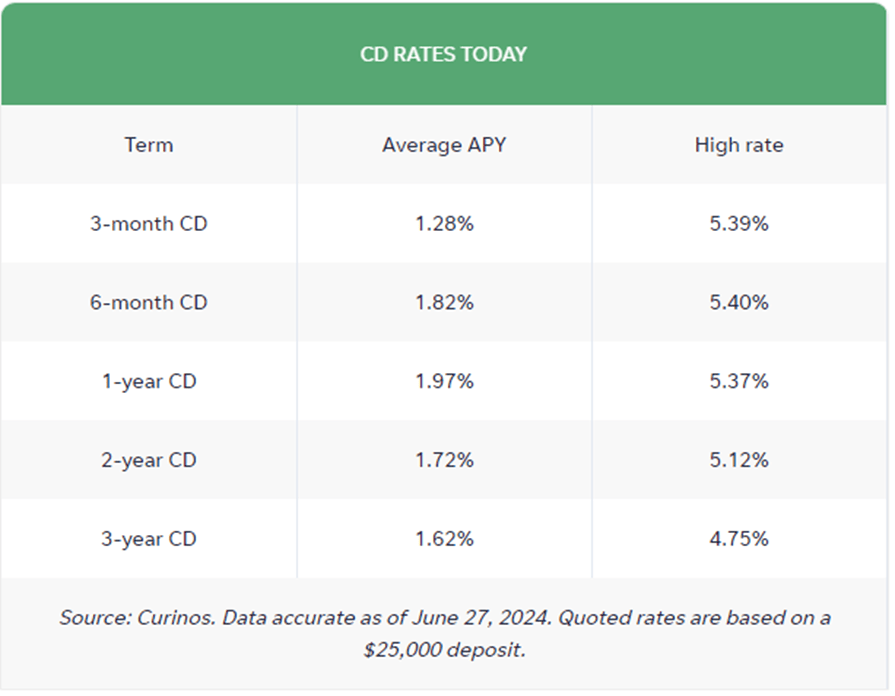
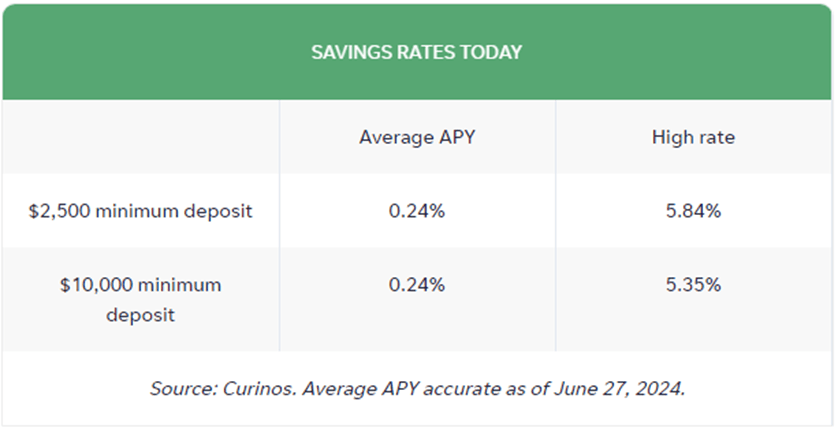
Savings rates remained pretty much unchanged this past month once again, keeping rates at their highest levels since 2007. For most homeowners with a mortgage that is more than 18 months old, it is nice when your savings account is paying more interest to you than you are paying to your mortgage lender. CDs and MMAs continue to be a great place to park your cash and your emergency fund. These rates keep savings accounts in the running as a legitimate alternative to stocks and bonds, especially for risk-averse investors, and will keep pressure on those markets until we see this trend reverse, which looks like it will be happening much later in the year than expected.
Now, take a look atthe top rates for CDs and money market accounts (MMA):
The best 1-year CD interest rate is currently at 5.37%. The best 5-year CD rate right now is around 4.80%. Rates became inverted again after only a short time with the 5-year yielding more than the 1-year.
Eventually, savings rates will normalize but not until inflation comes down enough for the Fed to feel comfortable lowering interest rates. That said, I would still put my savings or emergency spending money into short-term CDs, 1 year or less, and reevaluate when they mature. If you would rather have more liquidity, look into an MMA (some yielding close to 6% currently). Keep the total under $250,000 per person at any one bank to ensure you are fully covered by the FDIC. CDs and MMAs have become nice alternatives for risk-averse investors and have drawn money away from stocks because of their relatively high rates that carry virtually no risk.
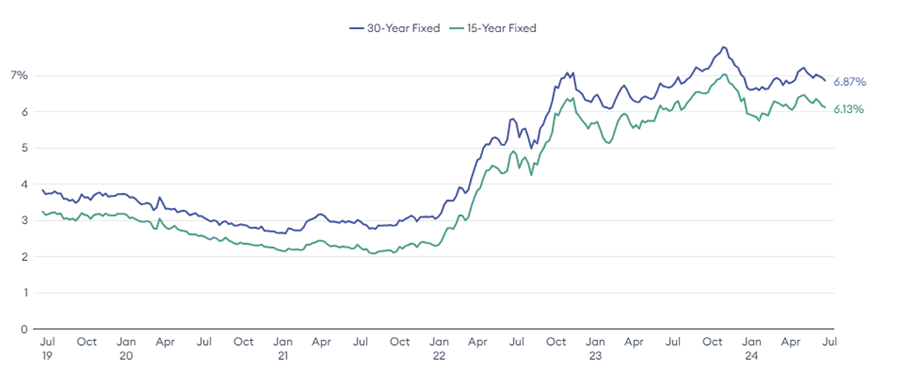
Mortgage rates continued sliding down in June, dropping below the 7% mark once again for the 30-year rate. It seems like 7% is the battleground for mortgage rates as you can see in the chart below. It has been meandering above and below the 7% line since Octoberof last year. Currently, the 30-year rate sits at 6.87%, lower than a month ago, at 7.03%. Home sales have stalled, keeping demand subdued for mortgage loans. Plus, there is very little incentive to buy a home with rates where they are right now. That will not change until mortgage rates fall. For now, the industry continues to bank on the Federal Reserve to get it squared away and that means rate cuts.
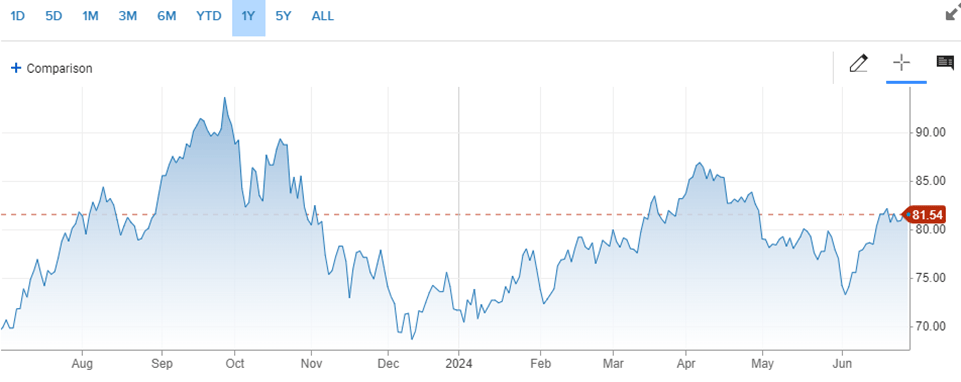
Oilprices recovered in June after a two month drop as tensions in the middle east offset the buildup of inventory in the U.S., which comes as no surprise to anyone. Also, the higher potential of rate cuts here in the states might have contributed to the bump up in oil prices.
For the month, the price for a barrel of oil settled at $81.46, up from $76.99 at the beginning of June. For the year, it is up about 13.7%. Oil, diesel, and gasoline prices are input costs for almost every product or service consumers use. So, watching the price trends of fossil fuels is a great leading indicator as to where consumer prices should be heading.
Here’s a look at the one-year chart for U.S. oil:
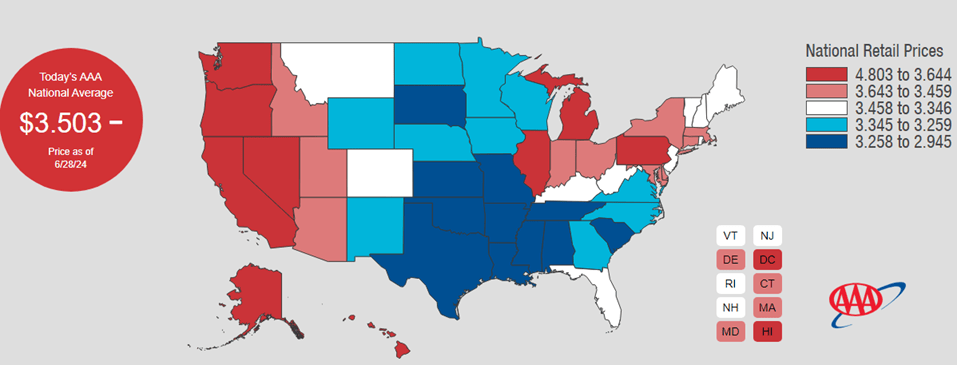
Gasoline prices continued to drop in June as gasoline demand remained subdued. Regular unleaded gasoline is now averaging $3.50 per gallon, down from $3.56 last month. Mississippi has the cheapest gas currently, checking in at $2.95 a gallon. California has the most expensive gasoline at $4.80 per gallon. FYI, a year ago, we were paying $3.56.
Check out the prices at the pump in your area: AAA Gas Prices.
Outlook
Events on the horizon that could move the markets in the near term:
Fed & Inflation: The Federal Reserve Open Market Committee (FOMC) is poised to cut interest rates. With the latest consumer pricing data coming in this past Friday confirming that inflation is cooling, it looks like we should see at least one rate cut this year. It feels like a 25 bps rate cut is already priced into the stock market but if it leads to a few more cuts, we could get a nice boost for both stock and bond prices.
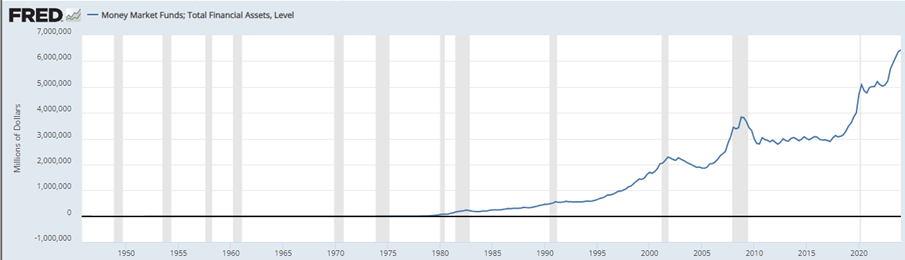
Potential Asset Shift: Interest rates have flatlined at their highs for most of this year. If this is the peak and rates begin to come down, we could see money flow from savings accounts, money market accounts and CDs to stocks, especially high-quality dividend paying stocks. This is the potential source for the fuel to send the stock market higher after its impressive run in the past 18 months. Take a look at how much money is sitting in savings vehicles currently:
The St. Louis Fed reports almost $6.5 trillion in these accounts as of 2024 Q1. If this money starts shifting to the stock market, it could be the catalyst for a nice leg up.
I thought it would be interesting to take a look at the late 1990’s Dot Com era and see how it compares to the current AI era. There are some similarities that I see, particularly with investors’ mindsets, that make me think history will repeat itself. But there are also some key differences that could keep the AI era from suffering the same fate as the Dot com era. Here’s what I am seeing:
What’s the same
Transformational Change – In the 90’s, the internet was changing how businesses interacted with customers. We went from going to brick and mortar stores to sitting at a computer to transact business. Today, AI is involved not only on the transactional side of business, but also the marketing, manufacturing, research, and almost every aspect of business today.
Fear Of Missing Out (FOMO) – You couldn’t go to a party, restaurant or pretty much any social gathering without hearing someone talk about how well their Dot Com investments were doing. This caused a great deal of FOMO among both retail and institutional investors. If there was a “.com” at the end of a company’s name, you wanted to own its stock. Now, investors are lining up to buy any company that is involved in AI infrastructure and willing to pay a premium for them.
What’s different
Earnings – The Dot Com era ushered in an incredible number of companies that went public based on hype and the promise of amazing revenue and profits. Many had no revenue but the push to get their stock publicly traded was so great that they rushed to the markets. The insanity was that investors couldn’t get enough of them. Of course, once reality set in, these companies went bankrupt, and investors lost everything. Now, most companies involved in AI are already well established (Microsoft, Amazon, Google, Nvidia, Meta, etc.) and are very profitable already.
Behind the Scenes – AI is helping make companies more efficient, productive, and profitable by improving operations and procedures behind the scenes. It is involved in almost every aspect of a company’s business whereas in the Dot Com era, the internet was more concentrated in just the sales and marketing sectors.
Far Reaching – Back in the 90’s the internet focused mainly on the interphase between businesses and consumers. Today, AI is not only involved there, it is changing nearly every aspect of every industry. In health care for instance, AI can read x-rays, CAT scans, and biopsy slides with incredible accuracy, detecting and diagnosing diseases faster. In the forest fire arena, AI is now being used to detect fires much quicker than humanly possible. California has 1,000 cameras monitoring their forests using AI. The money, manpower, and property saved by employing AI is immense. Now, extrapolate that across every industry and you can see why AI is a game changer.
That being said, it does seem that the markets might be getting ahead of themselves in this AI era. But it is nowhere near the frenzied euphoria that caused the Dot Com era bubble to burst…..for now.
Please comment or send an email if you have any questions.
Since November of last year, the S&P 500 index has risen steadily, with just a handful of weeks with negative returns. So, you may be asking yourself if stocks have gone up too far, too fast and are ripe for a pullback. If you are good at timing the market, this may seem like a good time to take some chips off the table. I recently talked about timing the market and you can check that out here: Sell In May And Go Away?
But before you do anything, you should ask yourself this question: Are you a trader or an investor?
Traders and investors both deal with buying and selling financial assets, but they have different goals and timeframes. Here’s a breakdown of the key differences:
Timeframe:
Trader: Focuses on short-term gains, buying and selling assets within a short period, like seconds, days, or weeks. This is often called short-term trading or day trading.
Investor: Has a long-term perspective, buying and holding assets for years or even decades. They aim to grow their wealth through the overall appreciation of the assets and potentially through dividends (regular payments from companies to shareholders).
Goal:
Trader: Aims to capitalize on short-term market movements and price fluctuations. They may be more concerned with technical analysis, looking for patterns in charts and trading data.
Investor: Focuses on the underlying value of the asset and the company’s potential for long-term growth. They rely more on fundamental analysis, researching a company’s financials and overall economic conditions.
Effort:
Trader: Trading can be a very active process, requiring constant monitoring of markets and frequent buying and selling decisions.
Investor: Investing can be more passive, requiring less day-to-day attention. Investors may periodically rebalance their portfolio, but generally don’t need to be glued to the markets.
Risk:
Trader: Short-term trading can be riskier, as markets can be volatile and unpredictable.
Investor: Long-term investing is generally considered less risky, as history shows the stock market tends to trend upwards over time. However, there are still risks involved, such as economic downturns.
There are many people, me included, who operate as both a trader and an investor. For me, I have trader accounts and investor accounts. My retirement accounts are considered my investor accounts. I also have a small trader account that I manage as well.
For traders, this probably is a good time to take some profits and get some cash ready to make buys after the eventual dip that’s coming since stocks seem over bought currently. Traders can also buy put options (insurance of sorts) to protect their gains without having to sell their existing positions.
For investors, the current state of the markets shouldn’t influence your long-term strategy. If you are holding well-managed companies with strong financials in growing industries and high barriers to entry (wide moat), you stay the course. If their stock prices drop on the eventual pullback, you buy more.
Now, you can categorize your accounts based on how you manage them, as a trader or as an investor.
Finally, just as a reminder, if you need money for something in the immediate future, it should be in an emergency reserve account, like a money market, savings, or checking account.
Please comment or send an email if you have any questions.
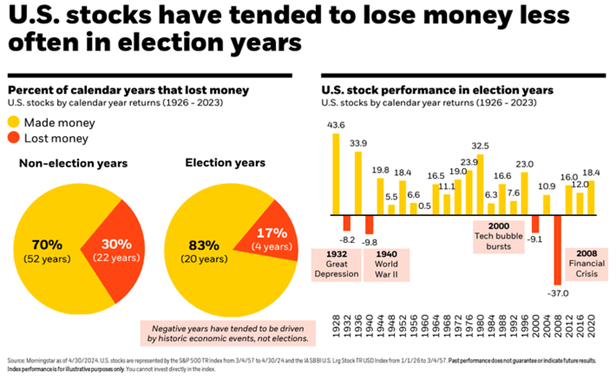
I saw some interesting charts in the past week that illustrate stock performance in a presidential election year.
First, in the chart above, you can see that stocks have performed well in past presidential election years. The four years that stocks had negative returns included some very significant economic and geopolitical events that contributed to their poor performance.
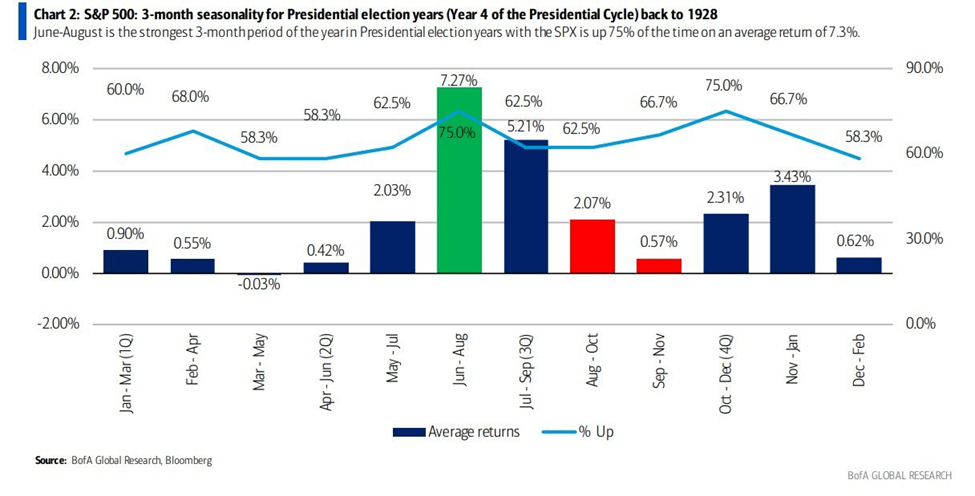
This next chart shows how stocks performed during every rolling three month stretch in an election year going all the way back to 1928. As you can see, the June, July, and August stretch is the best performing with a positive return 75% of the time and an average return of almost 7.3%.
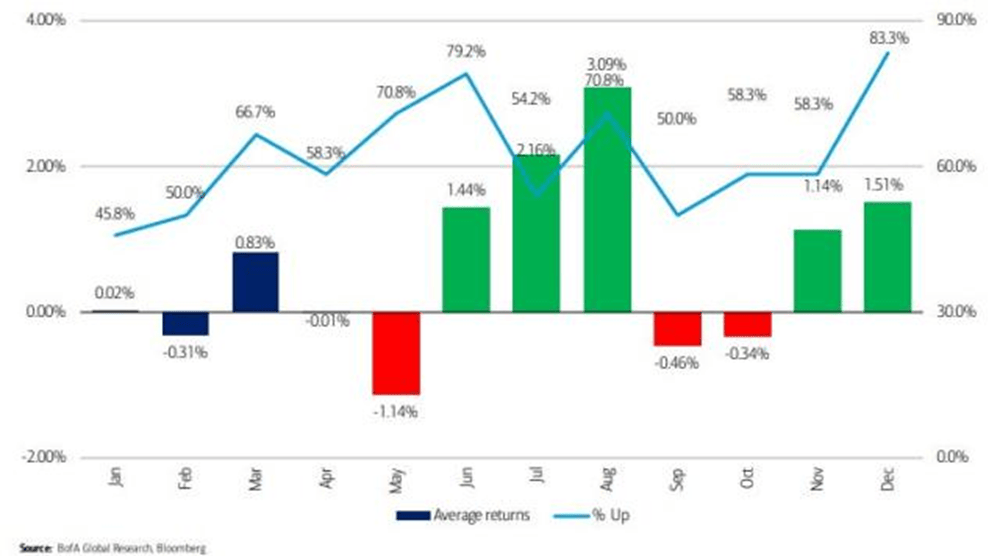
The last chart simply shows the performance of stocks during each month of a presidential election year going back to 1928.
So, it seems that summertime is the best time to be invested in the stock market during a presidential election year. However, we are currently at or near all-time highs in most stock indices and appear to be ripe for a pullback in stock prices. It will be interesting to see if this historical trend can hold up with such a positive return in stocks preceding it over the last eighteen months.
Please comment or send an email if you have any questions.
Wednesday, June 19th, Juneteenth National Independence Day. The stock market is closed.
Stocks headed higher in May after a brief April pause. It seems that we are getting comfortable with interest rates where they are right now, and rates have been the main mover of stock prices over the last year or so. The economy certainly isn’t being bothered by high rates as evidence of a strong economy continues to show up in the data.
For the month, the S&P 500 was higher by about 4.80%. For 2024, it is up nearly 11%.
Most Q1 earnings have been reported which means the only known catalysts out there to move stocks are inflation data and the actions of the Federal Reserve.
In recent history, June has been pretty good for stocks. In fact, over the last ten years, the S&P 500 has averaged about a 1% positive return on investment. We’ll see in a month if the market can at least hit the average.
Take a look at the Outlook section below to see what events could move the markets over the short term.
Bond prices reversed course once again and moved higher in May as inflation data showed stronger signs of cooling down at a faster pace. It would be nice to string together a couple of months of this data to convince the Federal Reserve that it’s time to start cutting interest rates. Hopefully, this is the start. We will get a better read from them when they meet later this month.
The 10-year US Treasury note yield fell in May, finishing the month at 4.51%, lower than the 4.69% that it was at the beginning of the month. The 30-year bond yield closed out the month at 4.65%, lower than the 4.79% that it was a month ago.
Bond investors still need to be cautious even if the data points to rates trending lower in the near future. Therefore, bond buyers should continue to focus on bonds with short-term maturities. I would keep maturities under 18 months and just plan on holding these bonds to maturity. That way, you won’t have to worry about selling at a discount if interest rates head higher.
Savings rates fluctuated very little this past month, keeping rates at their highest levels since 2007. For many homeowners with a mortgage, it is nice when your savings account is paying more interest to you than you are paying to your mortgage lender. CDs and MMAs continue to be a great place to park your cash and your emergency fund. These rates continue to be a legitimate alternative to stocks and bonds, especially for risk-averse investors, and will keep pressure on those markets until we see this trend reverse, which looks like it will be happening much later in the year than expected.
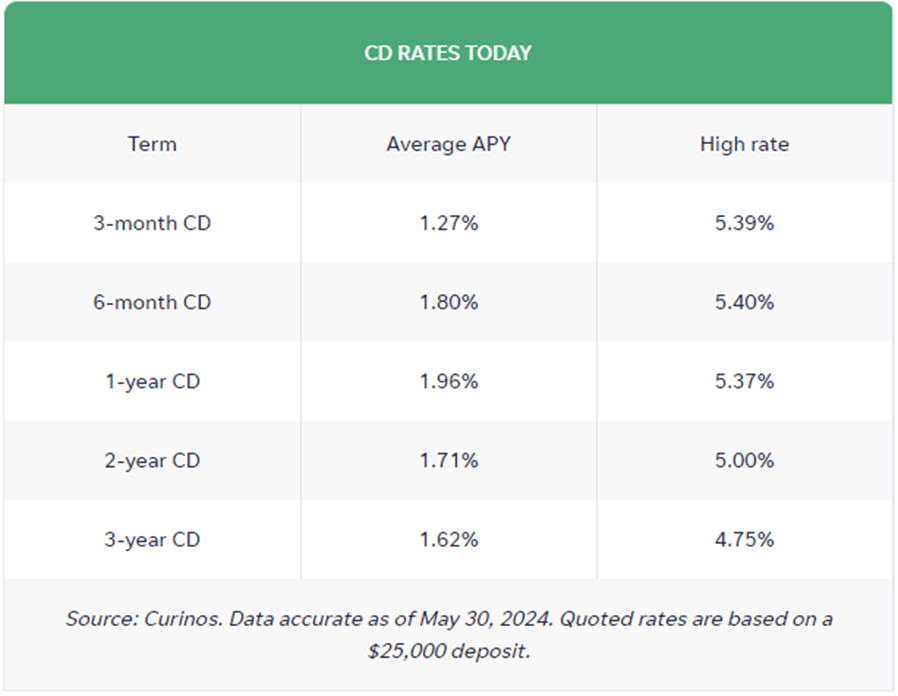
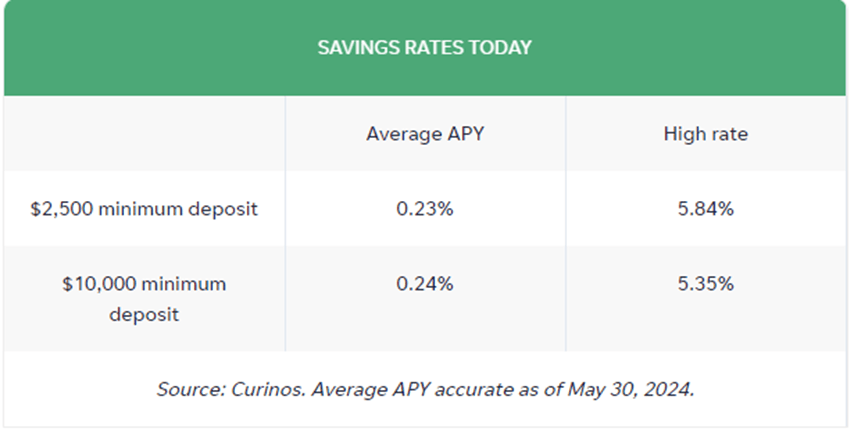
Now, take a lookat the top rates for CDs and money market accounts (MMA):
The best 1-year CD interest rate is currently at 5.37%. The best 5-year CD rate right now is around 5.40%. We finally saw the 5-year CD rate surpass the 1-year rate, albeit just barely. This is a good sign that yield curves are normalizing. Let’s hope it continues this trend.
Eventually, savings rates will normalize but not until inflation comes down enough for the Fed to feel comfortable lowering interest rates. That said, I would still put my savings or emergency spending money into short-term CDs, 1 year or less, and reevaluate when they mature. If you would rather have more liquidity, look intoan MMA (some yielding close to 6% currently). Keep the total under $250,000 per person at any one bank to ensure you are fully covered by the FDIC. CDs and MMAs have become nice alternatives for risk-averse investors and have drawn money away from stocks because of their relatively high rates that carry virtually no risk.
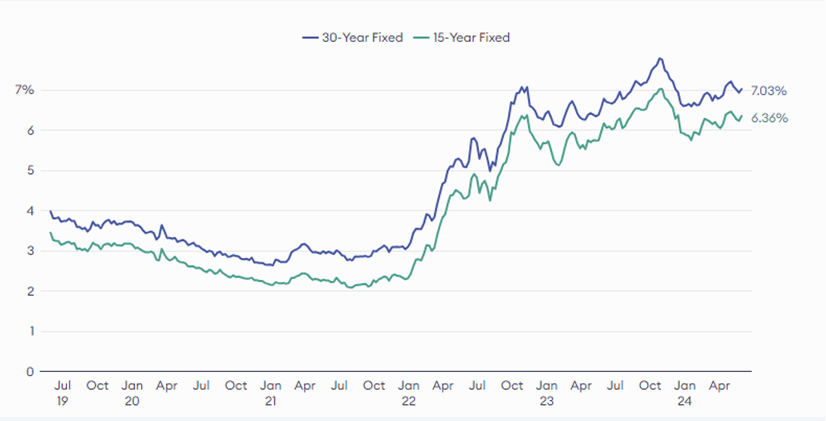
Mortgage rates dipped slightly in May as buyers and sellers vie for any advantage in the midst of the spring buying season. Currently, the 30-year rate sits at 7.03%, lower than a month ago, at 7.31%. The housing market continues to be in an unusual situation (high rates, low home inventory, strong demand) and that is making mortgage rates very volatile. Most homeowners either own their home outright or have a mortgage below 3.5%. There is very little incentive to sell a home with rates where they are right now. That will not change until mortgage rates fall. For now, the industry continues to bank on the Federal Reserve to get it squared away.
Oilprices continued lower for a second month in a row as demand wanes worldwide. It also should be noted that the dollar has weakened a bit over the last month as well, which may have contributed to some of the price drop.
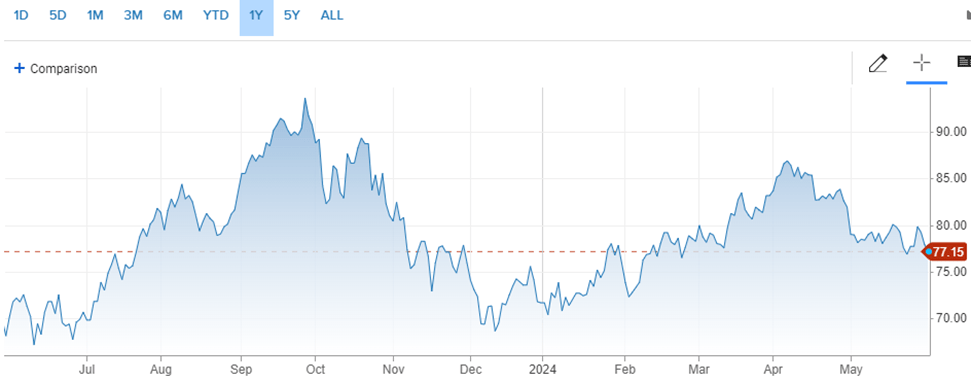
For the month, the price for a barrel of oil settled at $77.21, down from $81.61 at the beginning of May. For the year, it is up about 7.6%. Although oil prices fell again this month, they are still high and are a big cause of the stubborn inflation that we are seeing in consumer prices, especially in the food and travel/leisure industries. It could be tough to get prices lower with economies worldwide continuing to chug along at a strong pace. It is a quandary that might be resolved only through demand destruction, or put another way, the cure for high oil prices is high oil prices.
Here’s a look at the one-year chart for U.S. oil:
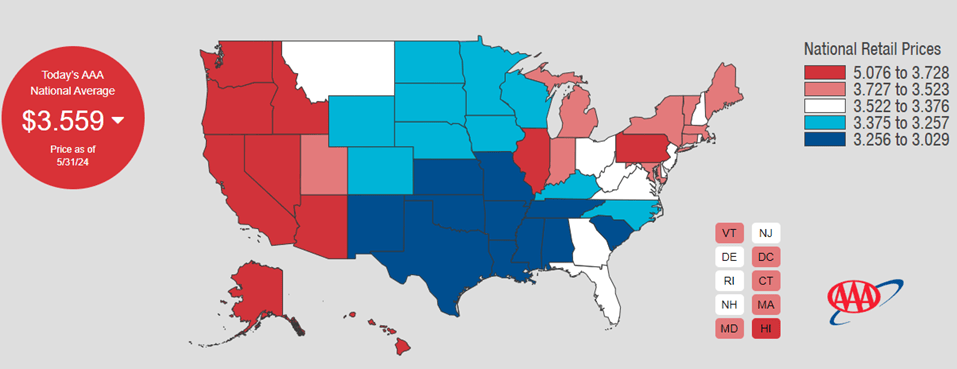
Gasoline prices headed lower in May as gasoline demand softened despite the summer driving season ramping up. Regular unleaded gasoline is now averaging $3.56 per gallon, down from $3.66 last month. Mississippi has the cheapest gas currently, checking in at $3.03 a gallon. California has the most expensive gasoline at $5.08 per gallon. FYI, a year ago, we were paying $3.58.
Check out the prices at the pump in your area: AAA Gas Prices.
Outlook
Events on the horizon that could move the markets in the near term:
Fed & Inflation: Members of the Federal Reserve have been making the speaking rounds since their last meeting at the beginning of May. They meet again on June 12th and although there is little chance of a rate cut being announced at that meeting, the financial world will be listening for any hints of when a cut might happen.
I can’t see them cutting rates, through at least the summer, because the economy is just too strong right now. Consumers are still willing to spend, especially on travel, leisure, and services. Plus, the high rates aren’t having their typical effect on consumers because many households have no mortgage or one with a very low rate. Now, with elections coming up in November, the Fed will probably push out any rate cuts until after that, so as not to influence any election outcomes. So, the next few meetings can be market movers but only from what they say, since they won’t be taking any action.
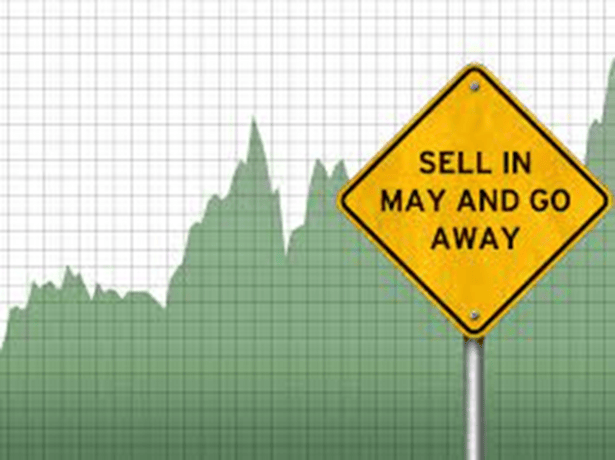
Sell in May and go away is an old Wall Street saying that is the basis for a market-timing investment strategy which calls for you to sell your stock holdings right before summer and buy them back in late fall, or right before Memorial Day and right after Halloween.
Historically, the S&P 500 has performed better during the winter months than in the summer months. So, there is evidence that this strategy could work, but we are really Monday-morning quarterbacking here. In reality, you have to be very good at timing the market not once, but twice every year! You have to pick when to sell and then you have to pick when to buy back in. Plus, you have to consider your holdings’ short-term versus long-term gains and losses as well as the associated tax ramifications.
I don’t know of anyone or any firm that has been able to do this successfully for an extended period of time.
So, whenever I hear the “Sell in May and go away” adage, I like to think of another old Wall Street saying: Time in the market, not timing the market. This means relying on a strategy where you don’t try to guess when the market is at its lowest or highest point. Instead, you invest knowing that your timing is probably going to be off, but that eventually, investing in great companies with strong fundamentals matters more than the timing.
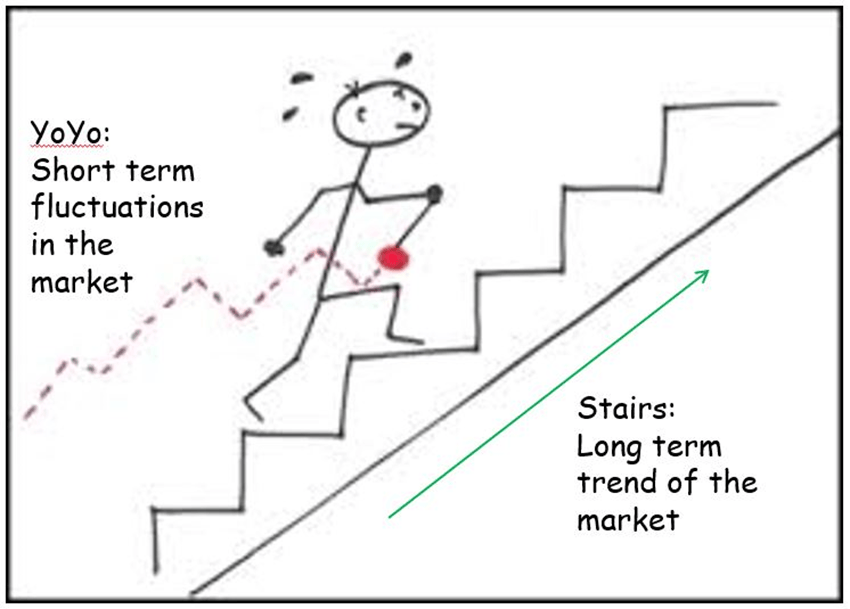
Now is when I roll out my favorite illustration to show why time in the market is better than timing the market for investors.
Picture the movement of the yo-yo as the short-term fluctuations of the stock market and the guy walking up the stairs as the long-term trend of the market. The market has its ups and downs, but over time, has consistently moved higher. This is a simple, but effective, way to illustrate why time in the market is better than timing the market.
Please comment or send an email if you have any questions. Have a great Memorial Day weekend!
In the financial world, everything today is about the Federal Reserve and interest rates. Currently, rates are at a level not seen since about 2007. As you know, rates affect how much it costs to borrow money and also how much interest that you receive when you lend money, like when you deposit it in a savings/money market account or buy a bond. So, it’s not all bad when interest rates are high. In fact, rates are closer to historical norms now than they have been in the last 16 years.
That said, why haven’t these higher rates had their desired effect on reducing inflation? Here are a few reasons:
About half of all mortgages have an interest rate locked in below 4% – When rates plummeted during Covid, anyone that had a high mortgage rate refinanced to a fixed rate mortgage below 4%, many in the 2% to 3% range. So, their biggest monthly expense was reduced significantly and will be for decades to come if they don’t sell. Thus, higher rates will have less of an influence on these consumers.
Homeowners are making money on their mortgage loans – You heard that right. People with a low-rate fixed mortgage are taking the money that they borrowed and are buying CDs and government bonds that pay five percent interest or more. For example, if you have a mortgage at 3.5%, instead of paying down your mortgage, you can take any extra cash and buy a CD at 5% and make 1.5% on your money.
People are still spending even with sustained high prices – Usually, when prices have risen this much (groceries, utilities, insurance, etc.), consumers tighten their belts and pull back on discretionary spending (vacations, big ticket items). This has not happened, at least not yet. With historically low unemployment and decent wage increases, people are still traveling and spending, especially those with no mortgage or a low mortgage rate.
Higher interest rates will eventually work to lower inflation, but it may take longer than anyone expected. Plus, it is a good thing for risk-averse investors and savers.
Please comment or send an email if you have any questions. Thanks!