BAM Blog

Monthly Update – January 2025

Calendar Notes

  • Wednesday, January 1st – New Year’s Day: Stock market is closed.
  • Thursday, January 9th – National Day of Mourning for President Jimmy Carter – Stock market is closed.
  • Monday, January 20th – Martin Luther King, Jr. Day – Stock market is closed.

Stocks seemed a bit tired in December as the year-end rally flamed out. I can’t blame them. They worked hard all year, and it showed, racking up a 20%+ return for the second year in a row. This hasn’t happened since the 1990’s, which sounds so long ago. The biggest catalysts for this performance were the continuing AI expansion on all fronts as well as inflation dropping substantially over the past year.

For the month, the S&P 500 dropped about 2.5%. However, it was still able to finish the year with a gain of over 23.3%.

Looking ahead, we will have Q4 earnings reports coming out in a few weeks. Also, Trump and his new administration will be coming in later this month. Finally, the Federal Reserve meets at the end of the month in a very cloudy interest-rate environment. Those are some pretty big catalysts that can move the markets, making for a very busy start to the year.

Historically, January has been a good month for stock performance. It has also been a pretty accurate indicator of how stocks will perform the rest of the year. For instance, when stocks have a positive January, full year returns have been positive 77% of the time. Let’s hope history repeats itself this month.

Take a look at the Outlook section below to see what events could move the markets over the short term.

Bond prices flip flopped once again, reflecting the uncertainty in the current interest rate environment. Both corporate and government bond prices fell during the month of December as new inflation data coming in showed that inflation is stickier than anyone expected. Still, the Federal Reserve did cut rates another 25 bps at their December meeting but where they go from here is anyone’s guess, including the Fed.

The 10-year US Treasury note yield finished higher in December, settling at about 4.57%, above the 4.18% that it was at the beginning of the month. The 30-year bond yield closed out the month at 4.79%, higher than the 4.37% that it was a month ago.

Bond investors are waiting with bated breath for the new administration to get in office and lay out their plans for trade and immigration policies, which will heavily influence the direction of bond prices and their yields. We should get some clarity on those issues by the end of the month.

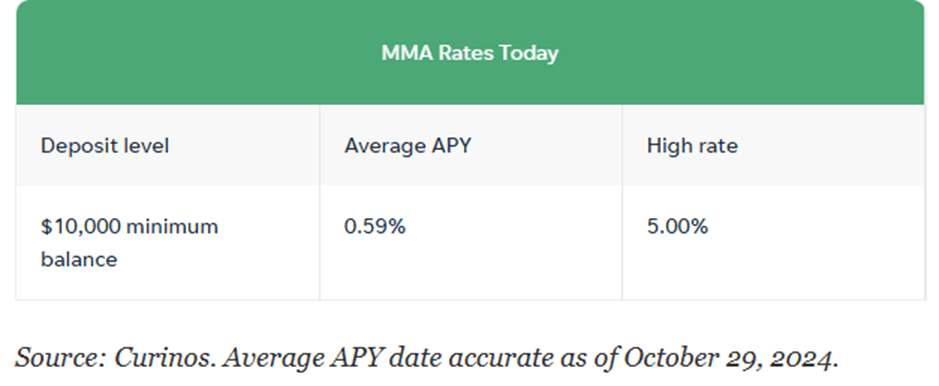
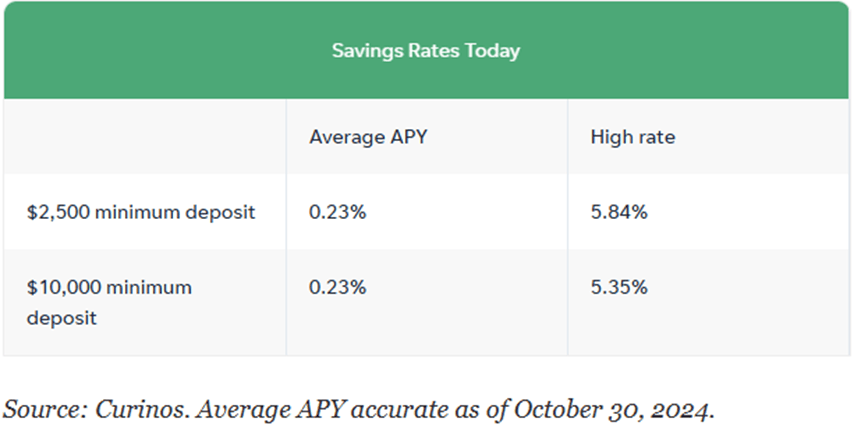
Savings rates either stopped dropping or even went up a little bit this past month. The change in direction is most likely due to the Fed’s talk of slowing down their pace of lowering short-term interest rates in 2025. The direction of where these rates are heading will continue to be uncertain until the inflation picture clears up, which will also depend on the incoming administration’s trade and immigration policies. That said, these rates are pretty good for savers and risk-averse investors. You can get above 4% return on your money currently. So, CDs and MMAs continue to be a great place to put your cash and your emergency fund, for now.

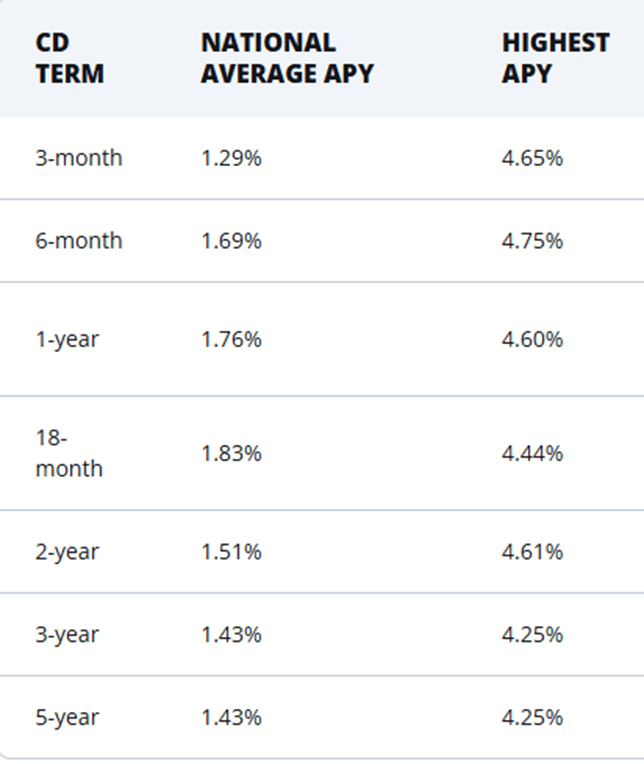
Now, take a look at the top rates for CDs and money market accounts (MMA):
MMA Rates

National AverageHigh Rate
0.66%5.00%

The best 1-year CD interest rate is currently at 4.60%, higher than last month. The best 5-year CD rate right now is around 4.25%, a 25-basis point rise from last month. Once again, MMA and traditional bank savings account rates changed very little from last month.

Savings rates are now in a holding pattern until we get a clearer picture on where interest rates are heading. This isn’t a bad thing, especially for risk-averse investors and savers. Knowing this, it makes sense in most situations to put cash that you don’t immediately need into CDs with up to 2-year maturities. For emergency cash, stick to high yielding money market and savings accounts, which are still yielding around 5%. As always, keep the total under $250,000 per person at any one bank to ensure you are fully covered by the FDIC.

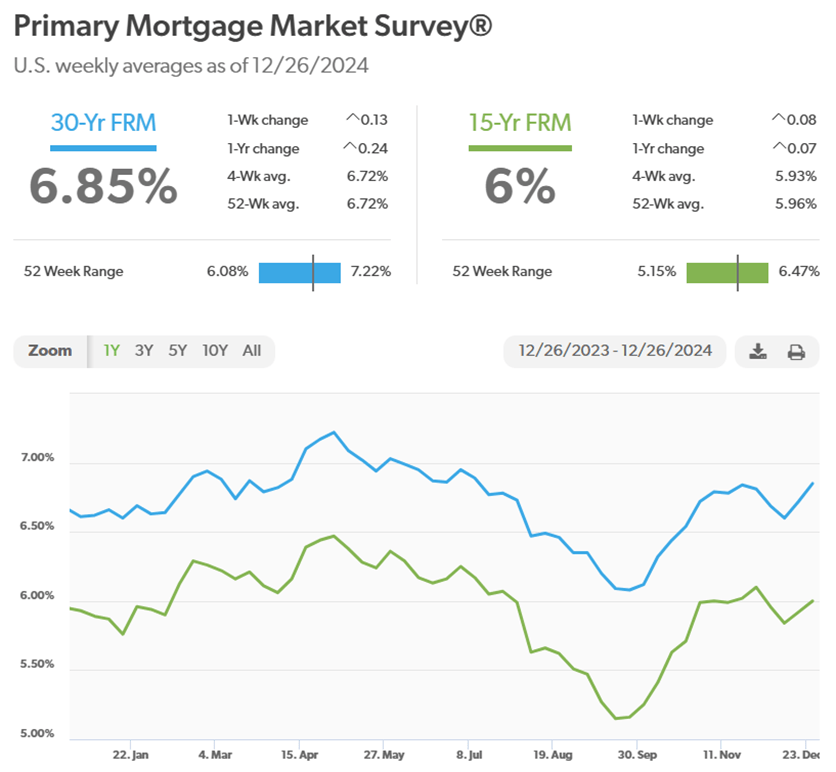
Mortgage rates stayed about the same as a month ago, with the 30-year loan getting ever so close to the 7% mark. Currently, the 30-year rate sits at 6.85%, slightly higher than a month ago, at 6.81%. There is still low inventory, especially for existing homes, so any drop in rates continues to be met with a quick surge in demand.
Oil prices headed higher as hopes of new drilling to lower oil prices were dashed by oil producers’ comments. It seems that these companies like high oil prices (shocking!) and don’t necessarily want to pump more oil. This is a global market that is motivated by profits, so it is difficult to tell them how much oil to produce unless they become operated by the government.

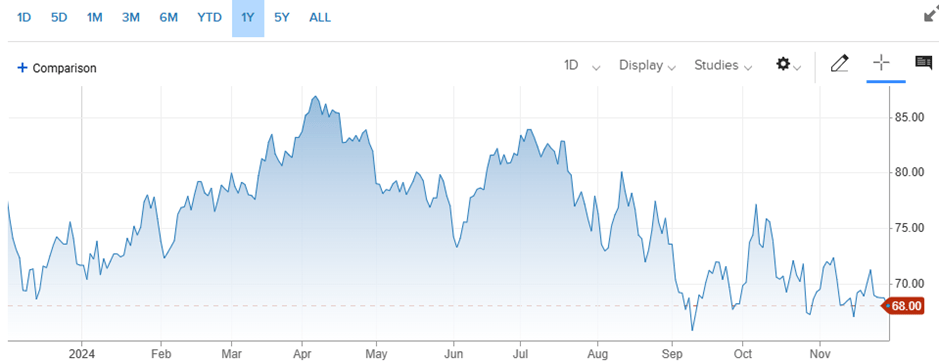
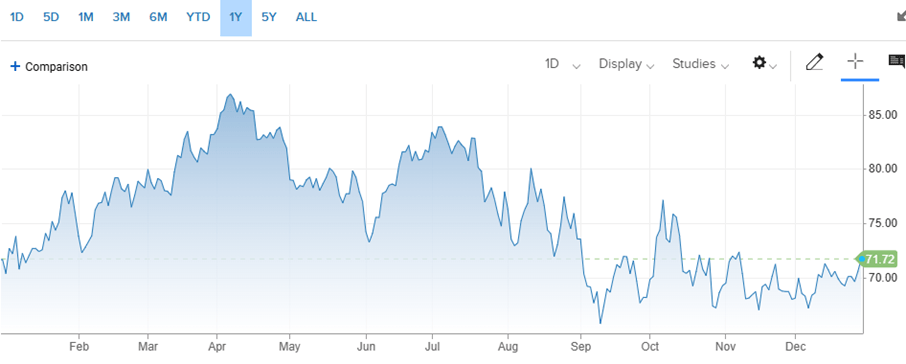
For the month, the price for a barrel of oil closed at $71.72, down from $68.15 at the beginning of December. For the year, prices ended right where they started in January. Getting oil prices below $70 for an extended period of time would help greatly in lowering the overall inflation rate.

Here’s a look at the one-year chart for U.S. oil:
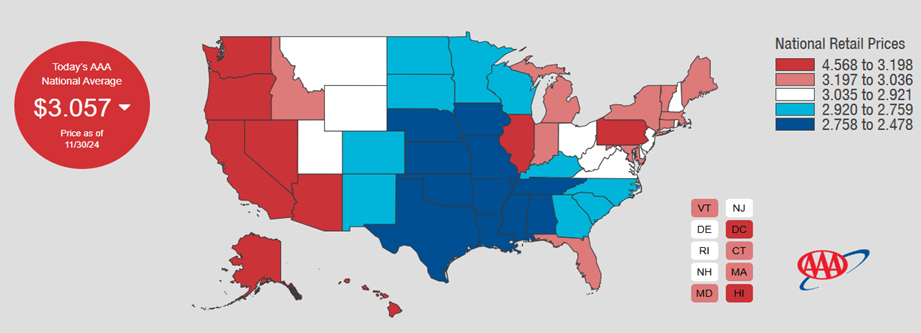
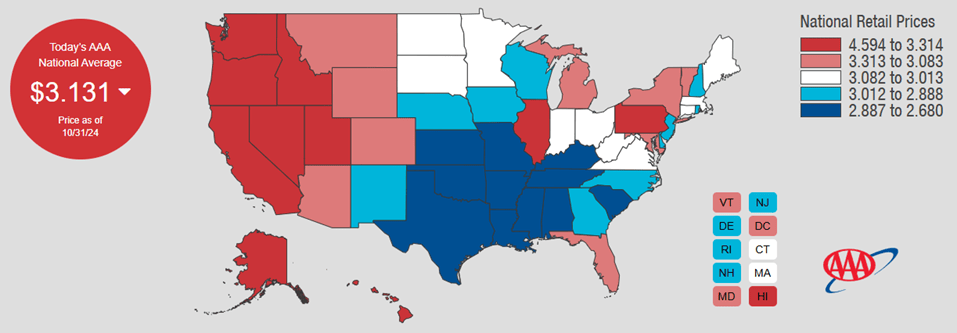
Gasoline prices lagged the rise in oil prices and fell once again in December, albeit barely. Regular unleaded gasoline is now averaging $3.04 per gallon, down from $3.06 last month. Oklahoma has the cheapest gas currently, checking in at $2.58 a gallon. Hawaii has the most expensive gasoline at $4.55 per gallon. FYI, a year ago, we were paying $3.11.
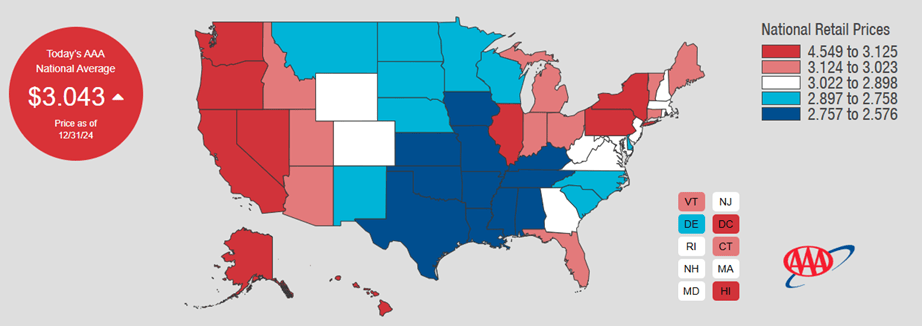
Check out the prices at the pump in your area: AAA Gas Prices.

Outlook

Events on the horizon that could move the markets in the near term:

  • Fed & Inflation: The Federal Reserve cut interest rates by another 25 basis points at their last meeting of 2024 a few weeks ago. They did state that they might not be as aggressive in cutting rates in 2025 as they thought just a few months ago. I believe they want to let the new administration get settled in to see what policies they plan to implement, particularly tariffs and mass deportation, since these could have a significant impact on inflation. We could know as soon as the end of this month so volatility in the stock and bond markets may be higher than normal this January.

Joe Baker, CFP®

Baker Asset Management, LLC

joebaker@bakerassetmanagement.com

What Is A Wash Sale When Selling Stocks?

This is the time of year that many investors sell some loser investments to offset their income or other capital gains, sometimes referred to as tax-loss harvesting. There is an obscure tax rule, known as the wash sale rule, that could affect how the IRS views these trades. So, here is a brief summary of how the wash sale rule works.

The wash sale rule was designed to discourage people from selling securities at a loss simply to claim a tax benefit.

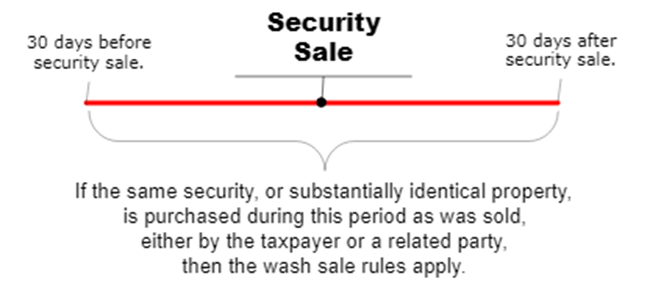
A wash sale occurs when an investment is sold at a loss and, within a period of 30 days before or 30 days after the sale, the identical or “substantially identical” investment is purchased again.

Under such circumstances, that loss will be “disallowed” and may not be considered in calculating a taxpayer’s losses for income tax purposes.

An example is the easiest way to explain this rule:

Suppose Joe has a taxable brokerage account that holds 50 shares of XYZ stock with a cost basis of $500 because he bought the stock when it cost $10 per share. The stock is worth only $5 per share on July 31, and he sells all 50 shares for a total sales proceeds of $250. Joe now has a realized capital loss of $250.

If Joe purchases new shares in XYZ within 30 calendar days before the sale or up to 30 calendar days after the sale, his capital loss can’t be used to offset income or capital gains for that tax year but is deferred until he sells the new, replacement shares.

As you can see in the example, you temporarily lose the tax benefit of the realized loss, but you get it back when you eventually sell the newly purchased shares because you add the original capital loss to the new purchase price to establish your actual cost basis for the newly purchased shares. The only time that you lose the loss permanently is when you sell an investment in a taxable account, and you buy it back in an IRA.

If it sounds confusing, don’t worry. It is. That’s our tax code.

Please comment or send an email if you have any questions. Thanks!

Joe Baker, CFP®

Baker Asset Management, LLC

joebaker@bakerassetmanagement.com
Tax Loss Harvesting (TLH) – What It Is and When To Do It

Tax loss harvesting (TLH) is a term used in the financial industry to describe strategies employed by investors to minimize their taxes due on any realized gains of investment sales for the year. Realized gains occur when you sell an investment at a higher price than when you bought it.

Before reading any further, please note that TLH only applies to investments in taxable accounts, not retirement accounts or any other tax-deferred accounts. That said, let’s take a look at what this harvesting is all about.

I think an example is the best way to understand how this strategy works:

Suppose you sold shares of XYZ earlier this year for a $10,000 profit, also known as a realized gain. Let’s say that you also have a stinker, ABC, in your account that is down $15,000 from when you bought it. You can sell ABC and now have a realized loss of $15,000. This will offset the $10,000 realized gain. It will also offset up to $5,000 of any other realized gains that you have this year. If you don’t have any other gains, you can apply $3,000 to reduce your taxable income and the remaining $2,000 of losses can be carried forward to next year.

In this example, you were able to avoid paying taxes on that gain of $10,000 by using the TLH strategy.

Most investors prefer to do this strategy towards the end of the year, but you can do it any time during the calendar year. I like to do it for my clients during the slow summer months because that is one less thing to worry about during crunch time in December.

I also want to share with you some do’s and don’ts when you are considering TLH:

  1. Don’t sell losers just to offset gains. Make sure that the investment no longer fits with your investment objectives.
  2. Considering #1 above, do maximize your tax savings by using TLH when you have short term capital gains, since they are taxed at your ordinary income tax rate, which may be much higher than the long-term capital gain tax rate.
  3. Do sell losers if they no longer fit your strategy, even if you don’t have any gains to offset. You can always carry the losses forward to use in later years.
  4. Don’t buy the same investment within 30 days before or after the TLH sale. If you do, this will disallow the loss.
  5. Don’t ever consider any tax strategy, such as TLH, as the sole reason to buy or sell any investment. They should be incorporated into your investment decisions as part of your overall game plan.

Please comment or send an email if you have any questions.

Joe Baker, CFP®
Baker Asset Management, LLC
joebaker@bakerassetmanagement.com

10 Things You Need to Know About the U.S. Housing Market

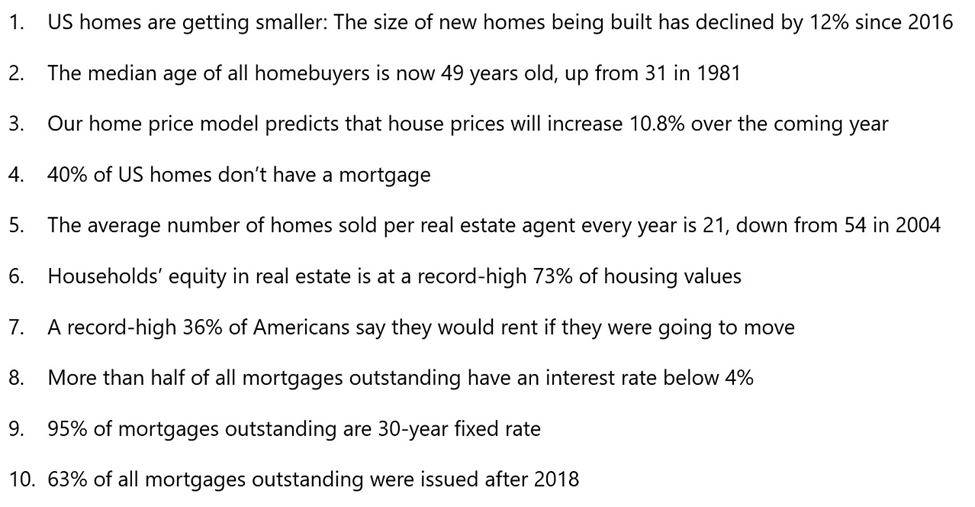
Here are some very interesting facts about the current housing market in the U.S. gathered by Apollo Academy and its Chief Economist, Torsten Slok. Some are expected but others are quite surprising. Take a look:

Some of these can be explained by the record low mortgage rates locked in by owners back in 2020/21. Others are supported by the combination of low housing inventory, higher salaries, and growing net worths due to a booming stock market over the last two years.

Please comment or send an email if you have any questions.

Joe Baker, CFP®

Baker Asset Management, LLC

joebaker@bakerassetmanagement.com

Monthly Update – December 2024

Calendar Notes

  • Saturday, December 7th – National Pearl Harbor Remembrance Day
  • Tuesday, December 24th – Christmas Eve: Stock market closes early at 1 p.m.
  • Wednesday, December 25th – Christmas Day: Stock market is closed.
  • Tuesday, December 31st – New Year’s Eve

Stocks closed out their strongest month of the year in November with major help from the Trump victory and the continued strength in the economy. Stocks experienced a big reversal following a negative October and finished November with the best monthly return of 2024.

For the month, the S&P 500 racked up a positive return of 5.7%. For 2024, it is up over 27%.

Now that the election is over, all attention is on how the new administration’s policies are going to affect the markets. Tariffs and deportations could heavily influence the path of stock prices over the next year or even longer. They also could change the trajectory of inflation, and subsequently, the Federal Reserve’s game plan regarding interest rates. These next few months will be very interesting for not only the investment world, but almost all sectors of the economy.

Historically, December is the third best month for stocks, returning about 1.3% on average. I expect history to repeat itself this coming month as the economy continues to grow and the country prepares for the changing of the guard in DC.

Take a look at the Outlook section below to see what events could move the markets over the short term.

Bond prices did another one eighty and this time headed higher in November mainly due to the Federal Reserve cutting rates another 25 bps at their November meeting. Bonds across the spectrum dropped in yield as investors felt more confident that the Fed would continue on their path of reducing short-term interest rates.

The 10-year US Treasury note yield finished lower in November, settling at about 4.18%, below the 4.28% that it was at the beginning of the month. The 30-year bond yield closed out the month at 4.37%, lower than the 4.47% that it was a month ago.

Bond investors are looking to Washington, D.C., for any hints about trade and immigration policy changes that may come from the new administration set to take office in late January. Higher tariffs and mass deportations, if implemented, could cause a spike in inflation and interest rates, which will cause bond prices to drop.

Savings rates continue to come down at a very slow pace. The direction of where these rates are heading has become a bit murky as of late due to inflation slowing down its descent. I think we have to wait for the Trump administration to get settled in order to get a clearer picture. Still, these rates are pretty good for savers and risk-averse investors. You can get close to 5% return on your money currently. So, CDs and MMAs continue to be a great place to put your cash and your emergency fund, for now.

Now, take a look at the top rates for CDs and money market accounts (MMA):

CD Rates

TermNational AverageHigh Rate
1-year1.84%4.35%
3-year1.35%3.90%
5-year1.35%4.00%

MMA Rates

National AverageHigh Rate
0.57%5.01%

The best 1-year CD interest rate is currently at 4.35%, lower than last month. The best 5-year CD rate right now is around 4.00%, a 30-basis point drop from last month. MMA and traditional bank savings account rates changed very little from last month.

Savings rates are going to be coming down over the next year or so as long as inflation remains tame. If this holds true, it would be okay to put cash that you don’t need immediately into CDs with up to 2-year maturities. For emergency cash, stick to high yielding money market and savings accounts, which are still yielding around 5%. As always, keep the total under $250,000 per person at any one bank to ensure you are fully covered by the FDIC.

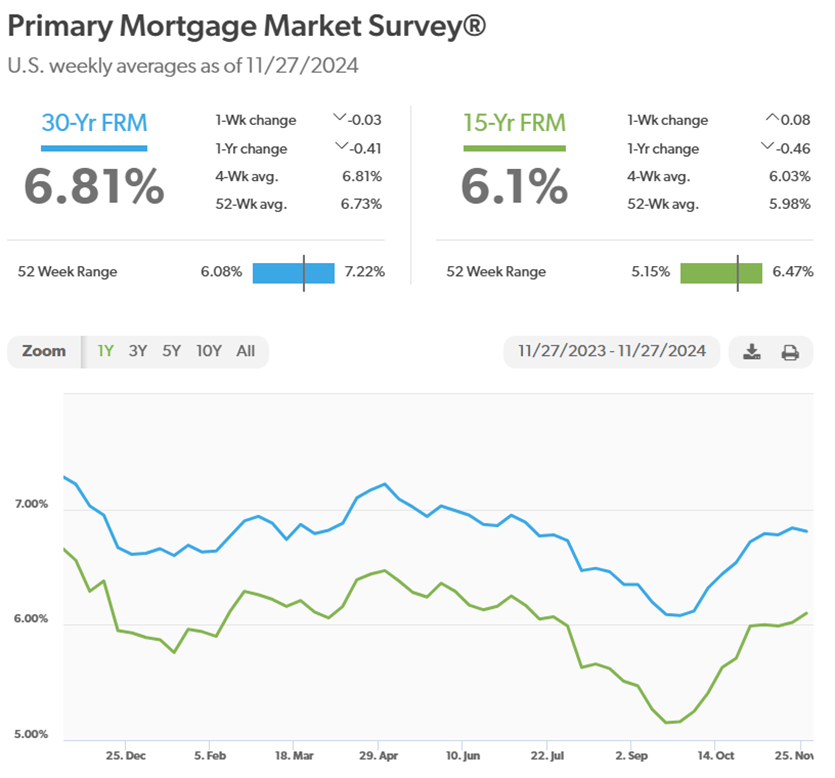
Mortgage rates continued higher once again in November, with the 30-year loan approaching the dreaded 7% level. Currently, the 30-year rate sits at 6.81%, higher than a month ago, at 6.72%. There is still low inventory, especially for existing homes, so any drop in rates has been met with a quick jump in demand. On a side note, I saw an interesting stat about the current crop of homebuyers in the U.S.: the average age of buyers is 56 in 2024, up from 49 in 2023. It is definitely taking longer for people to have the savings and income needed to be able to purchase a home nowadays.

Oil prices fell modestly in November, helped by the “drill, baby, drill” mantra of Trump after winning the election and by the ceasefire in the Middle East.

For the month, the price for a barrel of oil settled at $68.15, down from $70.60 at the beginning of November. For the year, prices are still negative, currently down almost 5%. I would love to see oil prices stay below $70 for a sustained period. As a raw material for almost everything, lower oil prices mean lower manufacturing costs and hopefully companies will pass those savings onto us, the consumers.

Here’s a look at the one-year chart for U.S. oil:

Gasoline prices followed oil prices and fell once again in November. Regular unleaded gasoline is now averaging $3.06 per gallon, down from $3.13 last month. Oklahoma has the cheapest gas currently, checking in at $2.48 a gallon. Hawaii has the most expensive gasoline at $4.57 per gallon. FYI, a year ago, we were paying $3.48.

Check out the prices at the pump in your area: AAA Gas Prices.

Outlook

Events on the horizon that could move the markets in the near term:

  • Fed & Inflation: Inflation continues to drop but looks more like it is bottoming out. Even so, the Fed is expected to cut rates by 25 bps at their last meeting of the year in a few weeks. Currently, the inflation rate is almost at the Federal Reserve’s target of 2.0%. However, there are some potential catalysts in the near future that might cause prices to reverse course and head higher. The two main ones to watch out for are tariffs and deportations. Investors will be giving the new administration their undivided attention regarding these issues over the next few months.
  • Potential Asset Shift: Investors and savers may keep their money in CDs and MMAs if tariffs are implemented across the board and if mass deportations significantly cut into our workforce. These actions will accelerate inflation, forcing the Fed to keep interest rates elevated. These are two major issues that everyone will be watching as the new administration gets settled in early next year.
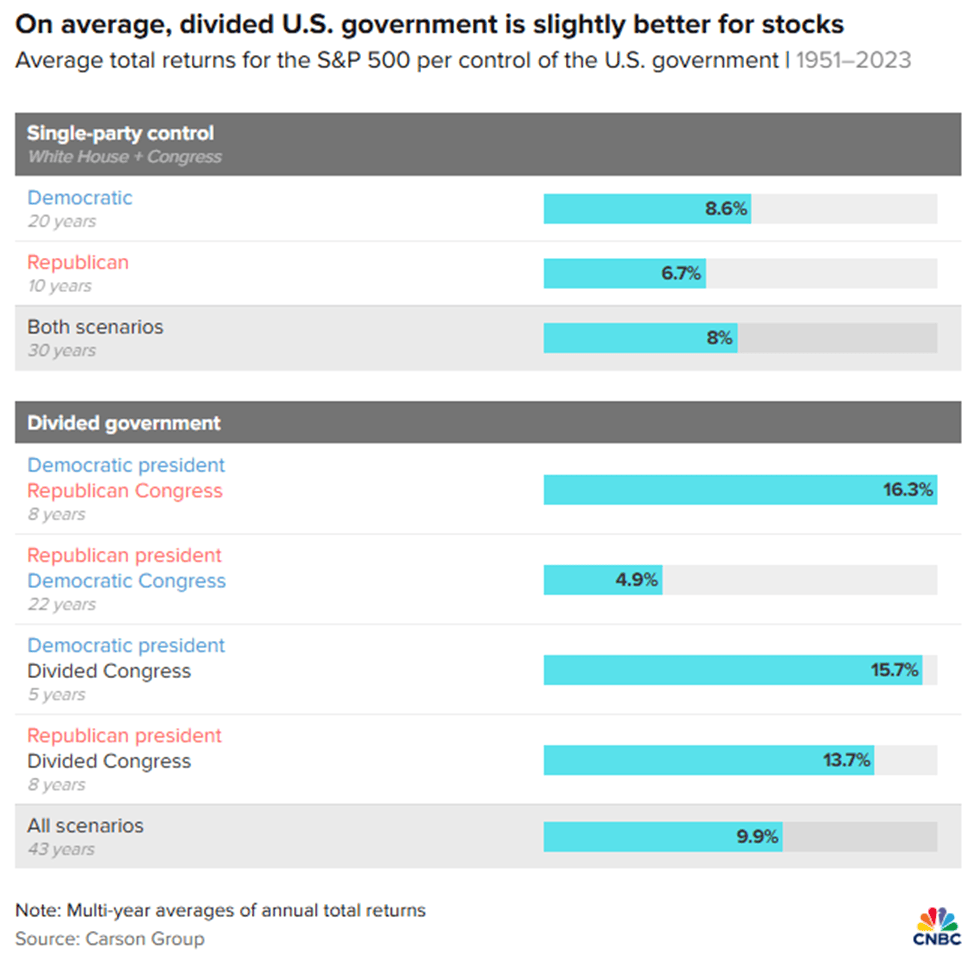
  • Change in DC: In a few months, the Republicans will take over DC, with Trump moving back into the White House and his party taking control of both chambers of Congress. Historically, when one party controls both the presidency and Congress (single-party control), stocks have an annual return of about 8%. They do much better with a divided Congress, as you can see in the illustration below:

According to these stats, stocks look good regardless of who is in control. But it will be interesting to see if history repeats itself when we check the performance of the stock market at the mid-term elections two years from now.


Joe Baker, CFP®

Baker Asset Management, LLC

joebaker@bakerassetmanagement.com
The Pros and Cons of Living Trusts

This is always a great time of the year to review your financial picture.

One of the items that you might be considering, or have considered before, is whether or not to establish a revocable living trust to hold your assets.

A revocable living trust is a legal document created by you (the grantor) while you are alive and of sound mind and body. Just like a will, a living trust spells out exactly what your desires are with regard to your assets, your dependents, and your heirs. But a won’t go into effect until after you die, whereas a living trust is already in effect.

There is little difference to owning your assets in your name or in your living trust’s name while you are alive and well. The benefits occur after you die or if you become incapable of handling your own affairs.

Here is a list of some of the benefits of having a living trust:

  • Avoids probate – This is probably the biggest reason people have a living trust. The trust bypasses the costly and time-consuming process of probate, which is conducted by the state courts of your residence when you die and has the authority to decide how to divvy up your assets.
  • Provides privacy – a living trust is not made public, so upon your death, your estate will be distributed in private. A will, on the other hand, is public record and so all transactions will be public as well.
  • Maintains control – If you become incapacitated in a way that you can no longer manage your assets, your handpicked successor trustee can manage your affairs without court intervention, and since the trust is revocable, if you dispute your incapacity, you can retain control yourself.

There are disadvantages as well:

  • Cost – A living trust can cost anywhere between $500 – $4,000, depending on the complexity. This is the price that you pay for the money saved by avoiding probate, which can typically run around 4% of your total estate value.
  • Bookkeeping – In order for your living trust to be of use, you have to transfer your assets into it. That means opening new accounts with the trust as owner for your bank and investment accounts. Also, transferring deeds and title for property into the trust name, which can be time consuming.

In summary, if you have a large family and/or a large number of assets, you may want to consider establishing a revocable living trust. It could save you and your family not just a lot of money, but also a ton of undue stress and strain on you and your family during difficult times.

If you have questions or want to know if you should establish a living trust, just shoot me an email.

Joe Baker, CFP®

Baker Asset Management, LLC

joebaker@bakerassetmanagement.com

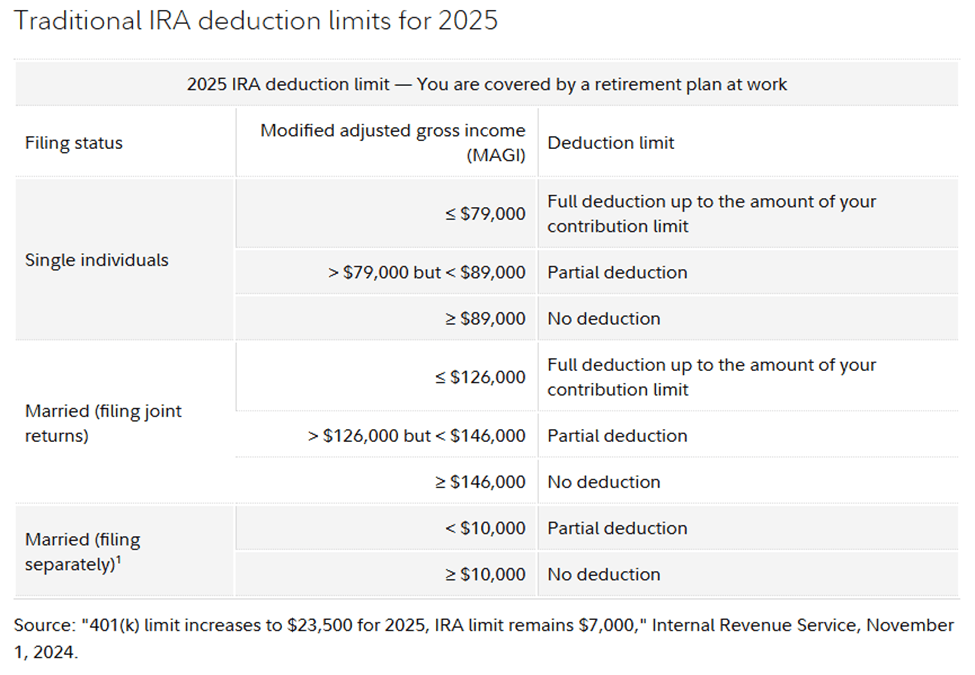
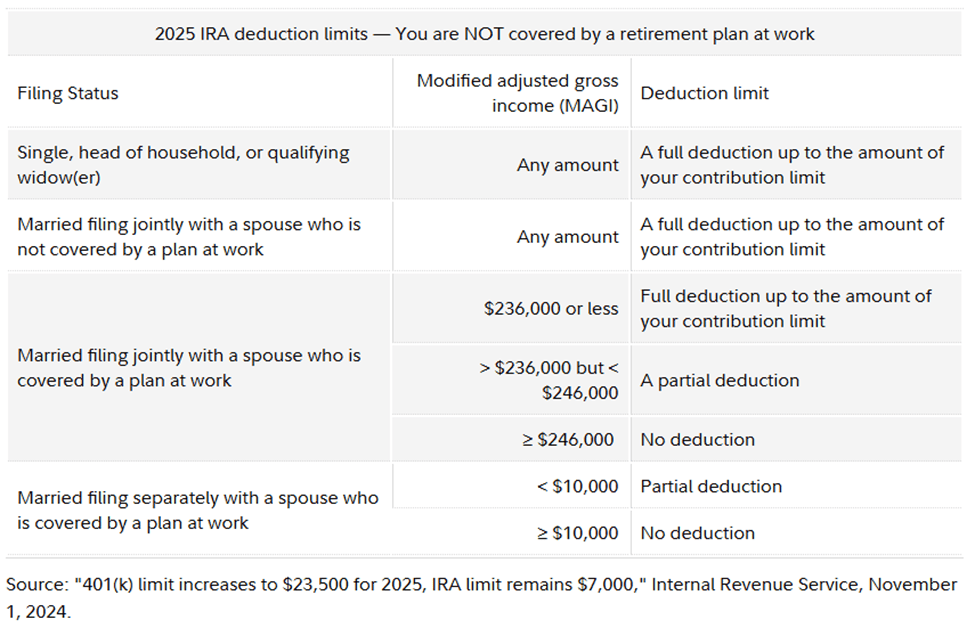
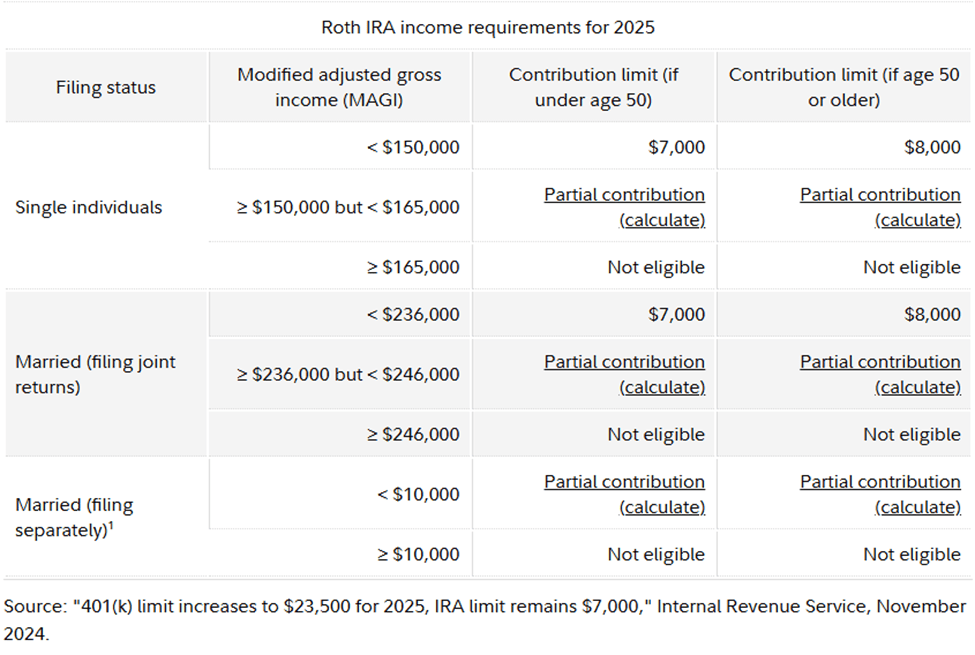
See If You Can Contribute to An IRA in 2025

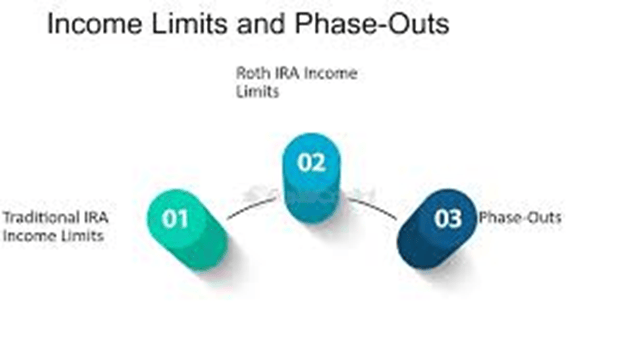
In my last blog post, I reviewed the new contribution limits for retirement plans for 2025. Today, I wanted to go over the new income limits for contributing to an IRA and Roth IRA for next year. Let’s take a look:

If you work with a tax person, they should recommend contributing to either an IRA or Roth IRA if your modified adjusted gross income falls within the limits shown above. If you do your own taxes and want to double check if you can contribute, just shoot me an email.

Please comment or send an email if you have any questions.

Joe Baker, CFP®

Baker Asset Management, LLC

joebaker@bakerassemanagement.com

Check Out The New Retirement Plan Contribution Limits for 2025

The IRS recently posted the retirement plan contribution limits for 2025. Here is a table of the new limits as well as the limits from 32024 so you can see how much they have changed:

20252024
 401k, 403b, 457 plans
Employee Contributions:$23,500$23,000
Annual Contribution Limit (employer plus employee contributions)$70,000$69,000
Catch-Up Contributions$7,500$7,500
Age 60-63 Catch-Up Contributions$11,250—
SIMPLE IRA/401k plans
Employee Contribution Limit$16,500$16,000
Catch-Up Contributions$3,500$3,500
Age 60-63 Catch-Up Contributions$5,250—
IRA Contributions$7,000$7,000
Catch-Up IRA Contributions$1,000$1,000

The changes are typical and not surprising except for a new catch-up amount that is allowed for those of us who reach the age of 60, 61, 62, or 63. It is called enhanced catch-up or super catch-up. Whatever you call it, it means you can put more money into your retirement plan in 2025.

For example, if you turn 60 in 2025 and participate in a 401k plan, you can contribute $23,500 plus $11,250 for a total of $34,750.

Please comment or send an email if you have any questions.

Joe Baker, CFP®

Baker Asset Management, LLC

joebaker@bakerassemanagement.com

Monthly Update – November 2024

Calendar Notes

  • Tuesday, November 5th – Election Day
  • Monday, November 11th – Veterans Day
  • Thursday, November 28th – Thanksgiving, Stock market is closed.
  • Friday, November 29th – Black Friday, Stock market closes early at 1 p.m.

Stocks followed history and fell for the first time in the last six months. Since 1950, election-year Octobers have been bad for stocks and this one was no exception. The craziness of the election, the surprisingly robust economy, and the uncertainty of what the Federal Reserve is going to do with interest rates has combined with lackluster Q3 earnings reports to knock stocks down this past October.

For the month, the S&P 500 was lower for the first time in six months, dropping about 1%. For 2024, it is still up nearly 20%.

Interest rates and the election are still the main drivers for stocks in the short term. Another catalyst for stock prices has been AI spending. Companies are spending a ton on implementing artificial intelligence systems but are not seeing the payback yet. This is hurting earnings now but should be a big boost to companies’ bottom lines in the future.

Historically, we are entering the best six months for the stock market: November through April. Looking at November, it has returned a positive 1.4%, on average, since 1945. Stocks have already had a banner year so any gains in these last two months will be outstanding. I am looking forward to seeing how November turns out.

Take a look at the Outlook section below to see what events could move the markets over the short term.

Bond prices reversed course and headed lower in October, for the first time in six months. Government, blue chip corporate, and high yield bonds all moved lower as uncertainty on how much the Fed is going to cut rates in the short term crept back into the markets.

The 10-year US Treasury note yield finished higher in October, settling at about 4.28%, higher than the 3.79% that it was at the beginning of the month. The 30-year bond yield closed out the month at 4.47%, higher than the 4.12% that it was a month ago.

Bond investors may have to watch the election outcomes a bit more closely now. A republican Congress and president may cause rates to increase to combat the expected inflation if heavy tariffs are implemented, which is what is being suggested right now. A democratic win could cause problems for corporations if taxes are raised, and regulations increased. Regardless of the party that wins, keeping maturities under 18 months should not pose a problem, as long as you can hold to maturity.

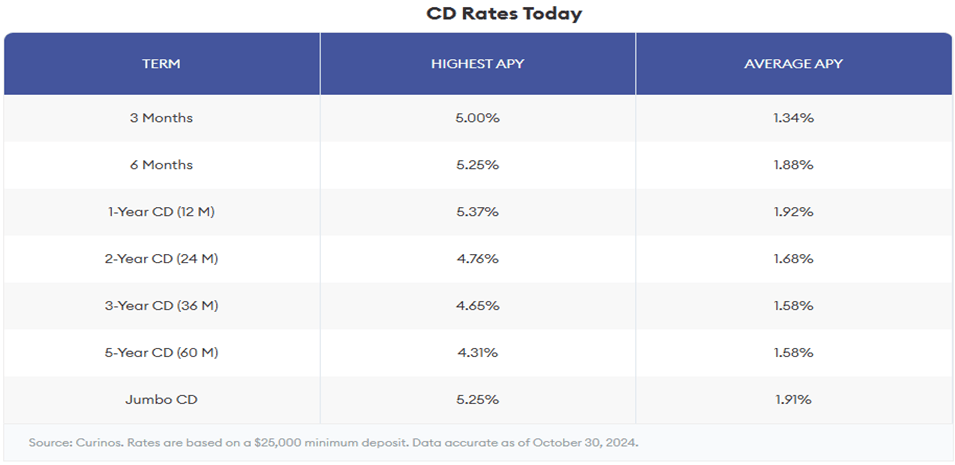
Savings rates are dropping ever so slightly but most rates changed very little over this past month. It seems like they hit the pause button for now until the Federal Reserve can give us a clearer picture on their rate cutting strategy for the next year or so. Until then, accounts are still churning out some decent interest, risk free, and because of that, there is still a ton of money parked in cash (CDs, MMA, Savings). You can still get over 5% return on your money. So, CDs and MMAs continue to be a great place to put your cash and your emergency fund, for now.

Now, take a look at the top rates for CDs and money market accounts (MMA):

The best 1-year CD interest rate is currently at 5.37%, slightly lower than last month. The best 5-year CD rate right now is around 4.31%, just a 3-basis point drop from last month. MMA and traditional bank savings account rates stayed the same from last month.

Savings rates are going to be coming down over the next year or so as long as inflation remains tame. If this holds true, it would be okay to put cash that you don’t need immediately in CDs with up to 2-year maturities. For emergency cash, stick to high yielding money market and savings accounts, which are still yielding well over 5%. As always, keep the total under $250,000 per person at any one bank to ensure you are fully covered by the FDIC.

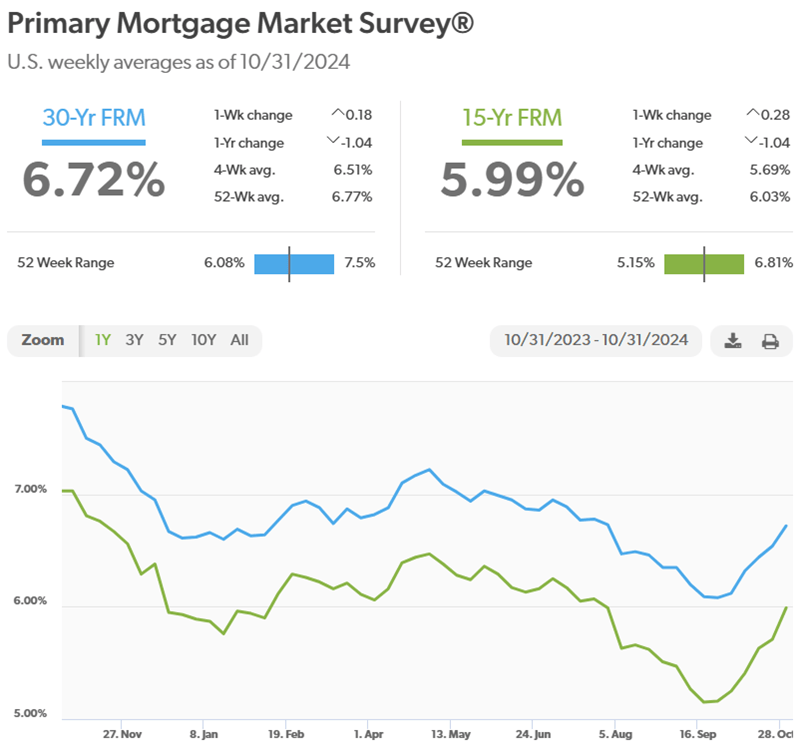
Mortgage rates reversed course and headed higher in October, with the 30-year loan climbing above 6% once again. Currently, the 30-year rate sits at 6.72%, higher than a month ago, at 6.08%. This change in trajectory is mainly due to the data coming in showing an even stronger economy than expected, which is making the case to the Federal Reserve that the country can handle rates staying higher for longer.

Oil prices spiked higher earlier in the month, but they ended October close to where they were at the end of September. Calmer hurricane activity in the Gulf of Mexico and reduced tensions in the Middle East allowed prices to come down from that spike.

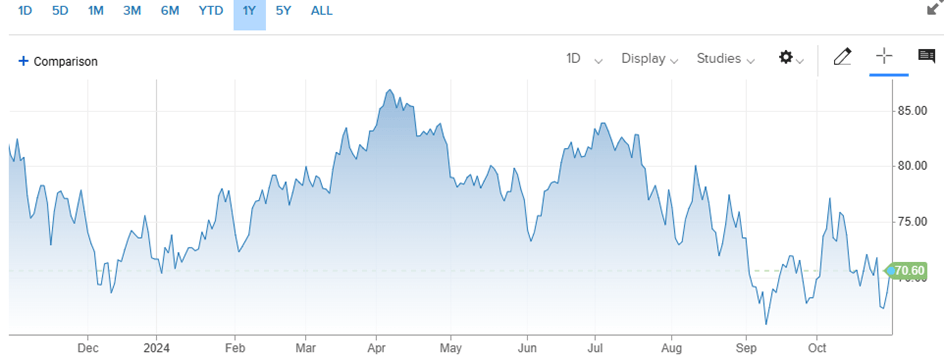
For the month, the price for a barrel of oil settled at $70.60, up from $68.16 at the beginning of October. For the year, the price difference is still slightly negative, down about 1.5%. China’s economy is showing signs of a recovery, which will put upward pressure on prices. Pushing back is the possibility that the Israel/Iran conflict has ended, which would put downward pressure on prices.

Here’s a look at the one-year chart for U.S. oil:

Gasoline prices continued to drop in October. Regular unleaded gasoline is now averaging $3.13 per gallon, down from $3.22 last month. Texas has the cheapest gas currently, checking in at $2.68 a gallon. Hawaii has the most expensive gasoline at $4.59 per gallon. FYI, a year ago, we were paying $3.48.

Check out the prices at the pump in your area: AAA Gas Prices.

Outlook

Events on the horizon that could move the markets in the near term:

  • Fed & Inflation: Well, it looks like the Fed was able to bring down inflation without causing a recession. Jobs and wage growth are still strong with consumer prices under control. But is the economy humming along too good for the Fed to continue to cut interest rates? This is the big question that will be answered next week when they meet again. How they answer it could dictate how the markets perform through the end of the year.
  • Potential Asset Shift: Interest rates have stopped their decline for now as the economy continues to surprise to the upside. That is keeping yields across government bonds, CDs, and money markets attractive enough to not want to make investors shift their money out of these assets, for now. I still believe this great rotation will happen, but it may be more spread out over time if rates continue to stall their move downward.
  • Election: Next week is going to be pretty wild, with the election, the Federal Reserve meeting, and more earnings reports. If this election is like the last two, I don’t expect on election night to know what party will occupy the white house or hold a majority in the senate or house of representatives. So, there will certainly be some market volatility due to the elections for at least the month of November.

Joe Baker, CFP®

Baker Asset Management, LLC

joebaker@bakerassetmanagement.com
How Long Will This Bull Market Last?

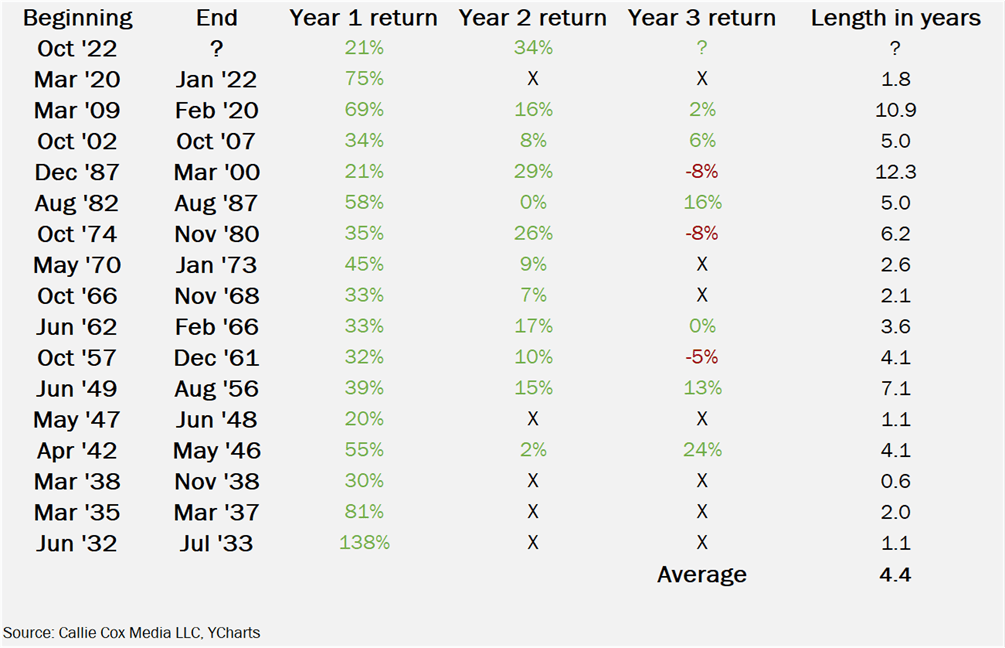
We recently hit the two-year anniversary of the current bull market in stocks. As a refresher, a bull market happens when stock prices have gone up 20% or more from the previous low for a sustained period of time. The current bull market started on October 12, 2022, and is being sustained by an expanding economy, low unemployment, and, most recently, falling interest rates.

Two years seems like a pretty long time for stocks to go up consistently, so how long can we expect this bull market to last? There’s no fool-proof way to determine the length of a bull market with any accuracy but we can look at historical data to see how long they have lasted in the past.

The table below shows all the bull markets of the S&P 500 index since the early 1930’s.

As you can see, bull markets have averaged almost 4.5 years in length so there’s a good chance that this bull market still has a ways to go. Of course, there are always unknown events that could throw a wrench into this bull, and don’t forget about an election that’s only a few weeks away that could stir up some volatility.

Please comment or send an email if you have any questions.

Joe Baker, CFP®

Baker Asset Management, LLC

joebaker@bakerassemanagement.com