Since tariffs have become a daily talking point and affect everyone we know, I thought it would be a good idea to at least try to keep up with their daily gyrations.
The Peterson Institute for International Economics (PIIE) is an independent nonprofit, nonpartisan research organization that has started publishing a guide to document U.S. trade actions during Trump’s second term in office. It is updated whenever there are official government announcements or actions regarding trade policy, which includes tariffs.
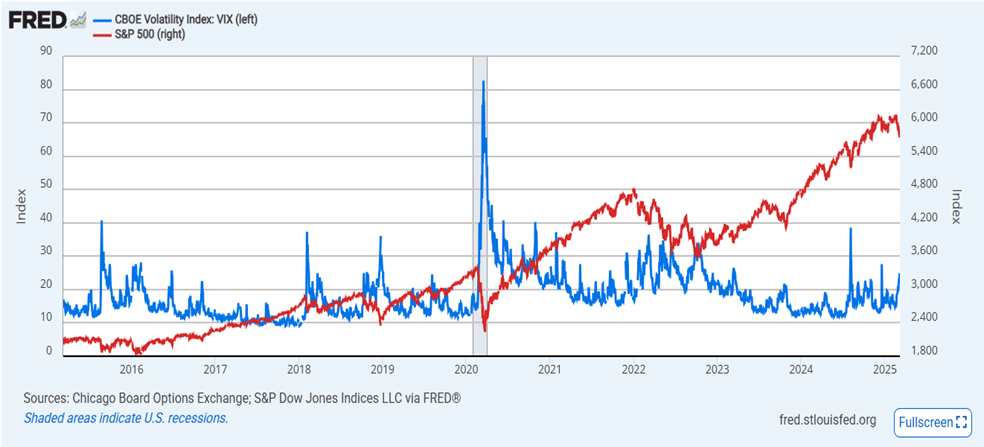
One of the metrics that I like to look at when assessing market risk is the CBOE Volatility Index, more commonly known as the VIX. The VIX measures the level of fear, anxiety, and/or uncertainty in the stock market. Technically, it looks at the options pricing of the S&P 500 index into the near future (about a month). When investors buy a lot of call options, meaning they expect the stock market to go up, the VIX drops. Conversely, when a lot of put options are bought, meaning people expect the stock market to drop, the VIX rises.
Of course, like everything else on Wall Street, there is a saying for the VIX: “When the VIX is high, it’s time to buy. When the VIX is low, look out below!” You’re probably thinking that this doesn’t make sense. A high VIX means there are a lot of pessimistic investors and so it would be bad for stocks. This is true but it is also true that the herd is usually wrong, so the VIX is normally interpreted as a contrarian indicator. This means when everyone is fearful, a high VIX, it’s probably not a bad time to buy stocks and vice versa.
Right now, we have a VIX of a little more than 26, a bit higher than what most investors consider a neutral VIX of 20. This makes sense because there is a lot of uncertainty in the market due to several of the current administration’s policies and there on again, off again status. I suspect that it will stay elevated until the chaos and confusion coming out of D.C. subsides.
An elevated VIX typically brings larger swings in stock market prices. For equity investors with a time horizon of three years or more, this volatility isn’t a big deal, as the major market indices have always trended up over time. For those with a shorter time period, they should have the money that they need in the near-term out of the stock market.
Using the VIX as part of your big picture view of the market’s risk is a useful data point to help with your portfolio management.
Please comment or send an email if you have any questions. Thanks!
Stocks faltered in February, as cracks began to form in the strong economy and labor markets. The S&P 500 tracked with its average February this century, which has been negative. Although earnings reports for Q4 were pretty good for most of the large cap companies here in the states, their outlook for the rest of this year was filled with uncertainty. There are a lot of policy changes coming out of DC right now that have to be analyzed before making estimates on future revenue and earnings.
For the month, the S&P 500 lost about 1.43%. So far this year, it is up 1.24%.
Looking ahead, investors will have to factor in a whole bunch of catalysts before making any investment decisions. Here are the big ones: tariffs, immigration policy, layoffs, and, as always, interest rates. There definitely is less confidence in the stock market and hopes of a soft landing for the economy have faded quite a bit. To wit, companies are planning to tighten their belts going forward this year due to the uncertainty of several trade and fiscal policies that may or may not go into effect, based on CEO surveys.
Historically, March has seen average gains of about 1.1%. That would be a nice rebound from this past month.
Take a look at the Outlook section below to see what events could move the markets over the short term.
Bond prices made a strong move upward as investors flocked to safety. The economic outlook has become quite murky and so money has been heading to the relative safety of the bond universe. Both corporate and government bond prices rose once again in February, marking one of the best yearly starts ever for bonds.
The 10-year US Treasury note yield finished lower in February, settling at about 4.22%, below the 4.54% that it was at the beginning of the month. The 30-year bond yield closed out the month at 4.51%, about 28 basis points lower than a month ago.
Bond investors have done well so far this year but will have to stay on top of the news as the Trump administration continues to roll out several new policy initiatives. Price and yield volatility will certainly continue as these new policies get implemented.
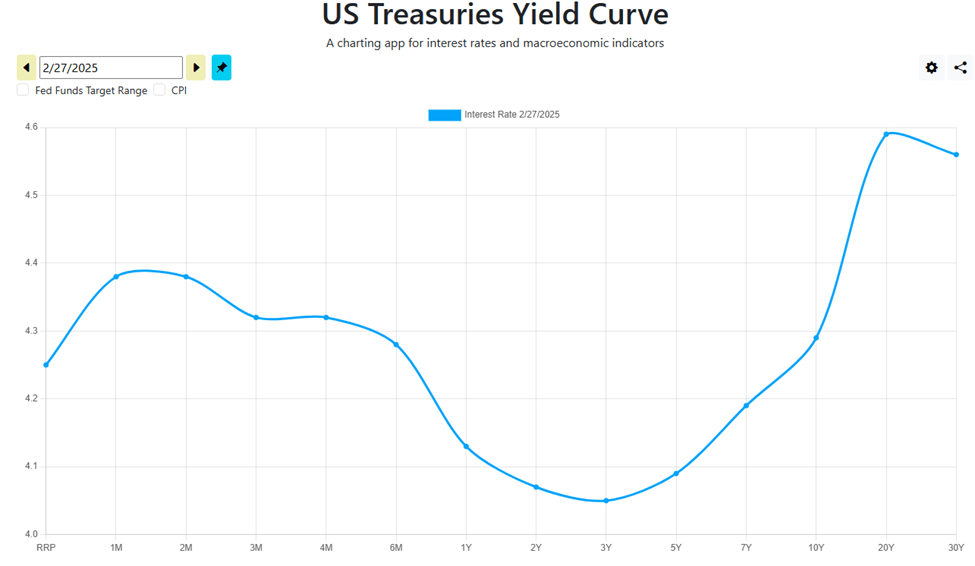
Here’s a look at the current yield curve. As you can see, there is some inversion between the 1 month and 10-year rates, which is indicative of a possible recession.
Savings rates continue to sit where they have been for the past few months. However, with the Federal reserve meeting this month for the first time since January, we could get a clearer picture on where savings rates are headed. Regardless, rates are still very attractive, and I think more money is going to be heading back into the safe havens of money markets and CDs as the stock market shows signs of more volatility. Currently, you can get around 4.5% return on your money. So, CDs and MMAs continue to be a great place to put your cash and your emergency fund, for now. Knowing this, it makes sense in most situations to put cash that you don’t immediately need into CDs with up to 2-year maturities. For emergency cash, stick to high yielding money market and savings accounts, of which the best are yielding around 4.5%. As always, keep the total under $250,000 per person at any one bank to ensure you are fully covered by the FDIC.
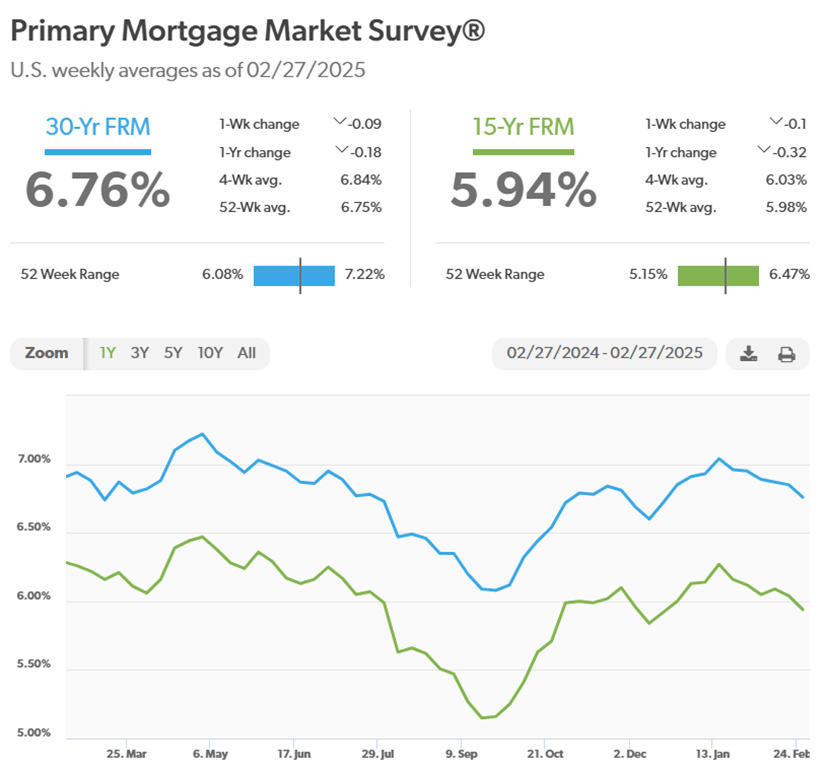
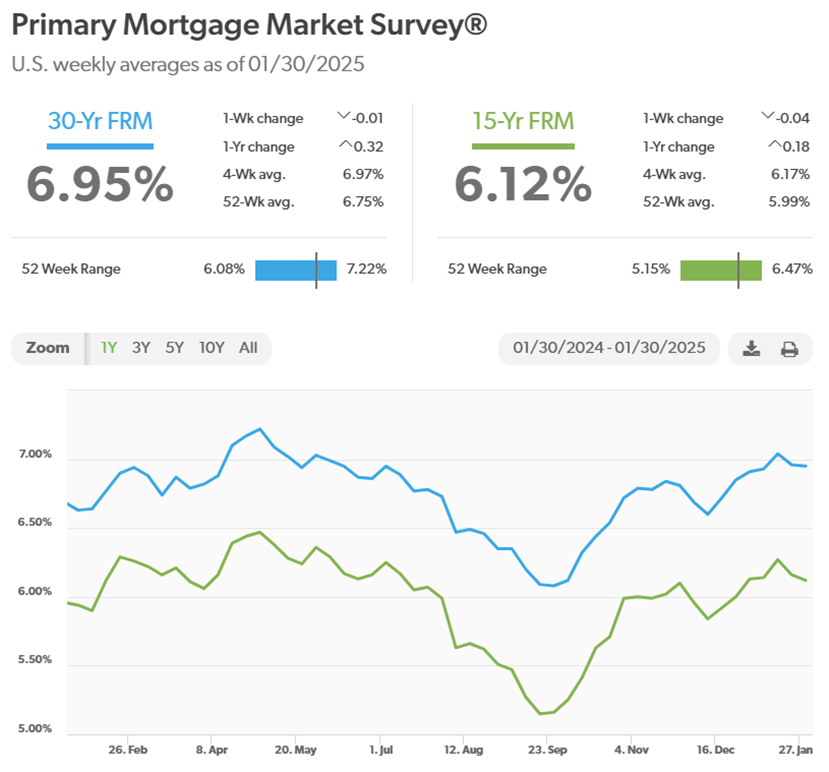
Mortgage rates reversed course and headed lower in February, keeping the 30-year loan below the 7% mark. Currently, the 30-year rate sits at 6.76%, lower than a month ago, at 6.95%. Also, in December 2024, nearly 73,000 homes were delisted, a 64% increase from the previous year. This surge in delistings could indicate a broader cooling of the real estate market and one of the reasons for lower mortgage rates. The real test will be over the next few months during peak buying season.
Here is a look at the one-year chart of the 15- and 30-year mortgage rates from Freddie Mac.
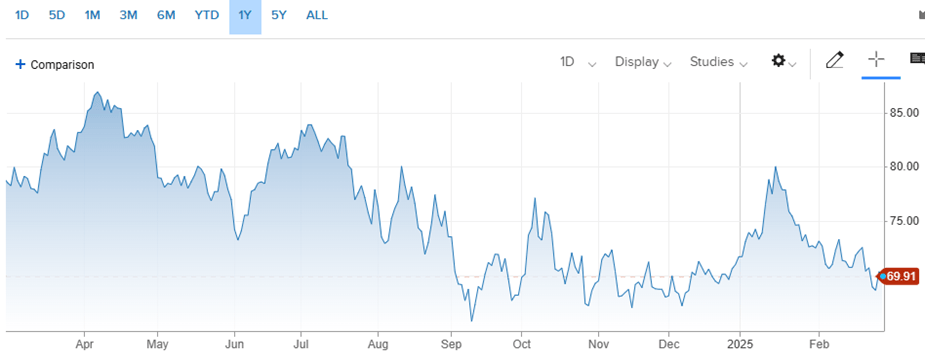
Oil prices rolled over and headed lower in February, dropping below the $70 level despite the threat of tariffs from the U.S. Also, some of the economic data that is coming in now is showing signs of a slowdown which would push prices lower.
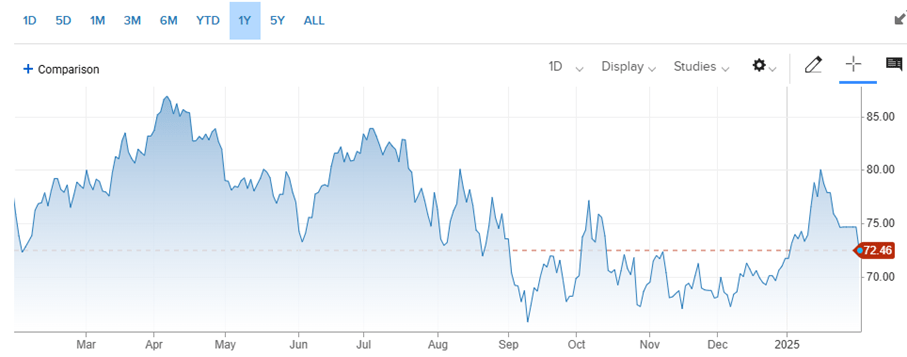
For the month, the price for a barrel of oil closed at $69.91, down from $72.46 at the beginning of February. If this drop in oil prices could be sustained for a while, it could help offset some of the price increases that are expected from the tariffs that are expected to be implemented. Regardless, oil prices below $70 are a good thing for the country as a whole.
Here’s a look at the one-year chart for U.S. oil:
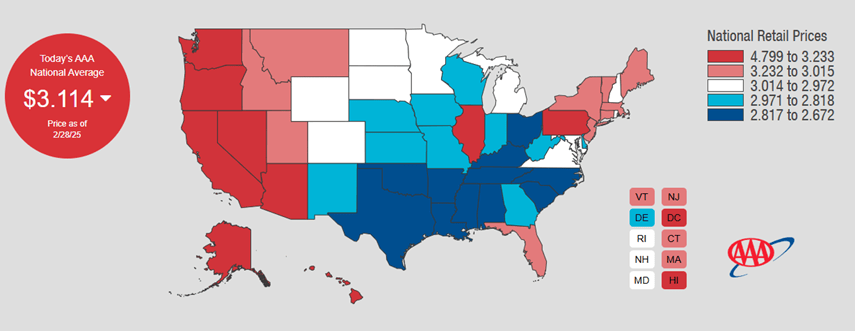
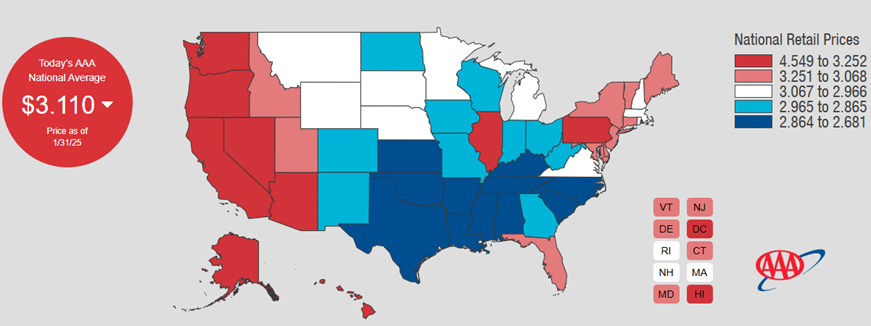
Gasoline prices stayed about the same from January through February. Regular unleaded gasoline is now averaging $3.11 per gallon, same as last month. Hopefully, the recent drop in oil prices will be reflected at the pump next month. Mississippi has the cheapest gas currently, checking in at $2.67 a gallon. California has the most expensive gasoline at $4.80 per gallon. FYI, a year ago, we were paying $3.29.
Check out the prices at the pump in your area: AAA Gas Prices.
Outlook
Events on the horizon that could move the markets in the near term:
Fed & Inflation: Inflation continues to slowly creep back up in certain sectors, such as fuels and groceries (eggs!). The Federal Reserve has a wait and see approach regarding what to do with interest rates. They are definitely in no hurry to resume cutting rates when there is so much uncertainty out there and price inflation remaining sticky. Tariffs, deportations, mass layoffs in the federal government, and major proposed changes in fiscal policy (government spending and taxes) are some of the main forces the Fed has to consider when determining what to do with interest rates. As I said last month, I don’t mind where rates are right now. Investors can swap out of riskier investments and still get a decent rate of return in money markets and CDs.
DOGE Action: The Department of Government Efficiency has made some major moves in the short time that it’s been in existence. I like the fact that they are looking to reduce government spending and improve its efficiency, but their strategy of ready, fire, aim is causing a lot of angst across the financial markets, not to mention the country as a whole. We all want a less bloated and a more streamlined functioning government, but DOGE seems to be prioritizing action over planning, meaning a willingness to take immediate action without a plan for what comes next. The biggest factor affecting markets from DOGE’s efforts is the job losses in both the government sector and the private sector (government contractors). This could help push the economy towards a recession versus the expected soft landing, resulting in a negative catalyst for the markets.
Trump Administration Policies: There are a lot of policy changes happening almost every day, from trade to immigration to taxes. Some of these changes could help boost the economy while others could do damage. But the real problem that is causing the most volatility in the markets is the uncertainty of it all. Nobody knows for certain what will be implemented or what will be tossed aside. We do know that they want to shrink the government and apply tariffs to our imports. That means unemployment will almost certainly increase as the government layoffs accelerate. Also, consumer prices are going to rise as retailers pass on the tariff costs to us. Investors definitely need to be on their toes investing in this environment.
It’s always a good time to go through your stuff and purge what you don’t need anymore. I know I have a few boxes of financial paperwork that need a good going-through to see if anything can be sent to the shredder. Regarding tax documents, there is always the question of how long do we have to keep this information. The good news is that the Internal Revenue Service has some guidelines that can help you sort what to keep and what to get rid of.
Here are some of the retention guidelines that the IRS recommends:
General Rule:
Keep records for 3 years from the date you filed your original return or 2 years from the date you paid the tax, whichever is later, if you file a claim for credit or refund.
Exceptions and Longer Retention:
Keep records for 7 years if you file a claim for a loss from worthless securities or bad debt deduction.
Keep records for 6 years if you do not report income that you should report, and it is more than 25% of the gross income shown on your return.
Keep records indefinitely if you do not file a return or if you file a fraudulent return.
Employment Tax Records: Keep employment tax records for at least 4 years after the date that the tax becomes due or is paid, whichever is later.
Property Records:
Keep records related to property until the period of limitations expires for the year in which you dispose of the property.
These records are essential for calculating depreciation, amortization, depletion, and gain or loss on sale.
Important Considerations:
Even after IRS requirements are met, consider if other entities (e.g., state where you file taxes, lenders, insurance companies) require longer retention.
When records are no longer needed, dispose of them securely, such as by shredding.
Please comment or send an email if you have any questions. Thanks!
2024 is in the rearview mirror but there is still time to reduce your taxable income for last year:
Make a tax-deductible contribution to your IRA.
If you qualify, an IRA contribution can be a great way to reduce your 2024 taxes. You are allowed to contribute up to $7,000. If you are age 50 or older, you can add an extra $1,000 for a total of $8,000. You basically just had to have worked last year (have earned income) to qualify to make an IRA contribution.
Plus, if you are married, you can double the amount with a spousal IRA.
If you are not covered by a retirement plan at work, you can deduct the full amount of your contribution, regardless of how much money you make.
If you do have a retirement plan at work, there are restrictions and limitations to qualify for the full deduction. Here’s a table that summarizes these rules. They are confusing so feel free to shoot me an email with any questions.
2024 Traditional IRA deduction limits
Filing Status
Modified adjusted gross income (MAGI)
Deduction Limit
Single individuals
≤ $77,000
Full deduction up to the amount of your contribution limit
> $77,000 but < $87,000
Partial deduction
≥ $87,000
No deduction
Married (filing joint returns)
≤ $123,000
Full deduction up to the amount of your contribution limit
> $123,000 but < $143,000
Partial deduction
≥ $143,000
No deduction
Married (filing separately)*
< $10,000
Partial deduction
≥ $10,000
No deduction
If you’re self-employed, you can sock away a lot more by opening up a Simplified Employee Pension (SEP) plan before filing your taxes. For 2024, you can contribute up to 25% of your total compensation up to a maximum $69,000.
Please comment or send an email if you have any questions. Thanks!
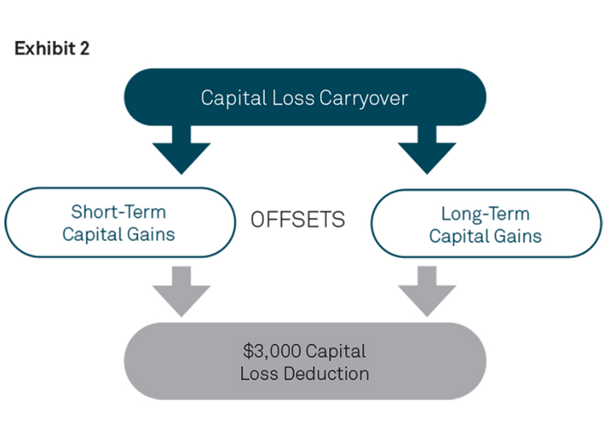
Most investors may not have to worry about capital loss carryover when filing their 2024 federal income taxes since the last two years have been extremely profitable for them. However, because 2022 was such a bad year for the markets, many investors who sold back then may have had more capital losses than capital gains for that year. The good news is that they could have used those excess losses to reduce their capital gains in 2023 and even some of their ordinary income (up to $3,000). If there were still losses left over, they can be used towards offsetting any realized capital gains in 2024 as well as $3,000 of ordinary income.
Capital loss carryover is a tax rule that lets you use investment losses from one year to reduce your taxable income in future years. Before going any further, keep in mind that this rule only applies to taxable accounts, not retirement accounts, such as IRAs.
Here’s how it works:
1. Calculating your net capital loss:
First, you need to calculate your net capital loss for the year. This is the difference between your capital gains (money you made on investments) and your capital losses (money you lost on investments). If it’s less than zero, meaning you have more losses than gains, you can offset some of your income.
You can only deduct up to a certain amount of net capital losses in a single year. This limit is currently $3,000.
2. Carryover of unused losses:
If your net capital loss is greater than the allowable deduction ($3,000), the unused portion automatically carries over to future tax years.
There is no time limit to how long you can carry over capital losses.
You can use the carryover to:
(1) Offset capital gains in future years.
(2) Deduct up to $3,000 against your ordinary income in future years.
3. Applying the carryover:
Each year, you calculate your net capital loss again, considering any new gains and losses.
You can use your current year’s net capital loss first to offset any capital gains you have.
Then, you can apply any remaining unused carryover from previous years to further reduce your taxable income.
4. Important points to remember:
Capital losses are categorized as short-term or long-term based on how long you held the investment before selling. Short-term losses can only offset short-term gains, while long-term losses can offset both short-term and long-term gains.
Wash sales are a strategy where you sell an investment at a loss and then repurchase it shortly after. This is generally not allowed and can prevent you from claiming the capital loss.
It’s important to keep accurate records of your capital gains and losses for tax purposes.
Here’s an example:
In 2022, you had $10,000 in capital losses and no capital gains. You deducted $3,000 of your losses to offset your ordinary income, and the remaining $7,000 carried over to 2023. In 2023, you had $3,000 in capital gains. You can first use your $7,000 loss carryover to completely offset these gains. You then have $4,000 remaining in your carryover that you can offset $3,000 of your ordinary income with, leaving you with $1,000 capital loss carryover to use to offset any gains in 2024.
I hope this explanation helps. Remember, it’s always a good idea to consult with a tax professional for advice specific to your situation.
Please comment or send an email if you have any questions. Thanks!
Monday, February 17th – Presidents’ Day – Stock market is closed.
Stocks kicked off 2025 with a solid performance in January. The economy continues to exceed expectations with low unemployment and solid wage growth. The tech giants that have led the markets higher over the past two years have allowed other industries to get in on the fun this past month, such as financials.
For the month, the S&P 500 gained about 2.67%.
Looking ahead, we still have a big chunk of 2024 Q4 earnings for companies to report but a major headwind for stocks could be inflation, which is starting to creep back up. Even more influential is how the Federal Reserve will try to counter it.
The Trump administration didn’t waste any time getting settled in and is already influencing the markets with several executive orders being implemented. It is still too early to tell how they will affect the economy.
Historically, when January is positive for stocks, full year returns have been positive 77% of the time. However, the S&P 500 has averaged a negative return in February since 2000.
Take a look at the Outlook section below to see what events could move the markets over the short term.
Bond prices are staying on the roller coaster for some more fun, once again reflecting the uncertainty in the current interest rate environment. Both corporate and government bond prices rose during the month of January as the threat of tariffs subsided momentarily. As I am writing this, Trump has declared that the U.S. will hit both Mexico and Canada with a 25% tariff and tack on a 10% duty for all imports coming from China. We should know more details over the weekend. If these tariffs are enacted, you can be sure that bond prices will be staying on the roller coaster.
The 10-year US Treasury note yield finished slightly lower in January, settling at about 4.54%, just below the 4.57% that it was at the beginning of the month. The 30-year bond yield closed out the month at 4.79%, the same as it was a month ago.
Bond investors will have to stay on top of the news as the new administration acts on their new policy initiatives. Price and yield volatility will certainly be picking up as these new policies get implemented.
Savings rates pretty much flatlined in January, most likely waiting on any major moves by the Federal Reserve, of which there were none. The Fed is waiting on policy changes from the new administration to make any decisions, so expect rates to stay where they are in the short term. That said, these rates are pretty good for savers and risk-averse investors. You can get above 4.5% return on your money currently. So, CDs and MMAs continue to be a great place to put your cash and your emergency fund, for now.
Savings rates should continue to stay in a holding pattern until we get a clearer picture on where interest rates are heading. This isn’t a bad thing, especially for risk-averse investors and savers. Knowing this, it makes sense in most situations to put cash that you don’t immediately need into CDs with up to 2-year maturities. For emergency cash, stick to high yielding money market and savings accounts, of which the best are yielding around 4.75%. As always, keep the total under $250,000 per person at any one bank to ensure you are fully covered by the FDIC.
Mortgage rates moved slightly higher in January, pushing the 30-year loan even closer to the 7% mark. Currently, the 30-year rate sits at 6.95%, slightly higher than a month ago, at 6.85%. There is still low inventory, especially for existing homes, so any drop in rates continues to be met with a quick surge in demand. Demand is also being helped by improving consumer confidence and a strong economy.
Oil prices inched up higher once again and it was no coincidence that it occurred right about when oil prices dropped below the $70 level. There seems to be ample supply to meet the world’s demand and no major catastrophes and/or wars to disrupt it.
For the month, the price for a barrel of oil closed at $72.46, up from $71.72 at the beginning of January. We were below $70 a barrel for a little bit at the end of 2024 but that did not last long. Producers love the price above $70 so they tightened the spigots just a touch.
Here’s a look at the one-year chart for U.S. oil:
Gasoline prices crept up slightly in January. Regular unleaded gasoline is now averaging $3.11 per gallon, up from $3.04 last month. Mississippi has the cheapest gas currently, checking in at $2.68 a gallon. Hawaii has the most expensive gasoline at $4.55 per gallon. FYI, a year ago, we were paying $3.14.
Check out the prices at the pump in your area: AAA Gas Prices.
Outlook
Events on the horizon that could move the markets in the near term:
Fed & Inflation: The Federal Reserve held interest rates steady at their last meeting a few days ago. They won’t be meeting again until March so we will have a longer than normal time period before they make a decision on interest rates. Of course, they could change rates at any time but that would jolt the markets more than they would want. They did state that they will be holding rates steady and are in no rush to change them anytime soon. They understand that there are a lot of catalysts coming up this year that will steer their decision-making (see next bullet item). I don’t mind where they are now. This is more of the normal range for the 10-year treasury note and the 30-year mortgage. Plus, risk averse investors can get a decent interest rate in the fixed income market now versus the last 15 years.
New Administration Policies: Besides inflation and interest rates, there are plenty of other things that can move the markets over the next several months. The effects of tariffs (higher consumer prices and/or lower earnings for U.S. companies), immigration (potentially lower unemployment, possibly higher food/construction prices), fiscal policy (lower personal and business taxes), and regulatory policy (less restrictions on businesses) could play a bigger than normal role in moving stock and bond prices. Investors definitely need to keep up with everything that is coming out of D.C. but they need to analyze how it will affect their investments before making any major portfolio changes.
There is a program offered by the IRS that allows you to file your federal taxes through an associated tax preparer for free! The IRS Free File program is a public-private partnership between the IRS and a group of tax software companies called the Free File Alliance. It allows eligible taxpayers to prepare and file their federal income tax returns online for free. Here’s how it works:
1. Eligibility:
Income: The main requirement is your Adjusted Gross Income (AGI). For the 2024 tax year (filing in 2025), the AGI limit is $84,000. This applies to all filing statuses (single, married filing jointly, etc.).
Other factors: Some participating companies may have additional eligibility requirements, such as age or state residency.
Choose a provider: The IRS website provides a list of participating companies and their specific offerings on this page: https://apps.irs.gov/app/freeFile/.
3. Preparing and Filing:
Create an account: Once you’ve chosen a provider, you’ll be redirected to their website to create an account.
Follow the instructions: The software will guide you through the process of entering your tax information.
File electronically: When you’re finished, the software will transmit your return electronically to the IRS.
Key Features of IRS Free File:
Free federal return: Participating companies cannot charge you to prepare and e-file your federal tax return if you qualify.
Guided experience: The software uses a question-and-answer format to help you complete your return accurately.
Error checks: Built-in checks help catch mistakes and ensure your return is complete.
Direct deposit: You can choose to receive your refund via direct deposit for faster processing.
Important Notes:
State taxes: While federal filing is free, some providers may charge for state tax preparation.14 Check with your chosen provider for details.
Support: The level of customer support offered may vary between providers.
Accuracy: Always review your return carefully before filing, even with the help of software.
This is a great service that is most certainly underutilized by eligible tax filers and can potentially save you some hard-earned cash.
Please comment or send an email if you have any questions.
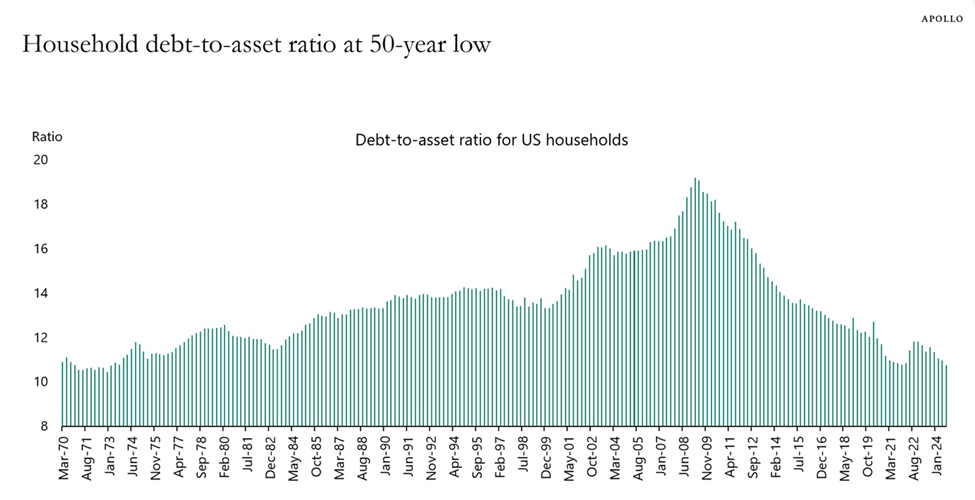
Financially speaking, U.S. households are looking strong heading into 2025. In fact, they have never looked better. Just check out the following chart to see how we are doing compared to the last 50 years:
Source: Federal Reserve, Haver Analytics, Apollo Chief Economist
As you can see, we have come quite a long way from the Great Financial Crisis era in 2008/2009 and are at levels that we haven’t seen since the early 1970’s. There are a few key reasons for such a strong showing:
Home prices have increased at a much faster rate over the past fifteen years than in the past. This has improved the asset side of the balance sheet.
More homes are now owned outright (no mortgage) or have mortgages at a 3% rate or lower than ever before. This has helped reduce household debt quite a bit.
Stellar stock market returns over the past two years have bolstered people’s retirement and investment accounts, thereby increasing their assets and subsequently, their net worth.
Can it keep going?
It’s possible. We still have a shortage of housing which will keep upward pressure on home prices. But mortgage rates are still relatively high which could increase the debt side of the balance sheet of new homeowners.
Regarding stocks, history is on our side. For instance, the S&P 500 has a history of delivering strong gains following two consecutive years of 20%+ gains, which we just had. Since 1950, there have been eight instances where the S&P 500 index has risen by 20% or more for two consecutive years. In six of those cases, the U.S. stock market achieved positive returns in the third year, with an average return of 12%.
Obviously, it’s always tough to predict what’s going to happen over the course of the next year but it’s good to know that we are in a great position now, regardless of what the future holds.
Please comment or send an email if you have any questions.
Recently, the Social Security Fairness Act was signed into law. Its primary purpose is to provide more equitable Social Security benefits for public sector workers and their families.
The way that the new law will achieve this objective is by removing rules that reduce social security benefit payments to workers who receive pensions from employers that did not withhold Social Security taxes. This typically applies to public sector workers (like teachers, firefighters, and state employees) whose pensions were not funded by Social Security.
Here are the two rules that will be removed by the Social Security Fairness Law:
Windfall Elimination Provision (WEP) – Reduces Social Security benefits for individuals who receive pensions from employers that did not withhold Social Security taxes (like state and local governments).
Government Pension Offset (GPO) – Reduces or eliminates Social Security benefits for spouses of public sector retirees.
This is a major change and a huge increase in social security benefits for public sector workers. For many, it will be life changing, in a good way.
Of course, the downside is the higher funding costs which could accelerate the depletion of the social security fund. 2035 is the expected year that there won’t be enough money to pay 100% of the benefits. But I have a feeling that Congress will get that fixed right before the fund runs out of money.
Please comment or send an email if you have any questions.