Starting in 2025, a new temporary federal tax break known as the “Senior Bonus Deduction “is available to taxpayers aged 65 and older. Enacted under the One Big Beautiful Bill Act (OBBBA), this provision is designed to provide additional tax relief through the 2028 tax year.
Key Features of the 2025 Senior Deduction
Deduction Amount: Eligible individuals can deduct up to $6,000 from their taxable income.
Married Couples: If both spouses are 65 or older and file a joint return, they can claim a combined deduction of $12,000.
“Stackable” Benefit: This deduction is in addition to the regular standard deduction and the existing “additional standard deduction” for seniors.
Accessibility: You can claim this deduction regardless of whether you take the standard deduction or itemize your deductions.
Eligibility and Income Limits
The full deduction is only available to those under specific income thresholds based on their Modified Adjusted Gross Income (MAGI):
Filing Status
Full Deduction Income Limit
Phase-Out Range
Single / Head of Household
Up to $75,000
$75,001 – $175,000
Married Filing Jointly
Up to $150,000
$150,001 – $250,000
Phase-Out Rule: For every $1 your MAGI exceeds the limit, the deduction is reduced by 6 cents until it reaches zero.
Age Requirement: You must be 65 or older by December 31, 2025.
Exclusion: The deduction is not available to those who use the “Married Filing Separately” status.
Impact on Social Security
While often discussed as a “No Tax on Social Security” measure, the law does not technically eliminate federal taxes on Social Security benefits. Instead, the $6,000 deduction serves to lower your overall taxable income, which for many seniors with modest incomes effectively offsets the portion of their Social Security that would have been taxed.
Maximum Combined Deductions for 2025
For a senior taking the standard deduction, the total amount of income sheltered from federal tax in 2025 could reach:
Single (65+):$23,750 ($15,750 base + $2,000 age-based + $6,000 new bonus).
Married (Both 65+):$46,700 ($31,500 base + $3,200 age-based + $12,000 new bonus).
Please comment or send an email if you have any questions.
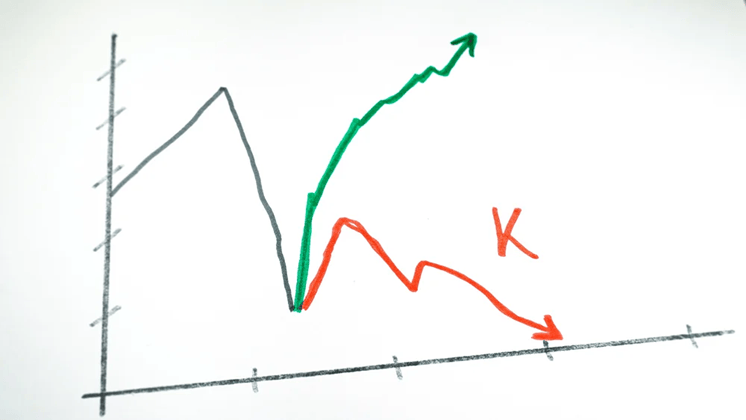
A K-shaped economy describes a situation where, following an economic downturn (pandemic), different parts of the economy recover at vastly different rates, resembling the two legs of the letter “K”. The key characteristic is the widening gap between the wealthy, who see their fortunes rise, and lower-income individuals and some industries, who continue to struggle. Looking back, this started shortly after the pandemic shutdown and the divergence between the upper- and lower-income legs became more evident once the federal government stopped the covid relief payments.
Let’s break it down.
Pros of the K-Shaped Economy (The Upper Leg)
The upper leg of the “K” highlights robust growth in certain areas, which can benefit the overall economy in specific ways:
Innovation and Productivity: Sectors that thrive, often driven by technology and large-scale investment, experience rapid innovation and high productivity. This leads to strong corporate profits and stock market performance.
Targeted Investment: The success of leading industries attracts significant investment, which further fuels growth in those areas (e.g., AI infrastructure and data centers).
Economic Resilience (for some): High-income households benefit from appreciating assets (stocks, real estate) and can maintain high consumer spending, which props up a significant portion of the overall economy.
Examples of the Upper Leg:
Technology Companies: Firms involved in software, artificial intelligence, and cloud computing (e.g., the “Magnificent 7” tech stocks) have seen immense revenue and stock price growth.
Wealthy Households: Individuals with significant financial investments see their net worth climb due to strong market performance and asset appreciation.
Premium Goods/Services: Companies selling high-end products, like luxury cars or premium airline seating, experience strong demand from affluent consumers.
High-skill Professionals: These individuals often maintain job security and can benefit from remote work flexibility and rising wages.
Cons of the K-Shaped Economy (The Lower Leg)
The lower leg reveals significant challenges, primarily centered around growing disparity and economic strain:
Widening Inequality: The most significant downside is the exacerbation of the gap between the rich and poor, leading to a less equitable society.
Financial Strain: Lower-income individuals face immense pressure from stagnant wages, high inflation, surging debt, and rising costs for essential goods like housing and groceries.
Unsustainable Growth: An economy propelled largely by the wealthiest 10% (who account for about half of all spending) may not be sustainable long-term. If the struggling majority cuts back spending significantly due to financial distress, it could pull the entire economy into a recession.
Policymaking Challenges: The K-shape makes it difficult for policymakers to implement broad stimulus actions, as measures that help the struggling lower leg (e.g., low interest rates) might overheat the booming upper leg, and vice versa.
Examples of the Downward Leg:
Service & Hospitality Industries: Businesses like restaurants and hotels have struggled with recovery, job losses, and revenue drops.
Lower-Income Households: This group faces increasing debt, stagnant real wage growth, and higher rates of loan delinquencies.
Younger Generations: This group often face greater challenges, grappling with student loans and high costs for necessities like housing and groceries.
Small Businesses: Many small, brick-and-mortar retailers and other local firms have been hit hard, lacking the capital and digital infrastructure of larger corporations.
It is also important to note that the current administration’s trade policies, particularly the tariffs, have made this situation so much worse for lower income households and small businesses.
To summarize, the K-shaped economy creates a significant increase in wealth inequality. While overall economic indicators like GDP or the stock market may appear strong, they don’t tell the full story, as many people are left behind. This divergence can create an economy that relies heavily on the spending of a small, wealthy segment of the population, which is not sustainable in the long term.
Please comment or send an email if you have any questions.
December 24th, Wednesday, – Christmas Eve. Stock market will close early at 1:00 p.m.
December 25th, Thursday, – Christmas. Stock market is closed.
December 31st, Wednesday, – New Year’s Eve.
Stocks squeaked out a small gain this past November following a strong five-day rally at the end of the month. This helped the index to extend its streak of positive monthly returns to seven. However, the big tech stocks that have been powering the index higher this year took a breather as investors hit the sell button due to concerns over valuations and the massive amounts that they are spending on AI implementation.
For the month of November, the S&P 500 rose a mere 0.13%, well below its average over the last thirty years of 2.60%. For the year, the index is up about 16.45%. Still hoping for that Santa Claus rally to finish out the year even stronger.
Looking ahead, potential catalysts to move stocks this December include the Federal Open Market Committee (FOMC) meeting on December 10th and the potential SCOTUS decision on the legality of many of the tariffs implemented this year. Investors are expecting another 25 basis points cut from the Fed, but the crystal ball is murky on what they do next, especially because there hasn’t been much economic data coming out due to the recent government shutdown which thankfully ended this past month. Regarding the SCOTUS decision, a ruling against the tariffs would certainly help the bottom line of our companies and also help reduce inflation, which would be great for the bottom lines of households, especially those in the lower tiers of the income scale.
Historically, December is one of the best months of the year for the S&P 500 index, averaging about +1.5% over the last thirty years. December also falls within a period of historically strong performance, with the S&P 500 delivering an average return of approximately 7% from November to April since 1945, which is significantly higher than the average return in the other six months of the year. Come on, Santa!
Take a look at the Outlook section below to see what events could move the markets over the short term.
Bond prices were relatively flat but fluctuated quite a bit during November. One of the reasons was the lack of economic data while the government was shut down. Another was conflicting messages coming out of the Federal Reserve on whether or not they were going to cut rates during their December meeting, their final meeting of 2025. The picture cleared up by the end of last month indicating that the Fed will almost certainly cut rates by another 25 basis points before the end of the year.
Bond investors will be anxiously awaiting the results of the FOMC meeting that concludes on December 10th. As I previously stated, a 25-bps cut is pretty much baked into the cake. Any insights on inflation and employment numbers by the Fed will also be very much anticipated at that meeting. Another potential mover of bond prices will be the SCOTUS ruling on the legality of several tariff policies, which may be announced this month. If they deem the tariffs illegal, the Fed will almost certainly start cutting rates more aggressively since a big catalyst of the current rise in inflation will be removed.
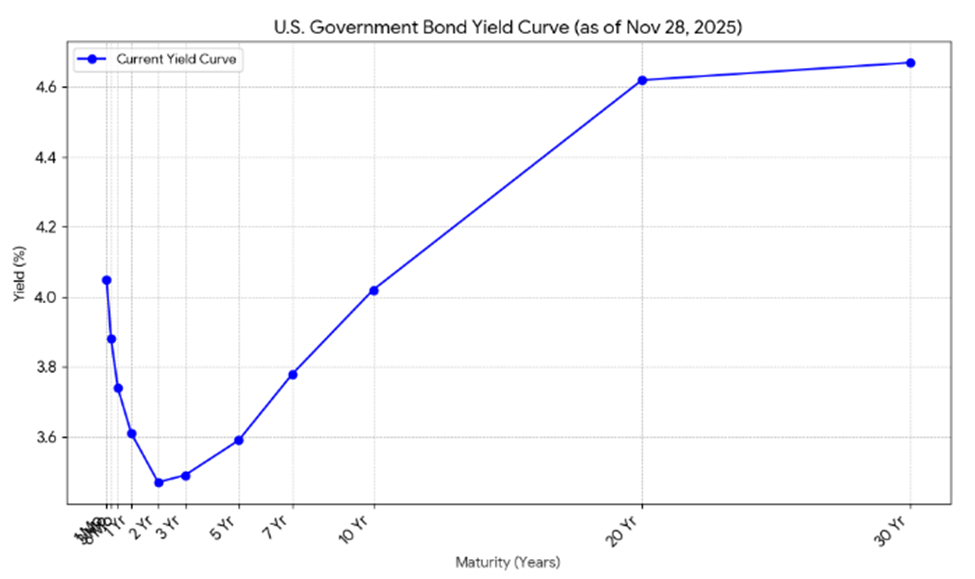
The 10-year US Treasury note yield finished lower in October, settling at 4.02%, lower than the 4.08% yield that it was at the beginning of the month. The 30-year bond yield closed out the month at 4.67%, just 1 basis point higher than a month ago. For the most part, the yield curve has normalized, with the exception of the very short maturity periods, less than two years. Check it out:
There is still plenty of uncertainty in the bond market, so it is prudent to invest in bonds that mature sooner rather than later. I like bonds with a 9-to-12-month maturity and plan on holding onto them until they mature.
Savings rates continue to creep lower as employment data continues to deteriorate and the expectation that the Fed will cut rates for the third time this year in December. Money market rates and savings accounts are averaging only about 0.5% but the best rates can be found at credit unions and online banks. It is worth some of your time looking for the place with the best rates to park your cash.
Account Type
Average Rate
Highest Rate
Money Market Account
0.54%
4.50%
High-Yield Savings Account
0.51%
5.00%
CD Term
Average Rate
Highest Rate
1-Year
1.80%
4.30%
3-Year
1.50%
4.15%
5-Year
1.51%
4.30%
There are literally tons of cash in savings accounts despite falling interest rates. Currently, there is approximately $11 trillion held in insured deposits in FDIC-insured institutions, which includes savings and CD accounts. Separately, the total assets held in money market funds is about $7.57 trillion. If interest rates for these accounts continue to drop, we could start to see some of this cash flow to corporate bonds with higher yields as well as dividend-paying stocks. This is a trend to look for over the next several months.
For now, CDs and MMAs are still a great place to put your cash and your emergency funds. Knowing this, it makes sense in most situations to put cash that you don’t immediately need into CDs with up to 2-year maturities. For emergency cash, stick to high yielding money market and savings accounts, of which the best are yielding about 5.0%. As always, keep the total under $250,000 per person at any one bank to ensure you are fully covered by the FDIC.
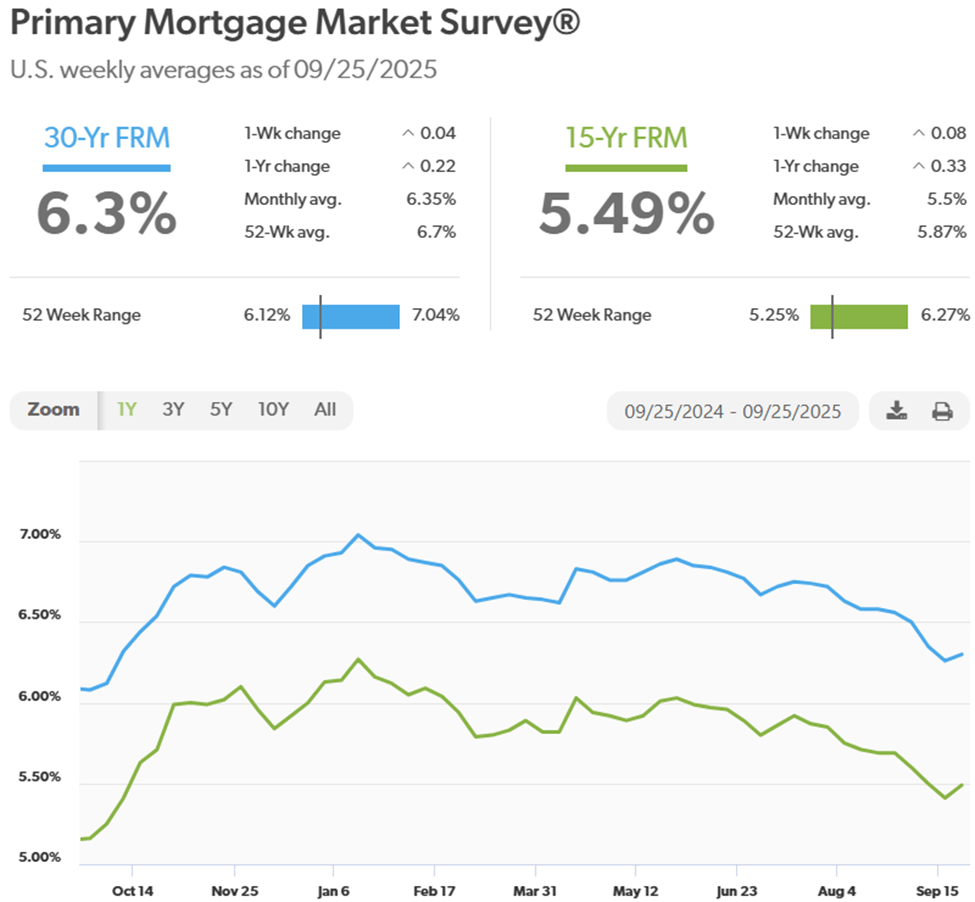
Mortgage rates halted their descent and headed higher in November as demand picked up slightly. Despite this rise, we are still near the 12-month lows. Rates should revert to their previous trend of heading lower as expectations for a Fed rate cut are locked in. Also, continued weakness in the labor market will put downward pressure on rates as well.
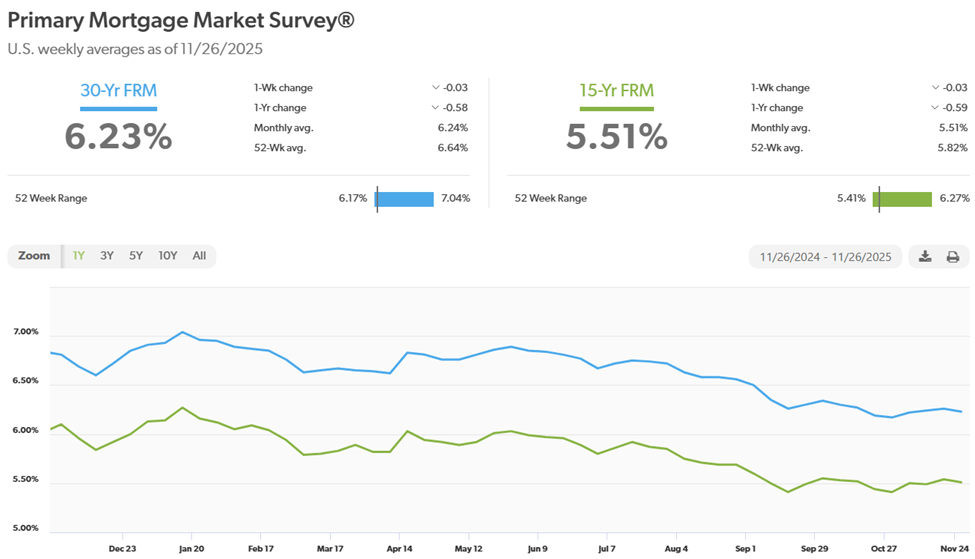
The 30-year fixed rate finished the month at 6.23%, just 6 bps higher than last month. It remains firmly below the narrow range of 6.5% and 7% that it had been at for most of the previous year.
Here is a look at the one-year chart of the 15- and 30-year mortgage rates from Freddie Mac.
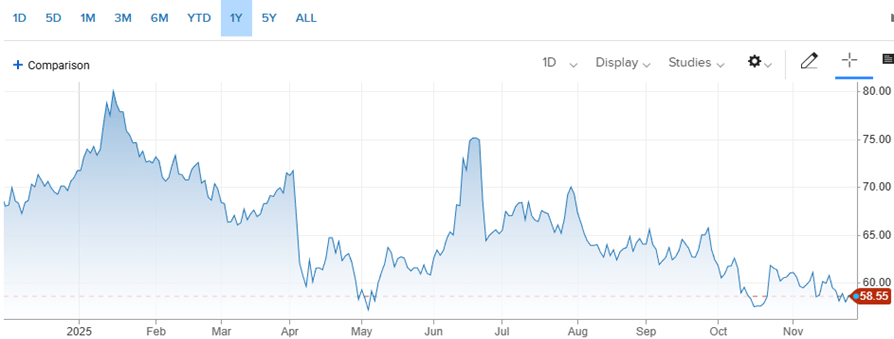
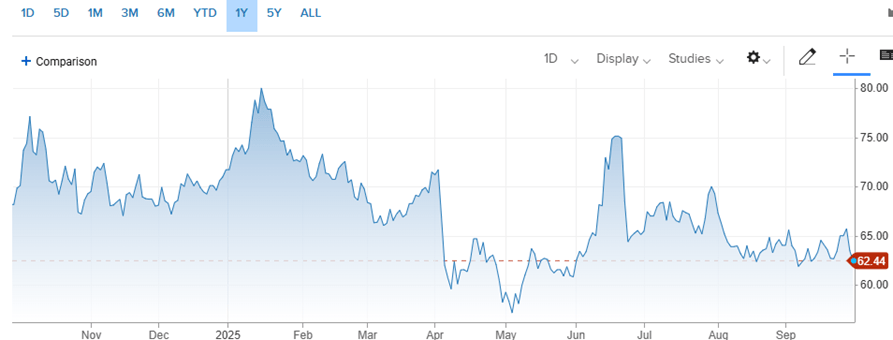
Oil prices continued to drop in November as a combination of increased global supplies, slowing demand, and Ukraine-Russia peace talks continuing to move forward.
For the month, the price for a barrel of oil closed at $58.48, down about $2.30 from the beginning of November. For the year, it’s down about 18.50%.
Looking ahead, I see prices hovering around the $60 area for the near future because there just aren’t any drivers that can move prices higher, other than a major war or suppliers simply turning the spigots off. Also, with prices now down in the $50s per barrel, we will start to see some drillers stop pumping because it is no longer profitable, particularly for the shale drillers.
Here’s a look at the one-year chart for U.S. oil:
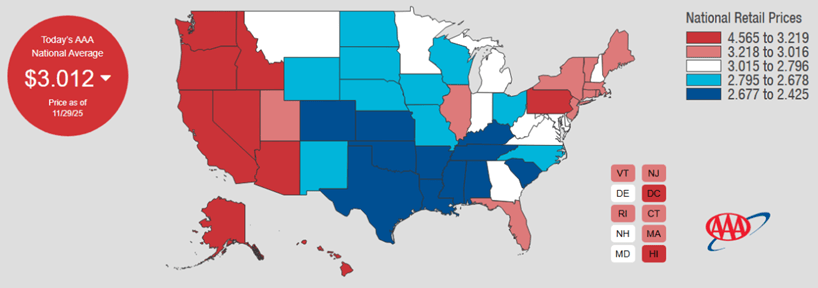
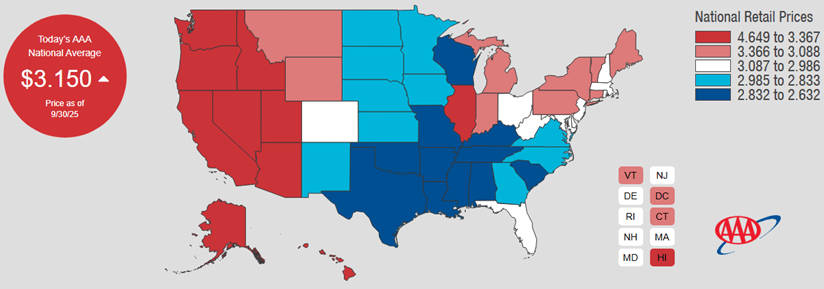
Gasoline prices drifted slightly lower in November, down just 3 cents from the previous month, as they followed oil prices lower. We should continue to see prices moving lower, mostly due to increased oil supply as well as slowing demand (seasonal but also economic). Oklahoma had the cheapest gas this past month, checking in at $2.43 a gallon. California still has the most expensive gasoline at $4.57 per gallon. FYI, a year ago, we were paying $3.06.
Check out the prices at the pump in your area: AAA Gas Prices.
Outlook
Events on the horizon that could move the markets in the near term:
Fed & Inflation: With no FOMC meeting in November and the government shut down for all of October and almost half of November, there was even more uncertainty in the markets, and it showed. There was much more volatility in both the bond and stock markets this past month and that may not end until we get some more recent economic data. Regardless, they’ll be cutting rates by 25 bps at their next meeting in about a week.
Despite the lack of official economic data recently, I feel that there is enough data from payroll providers, job seeker sites, and layoff announcements to confirm that the health of the jobs market is weakening enough to justify another rate cut. Inflation is still increasing but under control and could get some help if the Supreme Court rules in favor of the small businesses that sued that the tariffs are illegal. So, the momentum is with lower interest rates, which bode well for both stocks and bonds.
Trump Administration Policies: The tariff whipsaw continues with tariffs being implemented as well as exemptions for specific countries or materials. SCOTUS is expected to rule on the legality of many of the tariffs put in place this year, hopefully by the end of the year. If they are deemed illegal and tariffs refunded, it will be a big win for small businesses and may even provide a boost for the markets.
Artificial Intelligence: I talked last week about the growth path of AI and how disruptive that it will be over the next decades. I feel that it is advancing so quickly that many of the companies announcing layoffs this year may never have to staff those positions again. This is great for company profitability after the initial costs of implementing AI, but not so good for the overall job market. This is a problem that needs to be reckoned with sooner than later, in my opinion. That said, AI is a transformative force that is influencing all sectors of the global economy as we speak and will be the major market mover for years to come, in my opinion. As an investor, this is the major theme that you want to consider when selecting investments over the next few decades.
AI is being adopted across the U.S. healthcare system—by insurers, hospitals, and medical professionals—to drive down costs, which has the potential to translate into lower healthcare premiums for U.S. citizens.
The primary ways AI contributes to cost reduction are through administrative efficiency, improved clinical outcomes, and fraud prevention.
🏥 Hospitals & Medical Professionals
AI can reduce costs for providers by increasing efficiency and improving the quality of care, which lowers expenses associated with errors, unnecessary procedures, and long hospital stays.
Boosted Administrative Efficiency:
Automation of Tasks: AI tools can automate nearly 45% of administrative tasks in healthcare, such as eligibility verification, prior authorization, and billing, which is projected to save the sector billions annually.
Clinical Documentation: AI-powered scribes and voice-to-text tools reduce the time clinicians spend on post-visit charting and paperwork, allowing them to spend more time with patients.
Operational Optimization: AI helps manage hospital resources by predicting staffing needs, patient flow, and bed capacity, leading to better utilization of costly resources and reduced administrative overhead.
Improved Clinical Care & Outcomes:
Early & Accurate Diagnosis: AI algorithms can analyze medical images (like CT scans and mammograms) and patient data with high speed and accuracy, leading to earlier detection of diseases like cancer.Early detection prevents conditions from escalating, which is far less expensive to treat.
Reduced Medical Errors: AI can monitor care in real-time, comparing clinician actions against safety protocols and alerting them to missed steps, thereby preventing costly errors like medication mishaps or hospital-acquired infections.
Personalized and Preventive Care: AI analyzes comprehensive patient data (including genetics, lifestyle, and claims history) to identify high-risk patients and recommend timely, tailored, and proactive interventions, reducing the need for expensive emergency or late-stage treatments.
⚕️ Health Insurers
Insurers are leveraging AI to manage risk, streamline operations, and prevent financial losses, which directly impacts the costs used to calculate premiums.
Fraud, Waste, and Abuse Detection:
AI-powered systems can analyze vast amounts of claims data to detect suspicious patterns and irregularities that traditional methods often miss, helping to flag and prevent billions of dollars lost to healthcare fraud annually.
Streamlined Claims Processing:
AI automates the review, assessment, and processing of insurance claims, reducing manual errors, speeding up turnaround times, and lowering operational costs for the insurer.
Accurate Risk and Cost Prediction:
Insurers use predictive analytics to forecast health outcomes and future utilization more accurately. This allows for more precise risk assessment, which can lead to fairer, better-priced premiums, and better-managed care plans.
Enhanced Customer Service:
AI-powered virtual assistants and chatbots handle routine member inquiries about benefits, costs, and finding in-network providers, reducing the need for costly human call center support.
The combination of these efficiencies—from reducing administrative waste to preventing expensive diseases and cracking down on fraud—creates substantial cost savings (some estimates suggest hundreds of billions annually). If these savings are consistently realized and passed on to the consumer, they can significantly moderate or lower the cost of healthcare premiums. The savings are a certainty. Passing on the savings to us in the form of lower premiums and cost of care is the more important question.
Please comment or send an email if you have any questions.
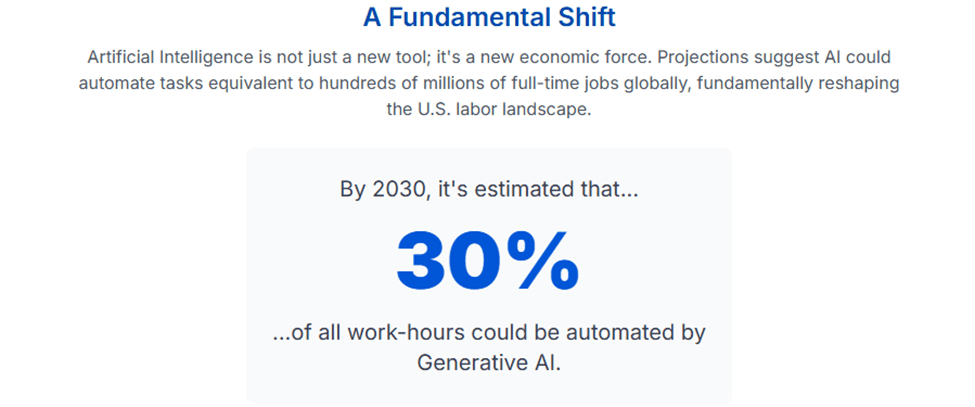
Artificial Intelligence (AI) is reshaping the U.S. economy with major challenges and opportunities. While AI promises long-term gains like productivity growth and higher national income, it also brings short-term risks of job loss and market disruption.
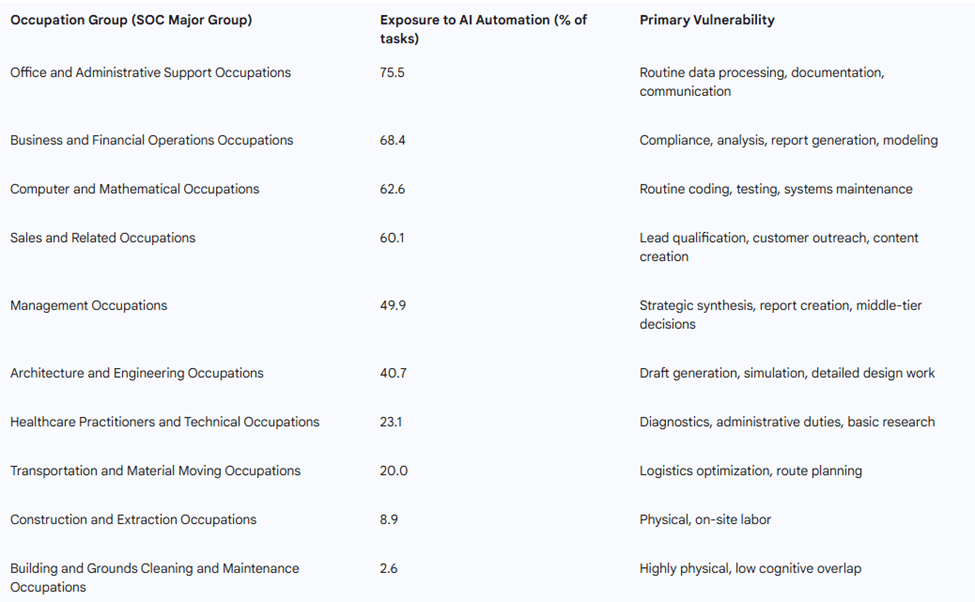
That percentage almost seems unbelievable, especially since it is less than 5 years away. Here’s where we are going to see it the most: The following table, based on the percentage of tasks susceptible to automation, identifies the highest-risk occupation groups in the U.S. economy:
Some jobs can’t be easily replaced by machines (yet) because they need special skills, physical effort, or involve important moral choices. These jobs are called “Fortress Occupations”:
Jobs that need a lot of skill and unpredictable physical work, like surgery or trades (plumbers, electricians, masons, etc.), are hard for robots to do. Even simple physical jobs, like cleaning, aren’t fully automated because it’s too expensive.
Jobs that rely on emotion and trust, like caring for others, therapy, or teaching, still need real people because technology can’t replace human empathy or ethical decision-making.
So, as AI handles most routine cognitive tasks, skills like critical thinking, decision-making, and emotional intelligence become more valuable. Success will depend on managing AI tools with strong human judgment and problem-solving.
The Long-Term Challenge: AI and Income Polarization
AI isn’t just changing how many jobs there are, it’s also making the gap between rich and poor even wider. In the past, technology like computers took over a lot of middle-paying jobs, splitting the workforce into mostly high-paying and low-paying positions. Now, AI is going after higher-skilled, well-paid jobs (like analysts and programmers). When these workers lose their jobs, they could end up competing for lower-wage service roles that still need humans, such as hospital aides or nannies. This shift pushes down wages for those jobs and means most of the new wealth created by AI goes to the people who own and develop the technology. As a result, the middle class shrinks, leaving a small group of highly paid experts and a much larger group of low-paid workers. Solutions to this problem could include universal basic income and universal healthcare.
In summary, as AI accelerates both economic growth and inequality, the future will depend on how society navigates these challenges and harnesses technology to benefit everyone.
{Btw, AI did the bulk of the research for this blog post as well as the first few drafts!}
Please comment or send an email if you have any questions.
November 27th, Thursday – Thanksgiving Day, Stock market is closed.
November 28th, Friday – Stock market will close early at 1:00 p.m.
Stocks continued to power higher in October, despite tariffs, government shutdowns, higher inflation, and more layoffs. Another strong performance this past month made it SIX months in a row of positive returns for the S&P 500 index. Once again, much of the gains can be attributed to big tech and big financial stocks as they appear to be the most resilient to the current economic headwinds.
For the month of October, the S&P 500 rose a solid 2.42%, above its thirty-year average of +1.85%. For the year, the index is now up about 16.47%. That’s a great yearly return already and we still have a potential Santa Claus rally on its way!
Q3 earnings season has generally been positive and resilient, especially given the ongoing economic uncertainty. Companies in the S&P 500 index are clearly adapting to the tariff environment.
Historically, November is the best month for the S&P 500 index, averaging about +2.6% over the last thirty years. November is also the starting month for a period of historically strong performance, with the S&P 500 delivering an average return of approximately 7% from November to April since 1945, which is significantly higher than the average return in the other six months of the year.
The major market catalysts (that we know about) for November will be interest rates, SCOTUS ruling on the legality of certain tariffs, and jobs numbers if the government ever opens back up.
Take a look at the Outlook section below to see what events could move the markets over the short term.
Bond prices were flat to slightly down last month at the short end of the curve but rose slightly for bonds with maturities out past ten years. It’s a tough investing environment right now for fixed income investors because of the lack of economic data due to the government shutdown. Plus, the bond markets were rattled when the Fed cut rates but said another rate cut is not a given for this year.
Bond investors will be watching the Fed, as always, but also the Supreme Court to see if they deem the tariffs illegal. If they do, the Fed will almost certainly start cutting rates more aggressively since a big catalyst of the current rise in inflation will be removed.
The 10-year US Treasury note yield finished lower in October, settling at 4.08%, lower than the 4.16% yield that it was at the beginning of the month. The 30-year bond yield closed out the month at 4.66%, 8 basis points lower than a month ago.
There is still plenty of uncertainty in the bond market, so it is prudent to invest in bonds that mature sooner rather than later. I like bonds with a 9-to-18-month maturity and plan on holding onto them until they mature.
Savings rates are starting to roll over as the Fed cut rates for the second time this year. Money market rates and savings accounts are averaging only about 0.5% but the best rates can be found at credit unions and online banks. It is worth some of your time looking for the place with the best rates to park your cash.
Account Type
Average Rate
Highest Rate
Money Market Account
0.59%
4.40%
High-Yield Savings Account
0.56%
5.00%
CD Term
Average Rate
Highest Rate
1-Year
1.68%
4.10%
3-Year
1.33%
4.25%
5-Year
1.34%
4.07%
With money market and bank savings deposits still at record highs (about $7.42 trillion just in money market funds) and savings rates starting to head lower, we could start to see cash flowing from savings and CDs to corporate bonds with higher yields as well as dividend-paying stocks. This is a trend to look for over the next several months.
For now, CDs and MMAs are still a great place to put your cash and your emergency funds. Knowing this, it makes sense in most situations to put cash that you don’t immediately need into CDs with up to 2-year maturities. For emergency cash, stick to high yielding money market and savings accounts, of which the best are yielding about 5.0%. As always, keep the total under $250,000 per person at any one bank to ensure you are fully covered by the FDIC.
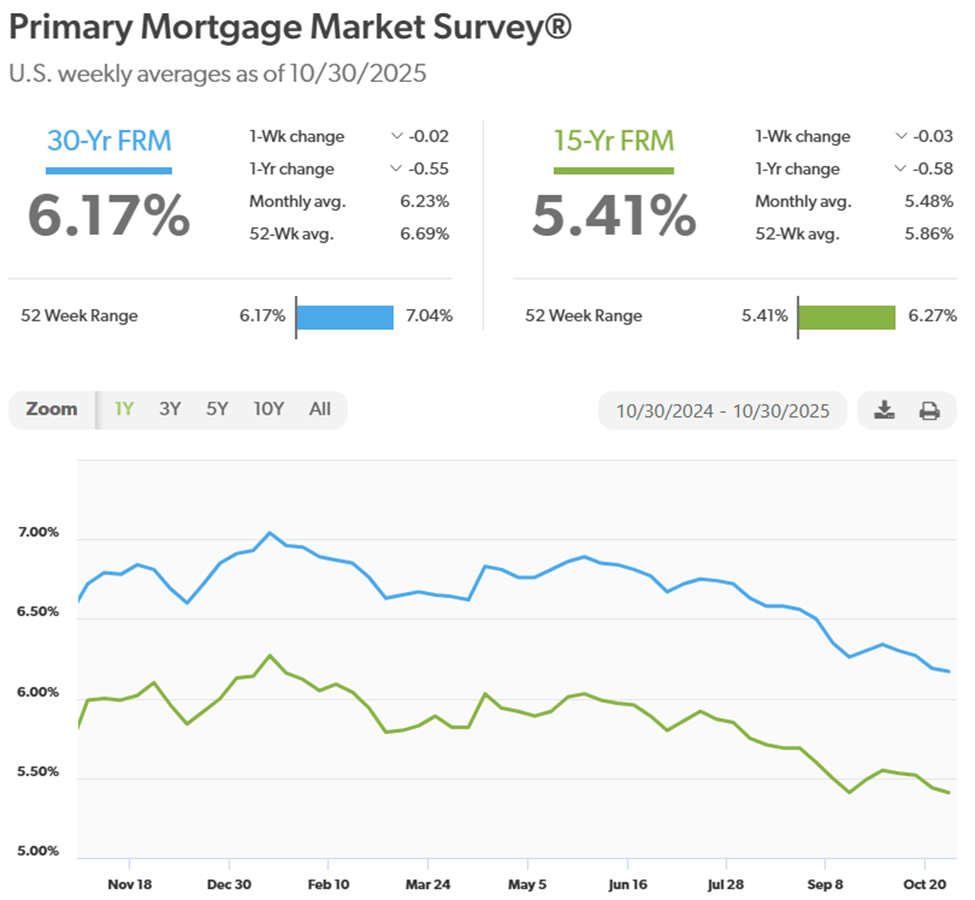
Mortgage rates continued to drift lower in October even as demand surged, primarily due to refinancing activity. Rates continue to hit new 12-month lows. Housing is still experiencing low inventory, particularly for existing homes. Builders are trying to fill the inventory gap, but prices are still too high for many first-time homeowners.
The 30-year fixed rate finished the month at 6.17%, about 17 bps lower than last month and the lowest it has been all year. It is now firmly below the narrow range of 6.5% and 7% that it has been in since October of last year.
Here is a look at the one-year chart of the 15- and 30-year mortgage rates from Freddie Mac.
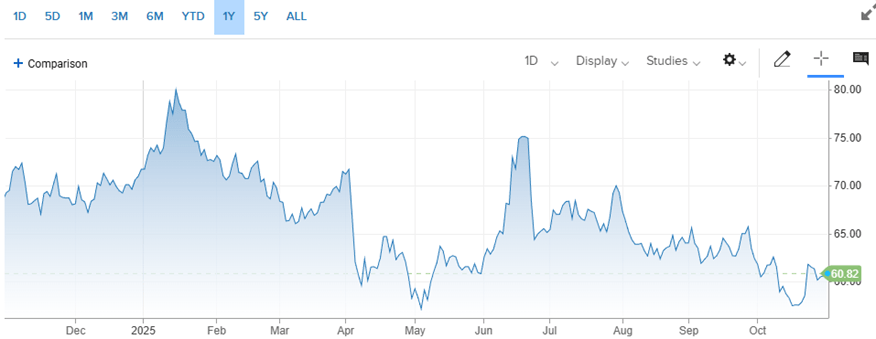
Oil prices drifted lower in October as global supplies increased across the board, even as demand slowed. West Texas Intermediate, or WTI, price dropped close to $57 per barrel before settling above $60.
For the month, the price for a barrel of oil closed at $60.78, down about $1.66 from the beginning of October. For the year, it’s down about 15.25%. Looking ahead, I see prices hovering around the $60 area for the near future because there just aren’t any drivers that can move prices higher, other than a major war or suppliers simply turning the spigots off.
Here’s a look at the one-year chart for U.S. oil:
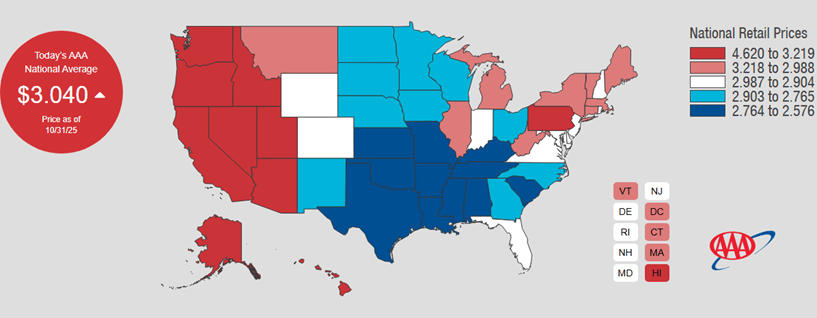
Gasoline prices dipped once again this past month, down 11 cents from the previous month, as they followed oil prices lower. We should continue to see prices moving lower, mostly due to increased oil supply, both in the states and globally. Texas jumped took the trophy for the cheapest gas this month, checking in at $2.58 a gallon. California still has the most expensive gasoline at $4.62 per gallon. FYI, a year ago, we were paying $3.13.
Check out the prices at the pump in your area: AAA Gas Prices.
Outlook
Events on the horizon that could move the markets in the near term:
Fed & Inflation: For the second time this year, the Federal Open Market Committee (FOMC) cut interest rates, lowering the benchmark federal funds rate by 0.25 percentage points to a new target range of 3.75% to 4.00%. They made this cut without recent economic data to support their move since the government has been shut down for the entire month of October.
Where the Fed goes from here is still a bit murky. The economy is still proving resilient as consumer spending is quite strong even as companies pass on more of the tariff costs that they have been absorbing so far this year. The labor market is still weak, with plenty of layoffs being announced over the past few months. If these trends continue, I think another rate cut at the next FOMC meeting in December is a lock. Another 25-basis point rate cut is probably baked into the stock market cake already so don’t expect too much of a bump for stocks when they meet for the last time of the year.
Trump Administration Policies: The tariff whipsaw continues with tariffs being implemented as well as exemptions for specific countries or materials. Recent data shows how the tariff costs are being distributed:
Party Bearing the Economic Burden
Estimated Percentage of Tariff Cost
Description
U.S. Consumers
35% – 55%
This is the portion passed on as higher retail prices on the final imported goods.
U.S. Importing Businesses
20% – 30%
This is the portion absorbed by domestic importers (retailers, manufacturers, etc.) in the form of lower profit margins.
Foreign Exporters/Producers
15% – 20%
This is the portion absorbed by foreign companies through lowering their pre-tariff export prices to remain competitive.
For our biggest companies, they can survive the increased costs, supply chain disruptions, and rising financial strain due to tariffs, but small businesses are having a much tougher time keeping their heads above water. Also, consumers are still spending in the higher income brackets, but the lower income population has certainly tightened their belts.
Tariffs are facing a big legal test this week, as the Supreme Court reviews the legality of many of the tariffs put in place this year. If they are deemed illegal and tariffs refunded, it will be a big win for small businesses and may even provide a boost for the markets.
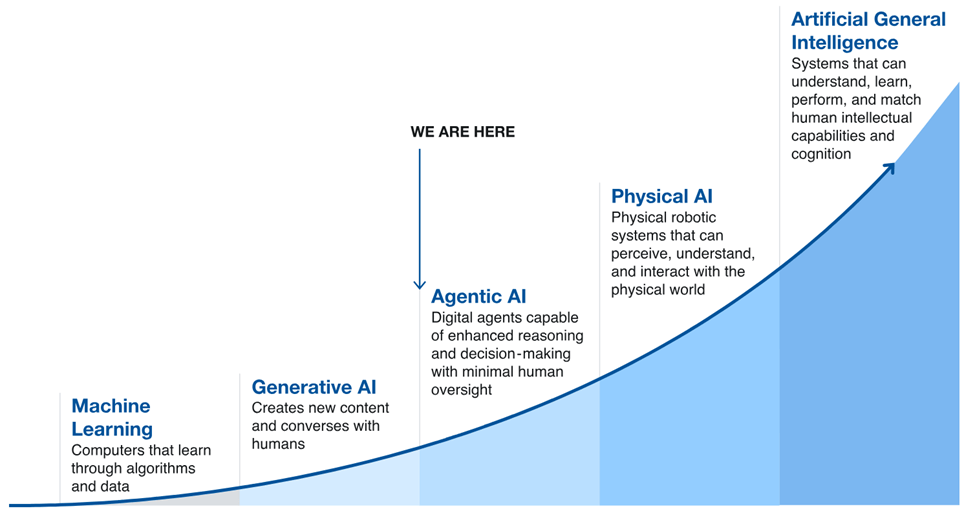
Artificial Intelligence: The following illustration is a simple, but powerful roadmap of the AI revolution.
Regardless of the current headwinds for the economy and financial markets, AI is a transformative force that is influencing all sectors of the global economy and will be the major market mover for years to come, in my opinion. As an investor, this is the major theme that you want to consider when selecting investments over the next few decades.
Inflation has been slowly creeping up in 2025 but not as much as feared, especially with all the tariffs that have been implemented throughout the year. The most recent inflation data point, or Consumer Price Index (CPI) reading showed an annualized inflation rate of 3.0%. That’s pretty close to the long-term average but it doesn’t tell the whole story. So, let’s take a closer look at the underlying numbers.
First, a big component of the CPI reading, rent, has been much softer than usual, helping to keep overall inflation lower than expected. Some of this could be explained by weak demand, particularly from the younger population aged 20 to 24. This group has an unemployment rate of 9.2%, more than double the overall rate.
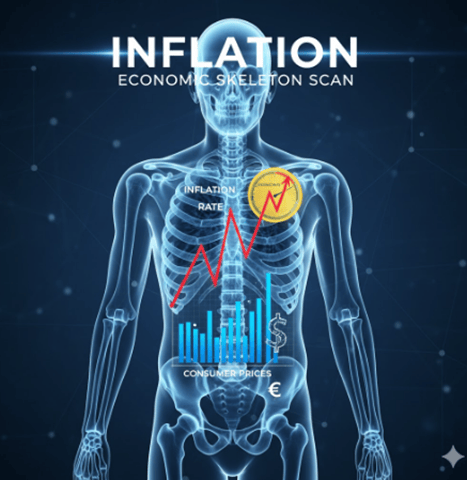
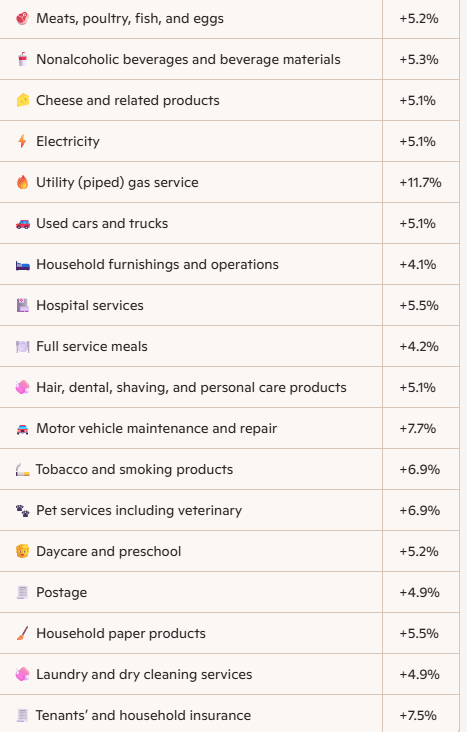
Now, let’s dig deeper into the inflation numbers and take an x-ray of the year-over-year changes in some of our basic consumer goods:
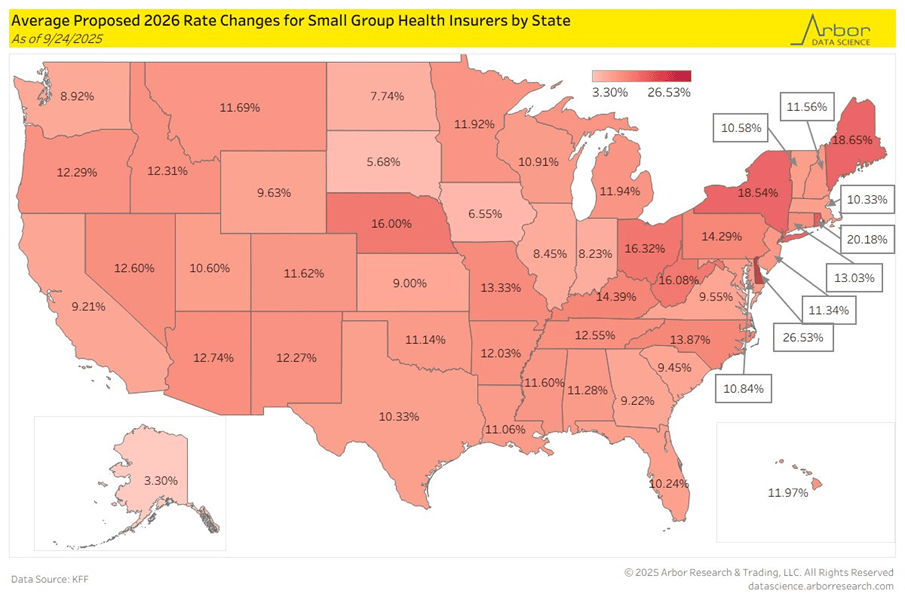
These are much higher rates than the overall inflation rate and does not bode well for the people in the lower income side of the U.S. economy. Plus, it’s about to get a whole lot worse when we see how much our health insurance premiums are going to go up due to the legislation passed this past summer. Check this out:
I’m not sure how much the rate cuts by the Federal Reserve are going to help if companies continue to pass on the tariff costs to the consumer. I am still hopeful that many of the tariffs will be removed, or deemed illegal by the Supreme Court, and that Congress will reinstate the health care premium subsidies for the Affordable Care Act for those that qualify.
Please comment or send an email if you have any questions.
As we approach the end of 2025, it’s important to be aware of key retirement plan deadlines to ensure you maximize your contributions, minimize your taxes, and avoid any penalties.
For retirement plans, the most important year-end tax dates in 2025 revolve around taking required minimum distributions (RMDs) by December 31st and making final contributions for the 2025 tax year.
Key Deadlines
December 31, 2025
2025 Required Minimum Distributions (RMDs): Most retirement account owners aged 73 or older must take their 2025 RMD by this date. This also applies to beneficiaries of inherited IRAs.
401(k) and 403(b) contributions: This is the last day to make employee contributions to employer-sponsored plans for the 2025 tax year.
Roth IRA conversions: The conversion of a traditional IRA to a Roth IRA must be completed by this date to be considered a 2025 transaction.
Qualified Charitable Distributions (QCDs): If you are 70½ or older, a QCD for 2025 must be completed by December 31st.
January 30, 2026
Self-employed SIMPLE IRA contributions: Self-employed individuals must deposit their 2025 salary reduction contributions to a SIMPLE IRA by this date.
April 15, 2026
Individual Retirement Arrangements (IRAs): This is the deadline to make contributions for the 2025 tax year to a traditional or Roth IRA. This date applies even if you file for a tax extension.
Self-employed and C-Corp contributions: The deadline for employer contributions to SEP IRAs and SIMPLE IRAs (as well as solo 401(k)s and other plans) for the 2025 tax year is April 15th, or the extended due date of your federal income tax return.
If any of these situations apply to you, be sure to set reminders for the applicable dates to make the most of your retirement plans.
Please comment or send an email if you have any questions.
Stocks shrugged off tariffs, geopolitical tensions, and even history, in the month of September to continue its momentum higher. A strong performance this past month made it five months in a row of positive returns for the S&P 500 index. Once again, much of the gains can be attributed to big tech and big financial stocks as they appear to be the most resilient to the current economic headwinds.
For the month of September, the S&P 500 rose an impressive 3.52%, well above its average of negative 1.2%. For the year, the index is now up about 14.5%.
The start of Q4 today means that Q3 earnings will start to come out shortly. Investors will be listening to what companies are saying about tariffs, how they will affect their bottom lines, and what they will do to mitigate the damage.
Speaking of tariffs, as they continue to cut into corporate profits, companies are faced with continuing to eat the cost of the tariffs or pass them on to their customers. So far, many companies have only been passing on some of the tariff costs. If they want to maintain their profit margins, they will have to pass more of the costs to us, the consumer, and/or reduce costs in other ways, like laying off workers. Q3 earnings calls should be very interesting.
Historically, October has been a positive month for stocks over the past thirty years. The S&P 500 index has returned about +0.8%.
The major market catalysts (that we know about) for October will be interest rates, Q3 earnings, and jobs numbers. Right now, with the economy remaining strong and a possible interest rate cut this month, we could see another positive month for stocks.
Take a look at the Outlook section below to see what events could move the markets over the short term.
Bond prices were flat to slightly down last month across the debt spectrum despite the Federal Reserve cutting short-term rates by 25 bps. The stronger-than-anticipated economic data that came in at the end of September (e.g., upward revision of Q2 GDP and strong jobs reports) led investors to reassess expectations for more Federal Reserve rate cuts. This pushed Treasury yields higher, particularly in the short-to-intermediate end of the curve, which kept a lid on all bond prices.
Bond investors will be watching the Fed, as always, but also the Supreme Court to see if they deem the tariffs illegal. If they do, the Fed will almost certainly start cutting rates more aggressively since a big catalyst of the current rise in inflation will be removed.
The 10-year US Treasury note yield finished lower in September, settling at 4.16%, lower than the 4.23% yield that it was at the beginning of the month. The 30-year bond yield closed out the month at 4.74%, 19 basis points lower than a month ago.
There is still plenty of uncertainty in the bond market, so it is prudent to invest in bonds that mature sooner rather than later. I like bonds with a 9-to-18-month maturity and plan on holding onto them until they mature.
Savings rates barely moved, even after the Fed rate cut this past September. There is usually a lag between when the Fed cuts rates and when those cuts are reflected in savings rates. Money market rates and savings accounts are averaging only about 0.5% but the best rates can be found at credit unions and online banks. It is worth some of your time looking for the place with the best rates to park your cash.
Account Type
Average Rate
Highest Rate
Money Market Account
0.52%
4.80%
High-Yield Savings Account
0.51%
5.00%
CD Term
Average Rate
Highest Rate
1-Year
1.70%
4.50%
3-Year
1.33%
4.15%
5-Year
1.34%
4.25%
With money market and bank savings deposits still at record highs and the potential for savings rates to head lower, we could start to see cash flowing from savings and CDs to corporate bonds with higher yields as well as dividend-paying stocks. This is a trend to look for over the next several months.
For now, CDs and MMAs are still a great place to put your cash and your emergency funds. Knowing this, it makes sense in most situations to put cash that you don’t immediately need into CDs with up to 2-year maturities. For emergency cash, stick to high yielding money market and savings accounts, of which the best are yielding about 5.0%. As always, keep the total under $250,000 per person at any one bank to ensure you are fully covered by the FDIC.
Mortgage rates continued to drift lower in September as hopes of additional interest rate cuts by the Federal Reserve increased. Rates are now at 12-month lows. The decline has been largely attributed to weaker-than-expected economic data, particularly in the labor market, which has increased the chances of another interest rate cut by the Federal Reserve, although recent data has curbed some of those expectations.
The 30-year fixed rate finished the month at 6.30%, about 25 bps lower than last month and now just below the narrow range of 6.5% and 7% that it has been in since October of last year.
Here is a look at the one-year chart of the 15- and 30-year mortgage rates from Freddie Mac.
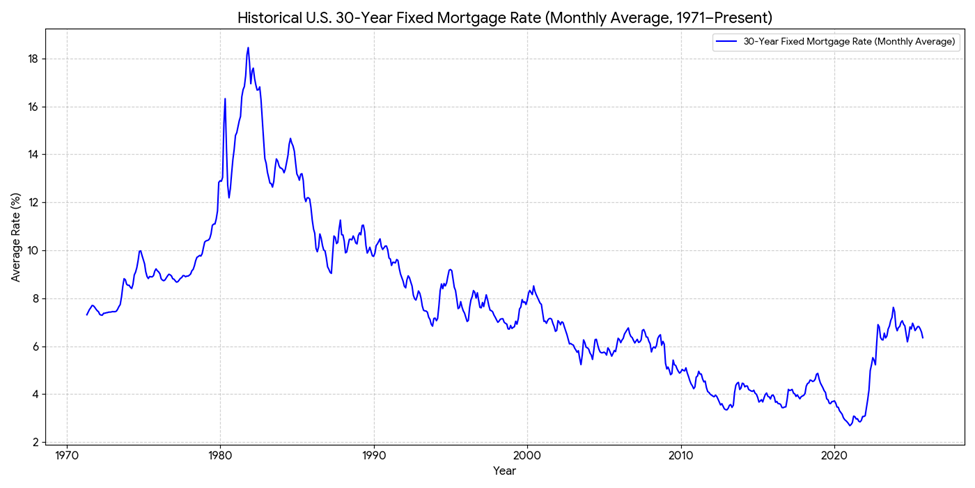
Just for reference, here’s a simple chart of the 30-year mortgage rate over the past 54 years. The average rate for that period is about 7.70%.
Oil prices fluctuated quite a bit in September with geopolitical tensions rising around the globe, especially between Europe and Russia as well as the middle east. Eventually, oil continued its downtrend mainly due to the weakening dollar and a global supply glut.
For the month, the price for a barrel of oil closed at $62.44, down about $1.50 from the beginning of September. For the year, it’s down about 13.00%. Looking ahead, there are still more catalysts that could move prices lower than higher, such as increased production across the globe, but that can change quickly. For now, prices going lower is good thing, in my opinion, but obviously not good for companies and their workers in the oil industry.
Here’s a look at the one-year chart for U.S. oil:
Gasoline prices had a small drop in September as they started to catch up to the front-running decline in oil prices. Regular unleaded gasoline is now averaging $3.15 per gallon, down 4 cents from last month. We should see prices moving lower, especially now that the summer driving season has ended. Oklahoma took the lead for the cheapest gas, checking in at $2.63 a gallon. California still has the most expensive gasoline at $4.65 per gallon. FYI, a year ago, we were paying $3.22.
Check out the prices at the pump in your area: AAA Gas Prices.
Outlook
Events on the horizon that could move the markets in the near term:
Fed & Inflation: As expected, the Federal Open Market Committee (FOMC) delivered its first interest rate cut of the year in September 2025, lowering the benchmark federal funds rate by 0.25 percentage points to a new target range of 4% to 4.25%. They made this move to provide support to the labor market. Of course, they are also monitoring inflation and aim to keep that number from increasing more than it already has this year.
The economy continues to defy the odds as the data shows that consumer spending is still strong despite prices increasing. This may cause the Fed to put rate cuts on the back burner for the rest of the year. The employment numbers coming up at the end of this week should give the Fed a clearer picture of which way to go with rates. Any cuts to interest rates could give stocks and bonds the fuel needed for another leg up going into the end of the year.
Trump Administration Policies: New tariffs were piled onto the already historic number of tariffs put in place so far this year. Some of the latest ones include 100% tariffs on pharmaceutical products, 50% on kitchen cabinets and bathroom vanities, and 30% on upholstered furniture. If you want to dig down into the details, here is a good place to start: Trump’s trade war timeline 2.0: An up-to-date guide. As I have said many times before, carpet-bombing our economy with tariffs will only hurt our economy, since we, US companies and its citizens, are paying these import taxes.
I believe that the administration has implemented certain trade and immigration policies to accomplish the following: reduce immigration, bring back manufacturing to the U.S., and reduce inflation. The problem is that achieving all three of these goals simultaneously is nearly impossible, especially with their haphazard way of implementing and removing policies almost daily. It is a strategy caught in a tug-of-war. For instance, Immigration policy is hurting manufacturing and tariffs are raising prices, not lowering them. Tariffs are also hurting the labor market. If we continue down this path, these policies will continue to create uncertainty, erode trust among businesses, and make the U.S. a less attractive place to invest.
That said, many of these tariffs can be ruled illegal by the courts as early as November of this year, so stock market volatility will be on edge for the next few months at least.
The Federal Open Market Committee (FOMC) just cut its benchmark interest rate, known as the federal funds rate, by a quarter-point (0.25%), bringing the target range to between 4.00% and 4.25%.
This can be considered a continuation of an easing cycle (period of lowering interest rates) that started back in September of 2024 but had been paused at the beginning of this year due to the uncertainty of how the new administration’s trade and immigration policies were going to affect prices and unemployment.
Since then, the data has shown that inflation has picked up mainly due to tariffs but not as much as expected. Our businesses are not passing on the full cost of the tariffs to their customers….for now. However, the labor market has weakened significantly in that same time span. Typically, when inflation picks up, raising rates helps cool it down. When unemployment increases, lowering rates is the standard response to help support employment. This dilemma of rising inflation and rising unemployment, aka stagflation, put the FOMC in a quandary for most of 2025.
Ultimately, at their last meeting, the FOMC chose to prioritize the battle against rising unemployment and restarted their easing cycle by cutting rates.
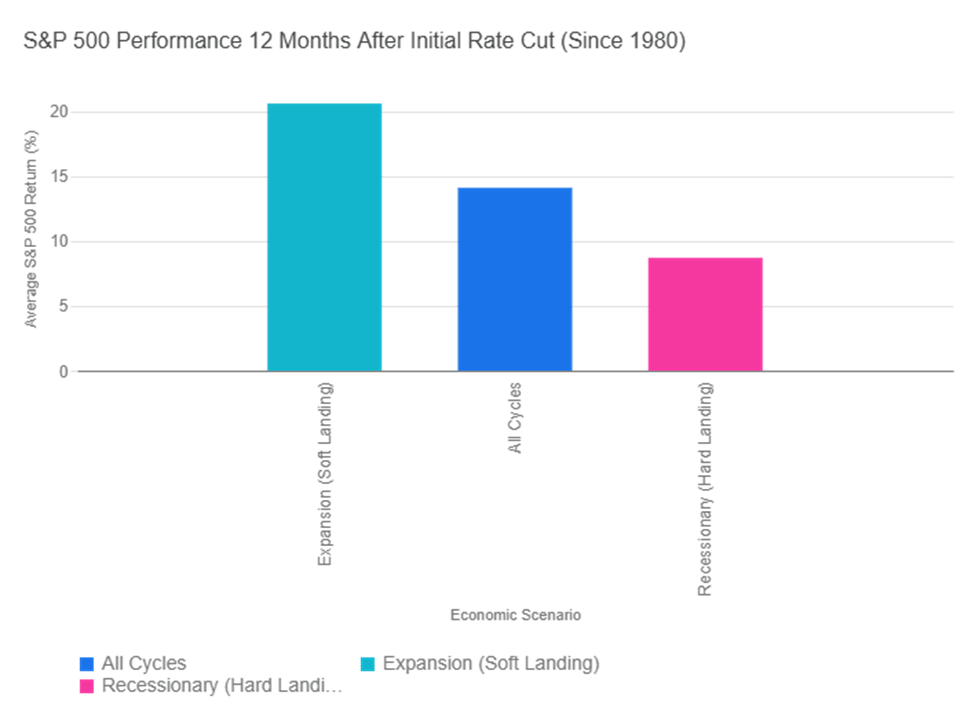
So, how will this affect the stock market? Historically, the market has performed well when interest rates are cut. The graph below illustrates the historical performance of the S&P 500 Index in the 12 months following the Federal Reserve’s first interest rate cut in a new cycle (since 1980). The returns vary significantly based on the underlying economic conditions, but they have always been good for stocks.
If we consider the start of the easing cycle to be September of 2024, we are now at a full year following the first rate cut. Interestingly enough, the S&P 500 has returned about 15.3% for that period, which coincides with its historical returns, as seen on the graph.
Does that mean we are due for a pullback? Not necessarily. If we continue on the trajectory of the soft landing that we were headed for at the beginning of this year, stock prices could continue to move higher. But, if inflation persists and unemployment continues to rise, we could be heading for a downturn.
The S&P 500 is also approaching a significant milestone: 3 years of consecutive double-digit returns. Stringing together three or more years of positive double-digit returns is rare but it happens.
Period (Start Year)
Length of Streak (Years)
Early 1930s (e.g., 1933–1936)
4
World War II / Post-War (e.g., 1942–1945)
4
Post-War Boom (e.g., 1949–1955)
7
Mid-1960s (e.g., 1963–1967)
5
1990s Tech Boom (1995–1999)
5
Post-Financial Crisis (e.g., 2012–2014)
3
Post-Pandemic Era (2019–2021)
3
We will see if stocks can make history as we head into the home stretch of 2025.
Please comment or send an email if you have any questions.