Tax Loss Harvesting (TLH) – What It Is and When To Do It

Tax loss harvesting (TLH) is a term used in the financial industry to describe strategies employed by investors to minimize their taxes due on any realized gains of investment sales for the year. Realized gains occur when you sell an investment at a higher price than when you bought it.

Before reading any further, please note that TLH only applies to investments in taxable accounts, not retirement accounts or any other tax-deferred accounts. That said, let’s take a look at what this harvesting is all about.

I think an example is the best way to understand how this strategy works:

Suppose you sold shares of XYZ earlier this year for a $10,000 profit, also known as a realized gain. Let’s say that you also have a stinker, ABC, in your account that is down $15,000 from when you bought it. You can sell ABC and now have a realized loss of $15,000. This will offset the $10,000 realized gain. It will also offset up to $5,000 of any other realized gains that you have this year. If you don’t have any other gains, you can apply $3,000 to reduce your taxable income and the remaining $2,000 of losses can be carried forward to next year.

In this example, you were able to avoid paying taxes on that gain of $10,000 by using the TLH strategy.

Most investors prefer to do this strategy towards the end of the year, but you can do it any time during the calendar year. I like to do it for my clients during the slow summer months because that is one less thing to worry about during crunch time in December.

I also want to share with you some do’s and don’ts when you are considering TLH:

  1. Don’t sell losers just to offset gains. Make sure that the investment no longer fits with your investment objectives.
  2. Considering #1 above, do maximize your tax savings by using TLH when you have short term capital gains, since they are taxed at your ordinary income tax rate, which may be much higher than the long-term capital gain tax rate.
  3. Do sell losers if they no longer fit your strategy, even if you don’t have any gains to offset. You can always carry the losses forward to use in later years.
  4. Don’t buy the same investment within 30 days before or after the TLH sale. If you do, this will disallow the loss.
  5. Don’t ever consider any tax strategy, such as TLH, as the sole reason to buy or sell any investment. They should be incorporated into your investment decisions as part of your overall game plan.

Please comment or send an email if you have any questions.

Joe Baker, CFP®
Baker Asset Management, LLC
joebaker@bakerassetmanagement.com

Check Out The New Retirement Plan Contribution Limits for 2025

The IRS recently posted the retirement plan contribution limits for 2025. Here is a table of the new limits as well as the limits from 32024 so you can see how much they have changed:

20252024
 401k, 403b, 457 plans
Employee Contributions:$23,500$23,000
Annual Contribution Limit (employer plus employee contributions)$70,000$69,000
Catch-Up Contributions$7,500$7,500
Age 60-63 Catch-Up Contributions$11,250—
SIMPLE IRA/401k plans
Employee Contribution Limit$16,500$16,000
Catch-Up Contributions$3,500$3,500
Age 60-63 Catch-Up Contributions$5,250—
IRA Contributions$7,000$7,000
Catch-Up IRA Contributions$1,000$1,000

The changes are typical and not surprising except for a new catch-up amount that is allowed for those of us who reach the age of 60, 61, 62, or 63. It is called enhanced catch-up or super catch-up. Whatever you call it, it means you can put more money into your retirement plan in 2025.

For example, if you turn 60 in 2025 and participate in a 401k plan, you can contribute $23,500 plus $11,250 for a total of $34,750.

Please comment or send an email if you have any questions.

Joe Baker, CFP®

Baker Asset Management, LLC

joebaker@bakerassemanagement.com

U.S. Balance Sheets Are Looking Good

I was looking at some data last week to see if the U.S. still had a good chance of avoiding a recession and came upon some interesting charts that I wanted to share with you.

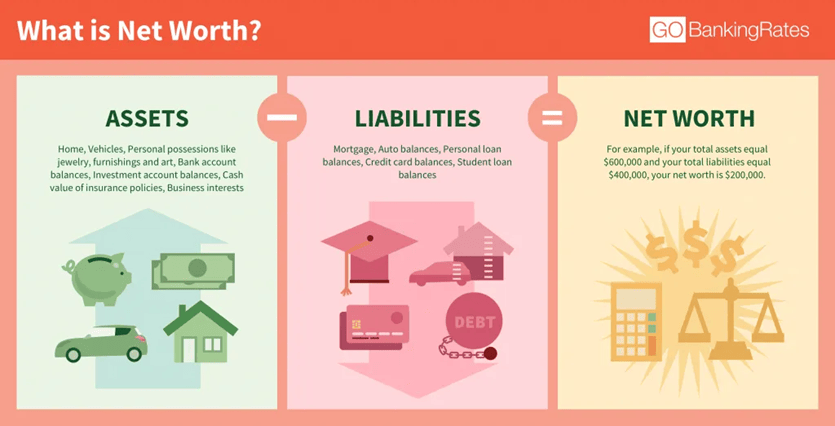
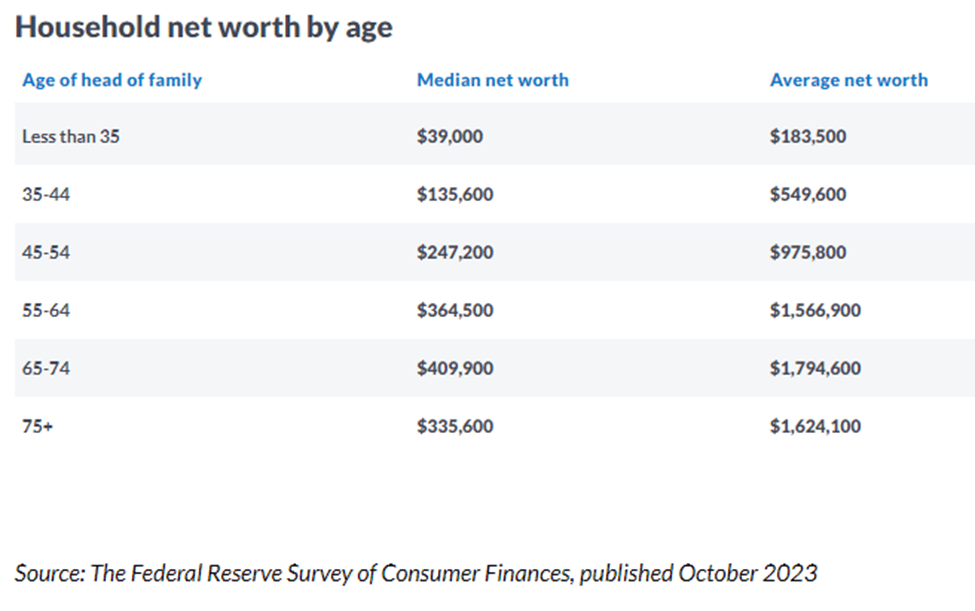
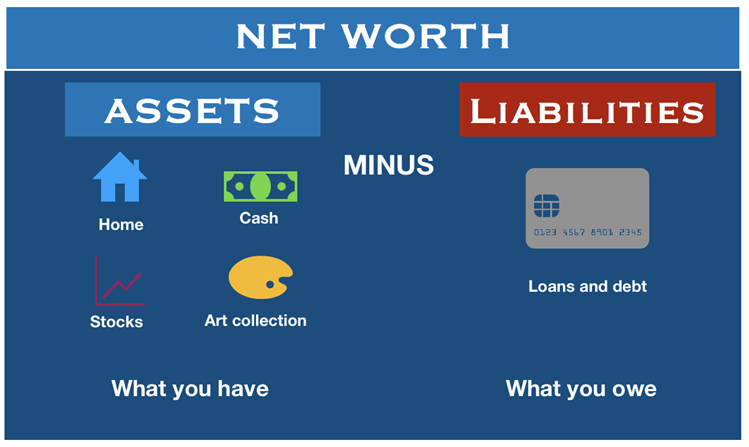
The first chart takes a look at the average and median net worth of U.S. citizens categorized by age as of 2023. Remember, net worth is just your assets minus your liabilities. The illustration above gives a great example of how net worth is calculated.

You can see there is quite a difference between average and median values. That’s because there are a bunch of households that are extremely wealthy and that will skew the average higher. The more realistic values are the ones in the Median Net Worth column. These amounts are calculated simply by locating the middle value of all the net worth values in that age group. That said, both show that the net worth of U.S. households is the highest that it’s ever been.

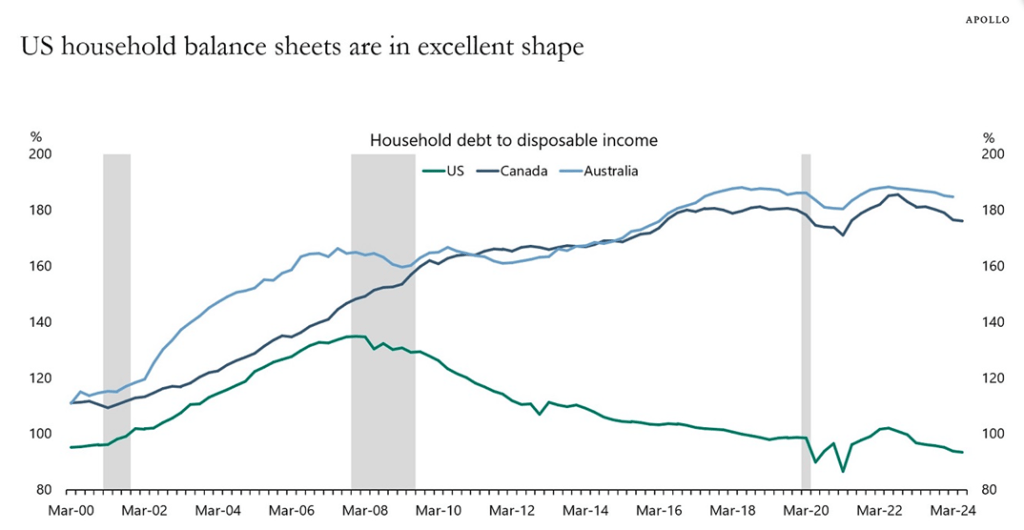
This next chart compares our household debt as a percentage of disposable income to our buddies in Canada and Australia. The lower the percentage, the better:

As you can see, we are below 100% which means that we have enough disposable income to pay off our debts. Also, we are in much better shape than our Canadian and Australian friends.

This is good news any way you slice it. The combination of rising asset values (homes, stocks, etc.), decent job growth, solid wage growth, and the Fed cutting interest rates, almost ensures that there is no recession on the horizon.

Please comment or send an email if you have any questions.

Joe Baker, CFP®

Baker Asset Management, LLC

joebaker@bakerassemanagement.com

How to Get Paid by the IRS to Save for Retirement

Do you want to get paid by the IRS for contributing to your IRA or other retirement plans? Well, you can because they will pay you to save for retirement.

There is a little-known tax rule that has been around since 2002 called the Retirement Savings Contributions Credit (Saver’s Credit). This tax credit essentially pays you to put money into your IRA, Roth IRA, 401k, TSA, and most other retirement plans. Here’s a quick summary of how it works:

Eligibility

You are eligible for the credit if you meet certain criteria:

  • Income limits: Your adjusted gross income (AGI) must be below a certain threshold. The exact threshold varies depending on your filing status and whether you are a qualifying individual.
  • Contributions: You must make qualifying contributions to a traditional or Roth IRA, or to an eligible employer-sponsored retirement plan.
  • Age: You must be at least 18 years old and not a full-time student.

Credit Amount

As with most tax credits, the amount is based on your adjusted gross income (AGI) in the year that you contribute. The maximum amount of the credit is 50% of the amount that you contribute to your retirement plan. The maximum contribution amount that can qualify for the credit is $2,000, making the maximum credit $1,000. Here is an example:

Jill, who works at a retail store, is married and earned $41,000 in 2024. Jill’s spouse was unemployed in 2024 and didn’t have any earnings. Jill contributed $2,000 to her IRA for 2024. After deducting her IRA contribution, the adjusted gross income shown on her joint return is $39,000. Jill may claim a 50% credit of $1,000 for her $2,000 IRA contribution on her 2024 tax return.

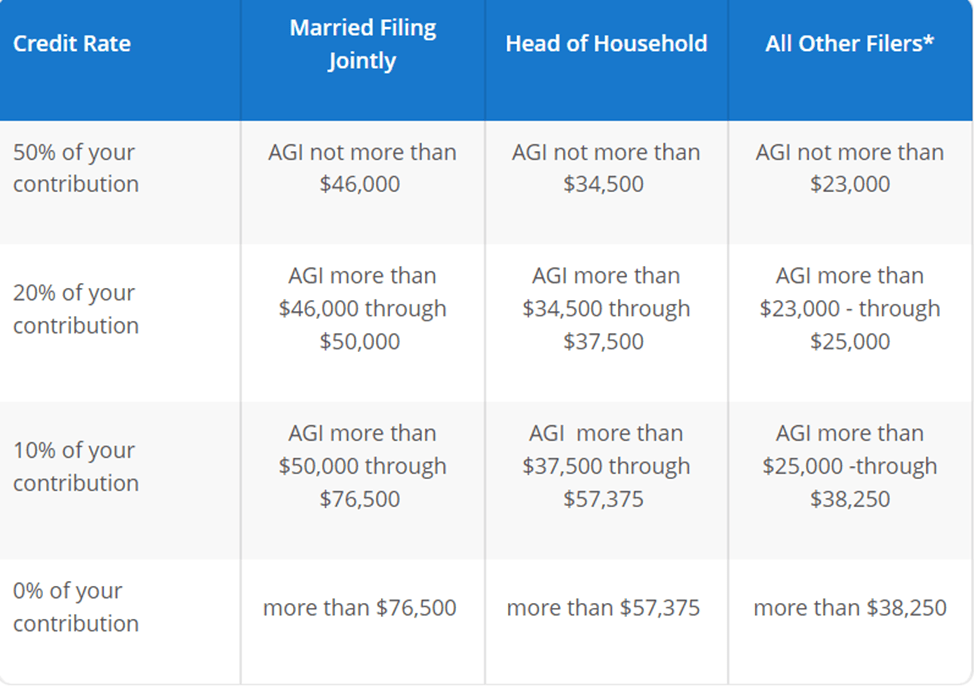
The following table shows how much of a credit that you are eligible for:

2024 Saver’s Credit Rates and Filing Status

For those that are eligible, it is like getting a match from the government on your contribution. Every little bit helps!

Please comment or send an email if you have any questions.

Joe Baker, CFP®

Baker Asset Management, LLC

joebaker@bakerassemanagement.com

Sell In May And Go Away?

Sell in May and go away is an old Wall Street saying that is the basis for a market-timing investment strategy which calls for you to sell your stock holdings right before summer and buy them back in late fall, or right before Memorial Day and right after Halloween.

Historically, the S&P 500 has performed better during the winter months than in the summer months. So, there is evidence that this strategy could work, but we are really Monday-morning quarterbacking here. In reality, you have to be very good at timing the market not once, but twice every year! You have to pick when to sell and then you have to pick when to buy back in. Plus, you have to consider your holdings’ short-term versus long-term gains and losses as well as the associated tax ramifications.

I don’t know of anyone or any firm that has been able to do this successfully for an extended period of time.

So, whenever I hear the “Sell in May and go away” adage, I like to think of another old Wall Street saying: Time in the market, not timing the market. This means relying on a strategy where you don’t try to guess when the market is at its lowest or highest point. Instead, you invest knowing that your timing is probably going to be off, but that eventually, investing in great companies with strong fundamentals matters more than the timing.

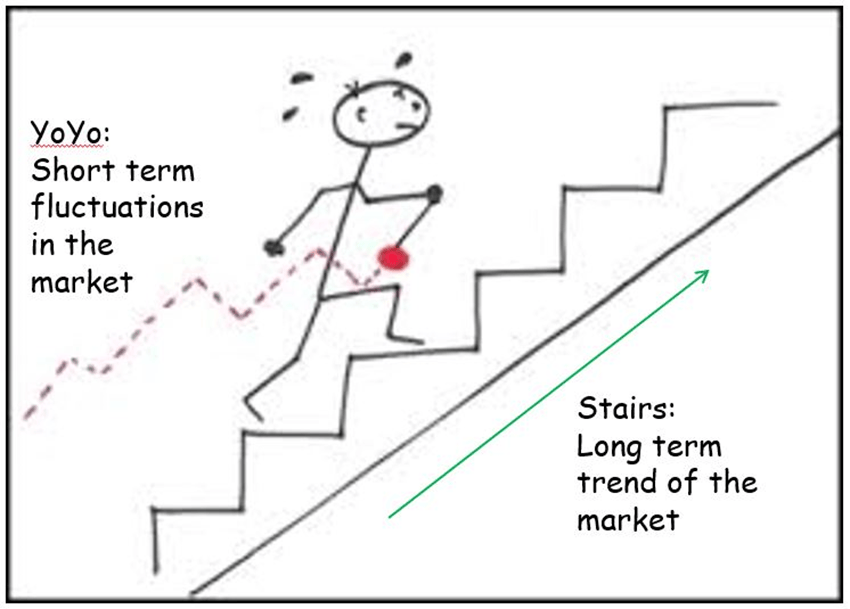
Now is when I roll out my favorite illustration to show why time in the market is better than timing the market for investors.

Picture the movement of the yo-yo as the short-term fluctuations of the stock market and the guy walking up the stairs as the long-term trend of the market. The market has its ups and downs, but over time, has consistently moved higher. This is a simple, but effective, way to illustrate why time in the market is better than timing the market.

Please comment or send an email if you have any questions. Have a great Memorial Day weekend!

Joe Baker, CFP®

Baker Asset Management, LLC

joebaker@bakerassemanagement.com

Make Sure You Are Doing This With Your Emergency Fund

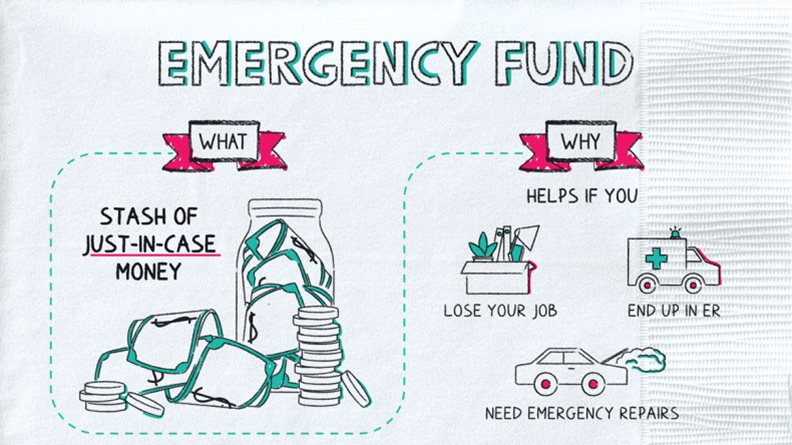
In the current interest rate environment, it is a good idea to shop around for the best savings rates when deciding where to park your emergency funds. As the graphic above suggests, an emergency fund is an account that contains cash that is liquid (easy and quick to access) so that it can be used if something unexpected happens and calls for some money quickly.

An emergency fund should be at the top of the list regarding the order that you should fund your financial accounts. Amazingly, most Americans say that they wouldn’t be able to pay off a $1,000 emergency expense if it ever came up. Almost as amazing is for those fortunate enough to have an adequate emergency fund, about 70% of them keep their emergency fund in their regular checking account, earning zero percent interest or close to it.

Yes, it does take a little effort to find a savings, checking, or money market account that pays a respectable interest rate, but it can be well worth it. There are money market account (MMA) rates near 5.5% right now, far better than the current average savings account yield of 0.08%. For example, $30,000 in an MMA yielding 5% will earn $1,500 in interest annually, versus $24 in the average savings account. That’s not bad for doing a little leg work.

A quick search on Google will give you a ton of options for both online and brick-and-mortar bank rates. Here are two that I like to use:

It’s important to consider other factors besides just the interest rate when choosing a money market account, such as minimum balance requirements, monthly fees, and ATM access.

Please comment or send an email if you have any questions. Thanks!

Joe Baker, CFP®

Baker Asset Management, LLC

joebaker@bakerassemanagement.com

Your Balance Sheet Is Looking Good!

Just like for a company, the balance sheet is one of the most important financial statements that a household can use to monitor its financial health. Put simply, it is a snapshot of your net worth, which is just your assets (stuff you own like your home, stocks, retirement plans, etc.) minus your liabilities (stuff you owe like mortgages, credit card debt, student loans, etc.).

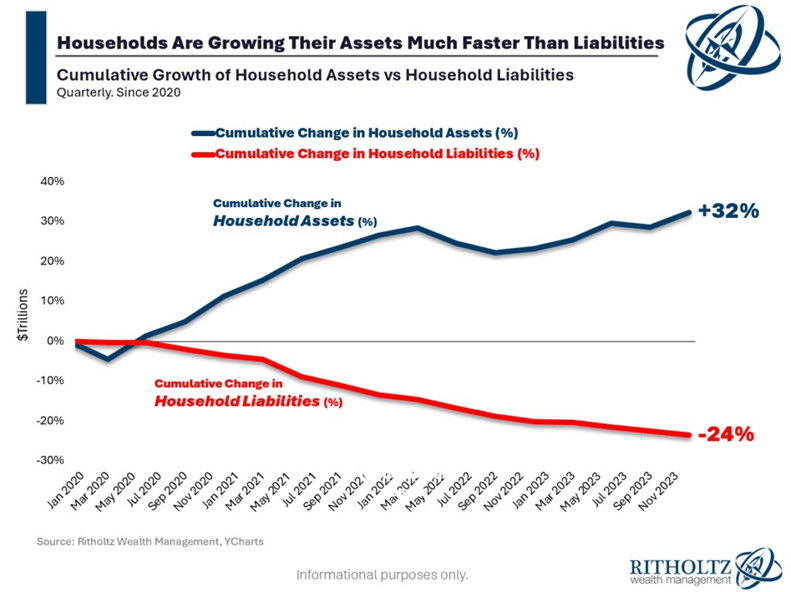
Recently, households in the U.S. have been getting healthier financially than at almost any other time in history. In fact, if you look at homeowners, about 39% have no mortgage and roughly 85% of homeowners that do have a mortgage, their mortgage rate is under 3.5%. When you couple this low amount of debt with all-time highs in the stock market, historically low unemployment, and decent wage growth, household net worth has never looked better.

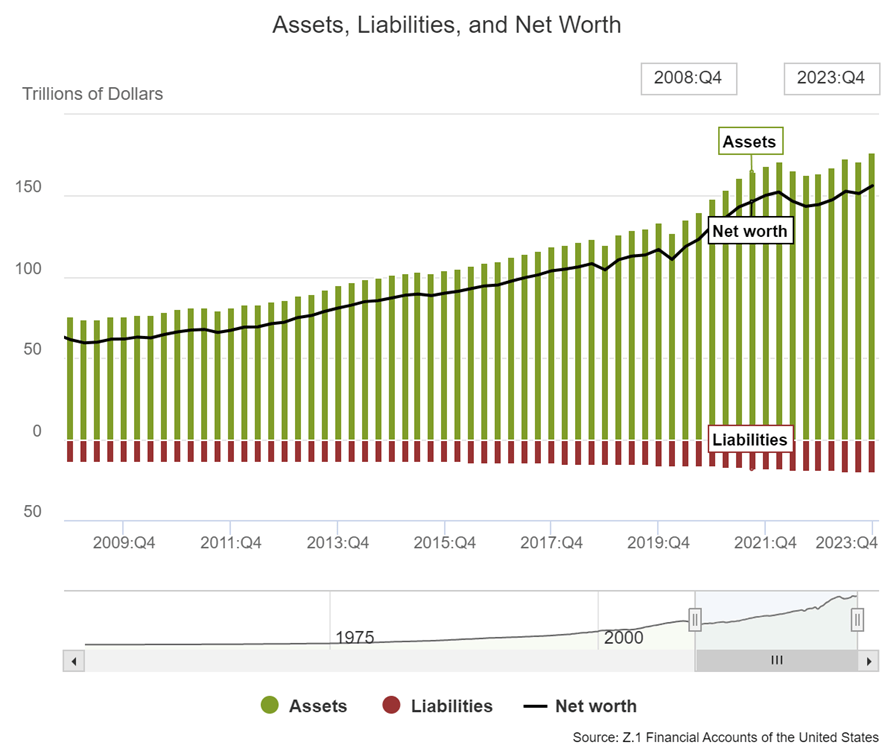
Here are a few charts that illustrate this topic more clearly:

In the chart above, you can see that since the great financial crisis, household net worth has consistently grown over the last fifteen years.

In this illustration, a more recent time period (from the pandemic in 2020 until the end of last year, 2023) shows the significant growth of household assets over the last three years while liabilities have dropped quite a bit.

Of course, the economic picture isn’t as rosy as it appears. There are some under currents to consider despite this encouraging data:

  • There is still significant wealth inequality. The top 1% hold a much larger share of the total wealth compared to the bottom 50% [Pew Research Center]. This falls under the old saying that “The rich get richer”.
  • Stubborn inflation could deplete some of the assets of households as they try to continue their same lifestyle without adjusting their spending habits for inflation.

For most households, things are looking pretty good, financially. If we can win the battle with inflation, we’ll see interest rates head lower, which will benefit the economy even more.

Please comment or send an email if you have any questions. Thanks!

Joe Baker, CFP®

Baker Asset Management, LLC

joebaker@bakerassemanagement.com