Monthly Update – May 2023

Fun Facts about May

  • Birthstone: Emerald
  • Flower: Lily of the Valley
  • Zodiac signs: Taurus and Gemini
  • The month of May was named for the Greek goddess Maia. She was the goddess of fertility.
  • It is the third and last full month of the season of spring.
  • May in the Northern Hemisphere is similar to November in the Southern Hemisphere.
  • The Kentucky Derby, the world’s most famous horse race, is held on the first Saturday of May. This year it is on May 6th.
  • The Indianapolis 500 car race is on Sunday, May 28th this year.
  • Memorial Day is on Monday, May 29th. All stock and bond markets in the U.S. are closed.

Stocks headed higher once again in a choppy market for the month of April. The banking crisis seems to have been quarantined to just a few banks, which is great news (except for their shareholders). Economic data is showing solid signs that inflation is dying down and that the Fed should be more worried about pushing the U.S. into a recession. Notwithstanding, earnings for Q1 are coming in pretty strong, especially for the big technology companies.

The S&P 500 rose 1.6% during the month of April and is now up 8.8% for the year with one-third of 2023 already in the books.

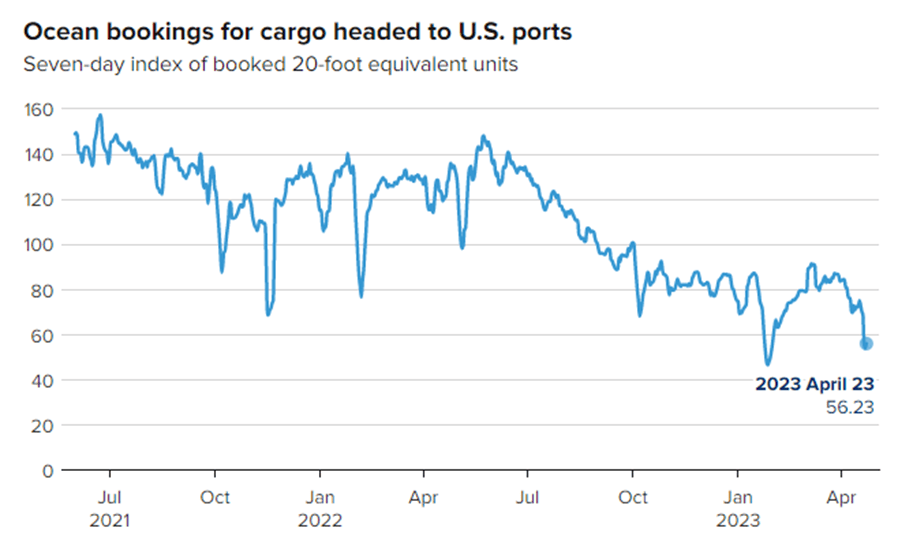
There are still a bunch of earnings coming out over the next few weeks that could shift market sentiment either way. Also, data from the freight industry are showing signs of an economic slowdown here in the states. For instance, the following chart shows the amount of freight scheduled to be shipped to the U.S. After peaking in July 2021, it has trended downward over the past two years. That said, it looks like it may be bottoming out and should head back up as companies prep for the holiday season.
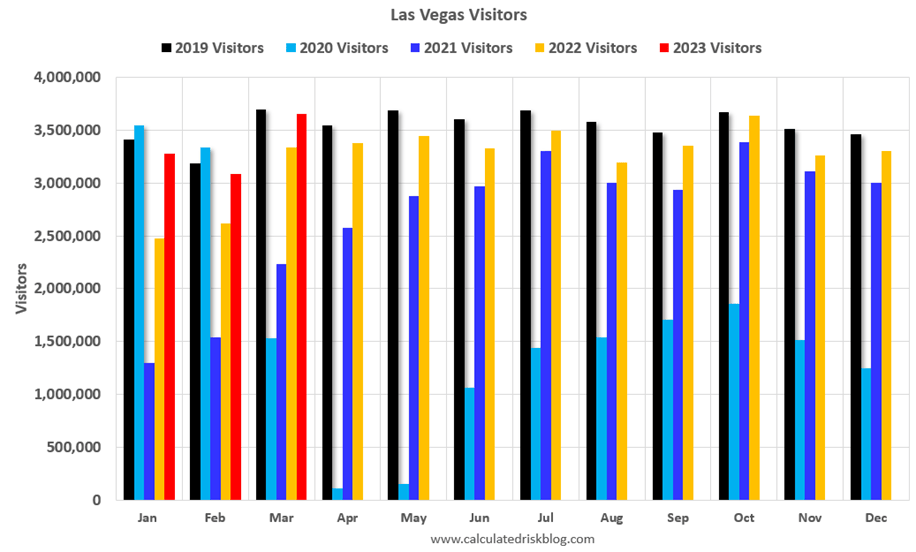
That is not the case in the travel/leisure and restaurant industries. People may not be buying stuff, but they are buying experiences. One of the best proxies to monitor these industries is to check out how many people are visiting Las Vegas. Looking at the following chart shows that we are almost back up to the pre-pandemic visitor levels.
Finally, the Federal Reserve will be meeting this week after a one-month hiatus, which should make for a very interesting week for the markets.

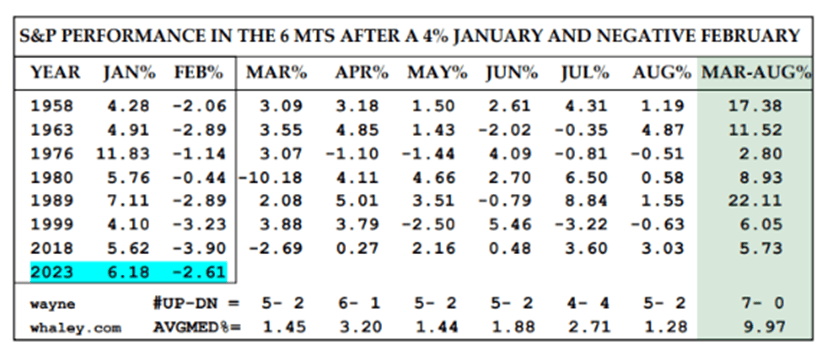
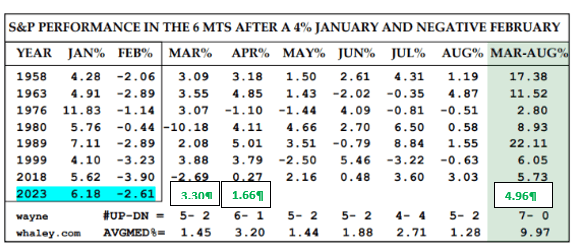
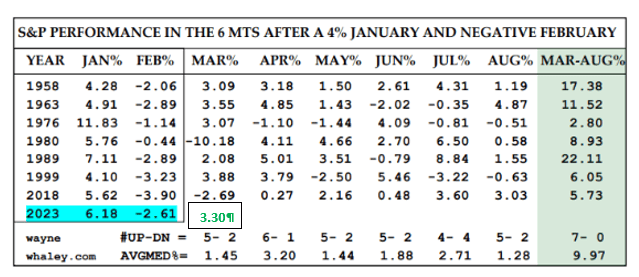
I’m leaving this table in the update through August to see if history repeats itself. There have been seven instances where a January with a 4% or higher return was followed by a negative February. 2023 is now the eighth. For each one of these years, the following six months had an average gain of almost 10%. Will 2023 keep this undefeated streak going?
Take a look at the Outlook section below to see what events could move the markets over the short term.

Bond prices moved up modestly in April, making it two months in a row of higher prices and lower yields. There is still a lot of uncertainty in the bond markets but most of that is due to the upcoming Federal Reserve meeting this week. The data is indicating that there is an economic slowdown ahead for the U.S. The Fed is seeing that and should put the brakes on any more rate increases after an expected 25 bps bump at their meeting this week. Also, another bank failure is close to happening (First Republic Bank) which always sends jitters through the bond markets, but this should be it for those.

The 10-year US Treasury note yield headed lower once again in April, closing the month at 3.43%. The 30-year bond yield moved just a touch higher, closing the month at 3.68%. These yields are still well below the short-term treasuries. For example, the 6-month T-bill is currently yielding 5.03%, confirming a strong inversion of the yield curve and one of the best indicators of an impending recession.

Bond buyers should continue to focus on bonds with short-term maturities. I would keep maturities under two years and just plan on holding these bonds to maturity. That way, you won’t have to worry about selling at a discount if interest rates head higher. By the way, this is what happened to the banks that recently failed: owned too many bonds with long-term maturities that they had to sell at a loss to cover withdrawals.

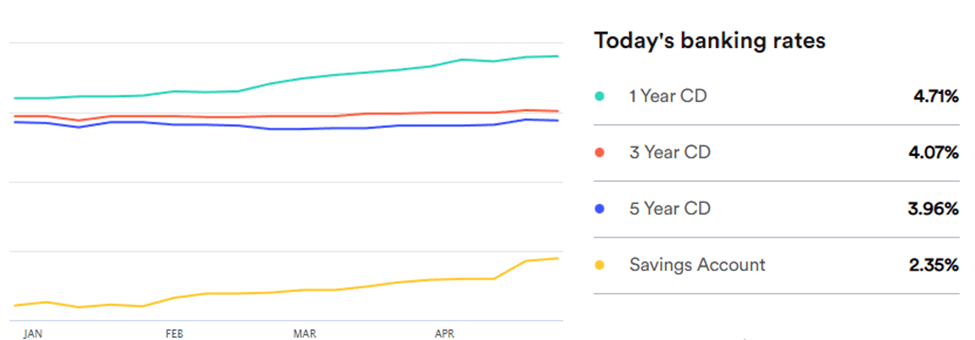
Savings rates moved higher once again in April. These rates have been getting more competitive as savers are moving their money to institutions with better interest rates. Traditional bank accounts are also having to sweeten their rates for depositors because many are moving their savings to brokerage money market accounts in the wake of the recent bank failures. Good stuff for risk averse investors and for our emergency reserves accounts.

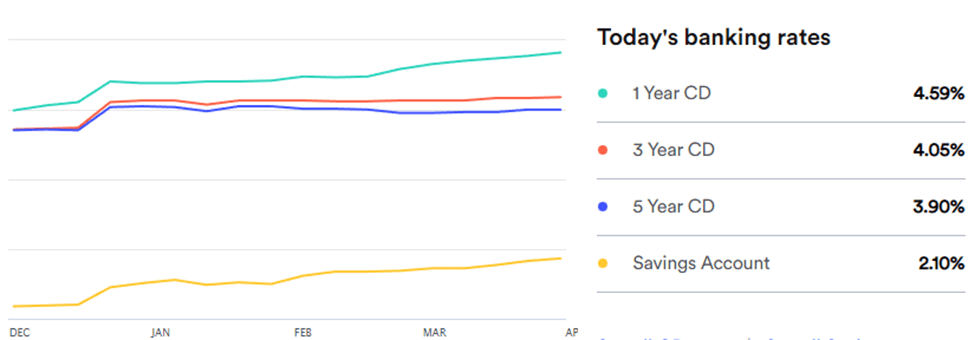
Currently, the average savings account is paying 2.35%, up from 2.10% last month. There are some banks that are paying well over 4% right now and are worth taking the time to research.

The 1-year CD interest rate is now averaging 4.71%, up from 4.59% last month. The 5-year CD rate is currently at 3.96%, up from 3.90% last month. These rates are still inverted, just like the yield curve, meaning they are paying a higher rate to borrow your money for a shorter time period, which isn’t normal. These inversions typically do not last longer than six months. That said, if you’re looking for a place to park your savings or emergency spending money, just buy short-term CDs, 1 year or less, and reevaluate when they mature. Keep the total under $250,000 per person at any one bank to ensure you are fully covered by the FDIC. CDs are becoming a nice alternative for risk-averse investors and have drawn money away from stocks because of these relatively high rates that carry virtually no risk. I wouldn’t mind if these rates stayed this high but do not want to see them heading up much further.
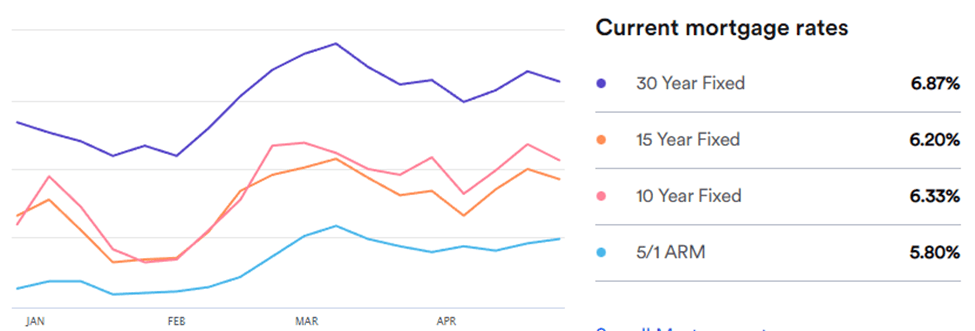
Mortgage rates remained relatively flat throughout April as we await the first Federal Reserve meeting since March (see chart below). Currently, the 30-year rate sits at 6.87%, down from 6.88% a month ago. It is an unusual environment, currently. There is very little inventory out there of both new homes and of existing homes for sale. This reduces mortgage demand. But, as soon as rates drop a little, you have an uptick in demand and multiple offers on all homes for sale. Still seems like a buyers’ market in most locations, especially the southern U.S.

These rates are still the highest they have been in about fifteen years but that might not last too much longer. The fixed income markets are predicting a recession based on the inverted yield curve. If it comes to fruition, a recession would force interest rates down, including mortgage rates.
I have had to field some questions recently on the possibility of another major housing collapse like we had during the Great Financial Crisis in 2008-2009. I don’t expect anything like that in the foreseeable future. For perspective, check out the chart below:
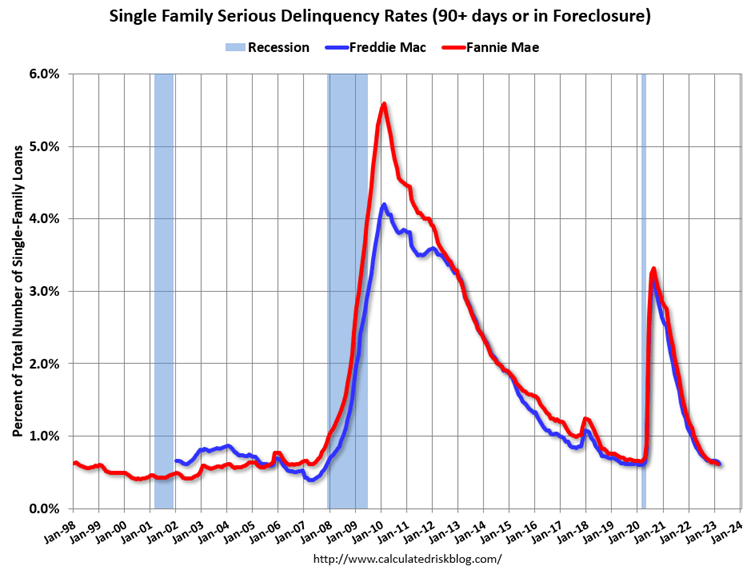
Homeowners have the most equity in their homes since they started tracking it. Currently, the delinquency rate for mortgages is at 0.62%. As you can see in the chart, the rate was much higher during the GFC and during the pandemic. The current delinquency rate will most likely worsen if layoffs continue and those with variable rate mortgages see their rates rise significantly. However, the housing market will be fine.

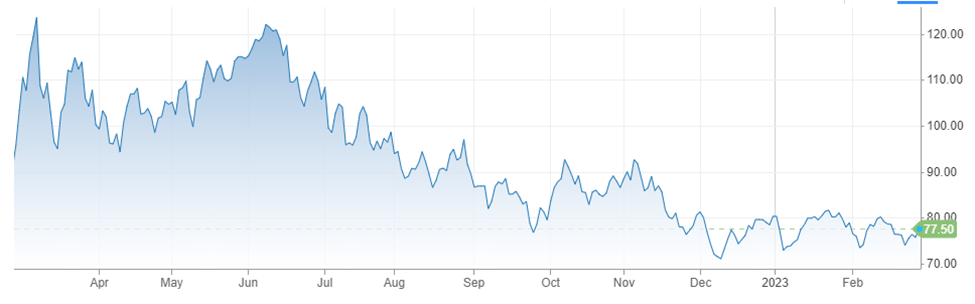
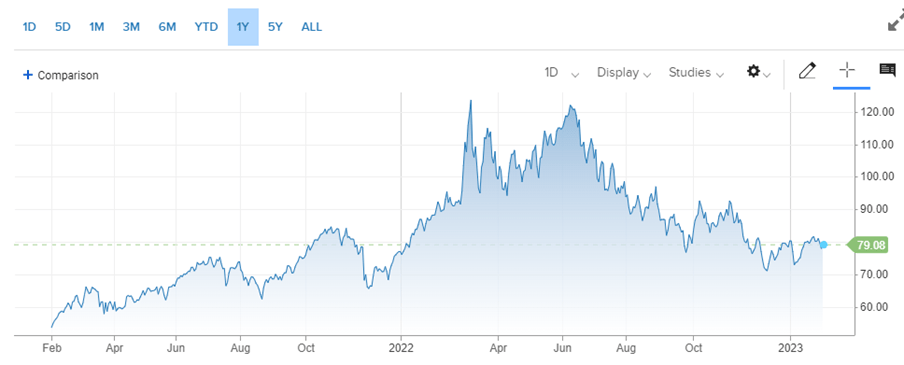
Oil prices crept up in April as demand has started to pick up, coupled with lower production worldwide. dropped once again in March as lighter demand continued across the globe. For the month, the price for a barrel of oil settled at $76.63, about $1.09 higher than it was at the beginning of March.

The year-to-date chart for the price of oil looks like a fun roller coaster ride!
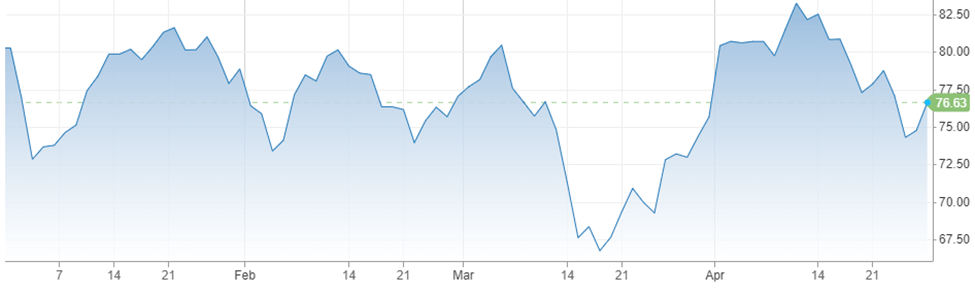
Still hoping to see prices drop into the $55 to $70 range. We may get there if the economy continues to slow.

Gasoline prices moved higher in April once again as better weather sparked an uptick in recreational driving. Regular unleaded gasoline is now averaging $3.62 per gallon, up $0.12 from last month. Mississippi has the cheapest gas for the second month in a row, at $3.10 a gallon. California has the most expensive gasoline at $4.87 per gallon. FYI, a year ago, we were paying $4.16.
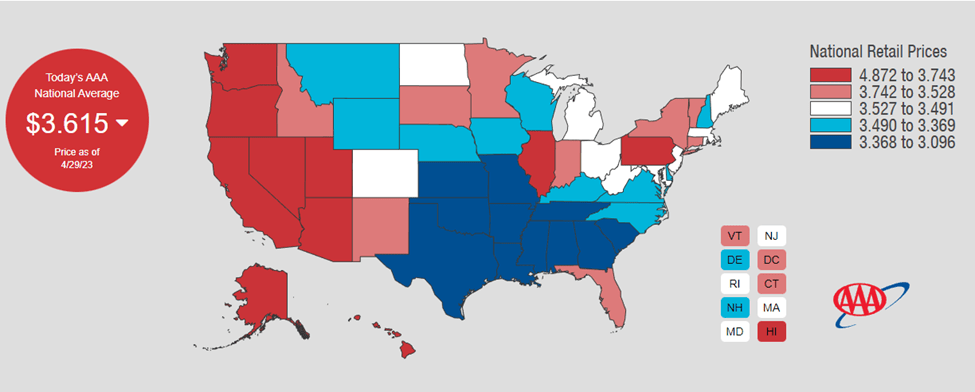
Check out the prices at the pump in your area: AAA Gas Prices.

Outlook

Events on the horizon that could move the markets in the near term:

  • Fed & Inflation: It seems like every Federal Reserve meeting is the most important meeting in recent history. Well, we have one in a few days, and it probably meets this criteria once again. The consensus is that they will raise rates another 25 basis points and then pause to evaluate the data as these rate increases work themselves into the economy. As stated throughout this update, they are having their desired effect. Any deviation from the consensus outlook and we could see some big moves in the stock and bond markets.

Joe Baker, CFP®

Baker Asset Management, LLC

joebaker@bakerassetmanagement.com
Important Tax Deadlines for 2023

I just wanted to post some important tax deadlines for 2023 that recently changed , mostly due to natural disasters.

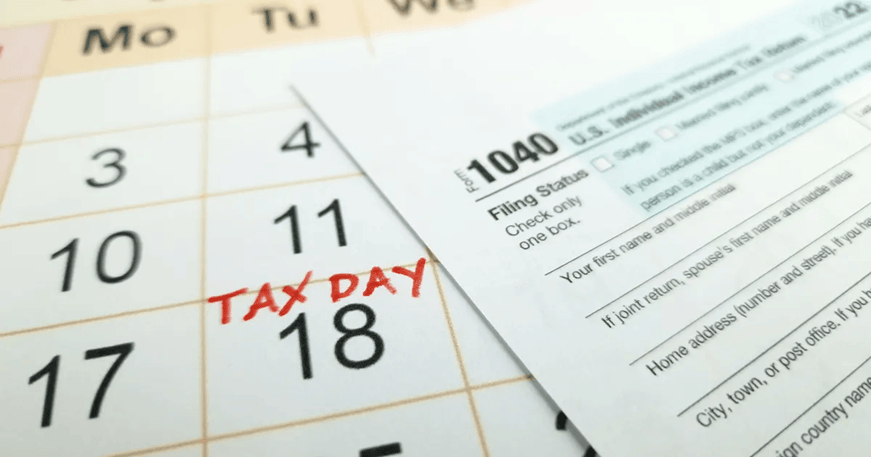
First, let’s start with federal taxes. The deadline to file this year is this Tuesday, April 18, 2023. Taxpayers requesting a filing extension on their federal return will have until Oct. 16, 2023.

Keep in mind, filing an extension doesn’t push back your payment deadline. You still need to submit anything you owe on time to avoid late penalties. An extension just gives you more time to complete your return.

In addition, the IRS has extended the filing deadline in states impacted by severe weather conditions recently:

  • New York residents impacted by winter storms and snowstorms in December have until May 15, 2023, to file their returns and make payments.
  • Taxpayers in Mississippi affected by tornadoes and severe storms in March now have until July 31, 2023.
  • Due to storms, mudslides, and other natural disasters this winter, the IRS has also given residents of Alabama, California, and Georgia until Oct. 16, 2023, to file federal returns and make payments.

The updated list of states eligible for extensions is available on the IRS website.

Here’s some general information for filing your states taxes.

Alaska, Florida, Nevada, New Hampshire, South Dakota, Tennessee, Texas, Washington, and Wyoming do not collect income taxes, so the rest of this is not applicable.

For the 41 states that do collect taxes, most are following the federal timeline with April 18th as the deadline.

There are some exceptions:

  • Iowa                May 1
  • Virginia           May 1
  • Delaware        May 2
  • Louisiana         May 15

Also, California has extended the deadline for state returns for residents affected by severe weather to May 18, 2023.

Please comment or send an email if you have any questions. Thanks!

Joe Baker, CFP®

Baker Asset Management, LLC

joebaker@bakerassetmanagement.com

Take Stock Market Track Records With A Grain Of Salt

I really enjoy looking at the historical performances of various stock market indices. It helps me form my big-picture outlook on the trajectory of the stock market over the course of a year or so.

As most investors know, the stock market has always gone up over the long term. But you have to take this accepted truth with a grain of salt. The key term here is “the stock market”. In almost all instances when looking at long-term historical performance of the stock market, the data refers to one of the big 3 stock market indices: the Dow Jones Industrial Average (DJIA), the S&P 500 index (S&P 500), and/or the NASDAQ 100 index (NASDAQ 100).

These indices track a basket of individual stocks. The DJIA tracks 30 stocks that are leaders in their respective industries. The S&P 500 tracks the 500 largest publicly traded companies in the United States and the NASDAQ 100 tracks the 100 largest companies listed on the NASDAQ exchange.

The problem here is that the companies that these indices track are periodically changed, depending on the index’s criteria. Typically, what happens is when a company has been performing poorly and/or has shrunk in value, they are replaced with another company that has been doing well and growing. Basically, the indices get rid of their losers and replace them with winners. So, naturally, the performances of the indices are going to be skewed higher.

Of course, this isn’t the only reason these indices seem to always go higher over the long term. Our country is growing. Our companies are serving more of the world and are becoming more efficient and profitable. Our GDP continues to expand as well. It’s just something to consider when looking at historical track records of the stock market.

Please comment or send an email if you have any questions. Thanks!

Joe Baker, CFP®

Baker Asset Management, LLC

joebaker@bakerassetmanagement.com

Monthly Update – April 2023

Fun Facts about April

  • Birthstone: Diamond
  • Flower: Daisy and the sweet pea
  • Zodiac signs: Aries and Taurus
  • April 1st (this Saturday) is April Fool’s Day. Watch out!
  • In the Southern Hemisphere, April’s weather is equivalent to October in the Northern Hemisphere.
  • Passover starts on Wednesday, April 5th and lasts through Thursday, April 13th.
  • The stock market is closed on Good Friday, April 7th.
  • Easter Sunday is April 9th this year.
  • Federal tax returns need to be postmarked by Tuesday, April 18th. The unusual filing deadline is due to Emancipation Day being on Sunday, April 16th but will be observed on Monday, April 17th this year. This is a public holiday in Washington D.C.

Stocks held up amazingly well during a tumultuous March that included some mid-size bank failures and an unrelenting Federal Reserve. The S&P 500 rose 3.3% during the month of March and is now up 7% for the year.

Other than the banking sector, most industries fared okay. If you owned big technology companies with solid balance sheets, you did very well, as many investors not only shifted their money from bank stocks but also moved their bank deposits into those tech stocks. This helped the NASDAQ 100 index enjoy its best week since 2010. In what became a bizarro-world moment, the stocks of Microsoft, Apple, Google, and Amazon became safe havens for investors and bank depositors!

Now, with Q1 in the books, earnings season will be moving the markets, at least until the Federal Reserve meets again in the beginning of May.

I’m leaving this table in the update through August to see if history repeats itself. There have been seven instances where a January with a 4% or higher return was followed by a negative February. 2023 is now the eighth. For each one of these years, the following six months had an average gain of almost 10%. Will 2023 keep this undefeated streak going?

Take a look at the Outlook section below to see what events could move the markets over the short term.

Bond prices have risen in January, dropped in February, and now have jumped up again in March. This is a clear indication that there is a lot of uncertainty out there in the fixed-income markets. On one hand, the economy continues to prove resilient in many sectors but on the other, there are signs of the economy slowing down (layoffs, tighter money supply, etc.). Plus, there are still fears of more bank failures. When there is a lot of uncertainty, there usually is a flight to safe haven investments, such as treasury bonds. This could explain the rise in bond prices this past month.

The 10-year US Treasury note yield headed lower in March, closing the month at 3.48%. The 30-year bond yield ended lower as well, closing the month at 3.66%. These yields are still well below the short-term treasuries. For example, the 6-month T-bill is currently yielding 4.88%, confirming a strong inversion of the yield curve and one of the best indicators of an impending recession.

Bond buyers should continue to focus on bonds with short-term maturities. I would keep maturities under two years and just plan on holding these bonds to maturity. That way, you won’t have to worry about selling at a discount if interest rates continue to rise. By the way, this is what happened to the banks that recently failed: owned too many bonds with long-term maturities that they had to sell at a loss to cover withdrawals.

Savings rates moved higher just a touch in March. These rates have been getting more competitive as savers are moving their money to institutions with better interest rates. Traditional bank accounts are also having to sweeten their rates for depositors because many are moving their savings to brokerage money market accounts in the wake of the recent bank failures.

Currently, the average savings account is paying 2.10%, up from 1.95% last month. There are some online savings accounts that are paying much higher rates than these and are worth taking the time to research.

The 1-year CD interest rate is now averaging 4.59%, up from 4.39% last month. The 5-year CD rate is currently at 3.90%, up from 3.86% last month. These rates are still inverted, just like the yield curve, meaning they are paying a higher rate to borrow your money for a shorter time period, which isn’t normal. These inversions typically do not last longer than six months. That said, if you’re looking for a place to park your savings or emergency spending money, just buy short-term CDs, 1 year or less, and reevaluate when they mature. Keep the total under $250,000 at any one bank to ensure you are fully covered by the FDIC. CDs are becoming a nice alternative for risk-averse investors and have drawn money away from stocks because of these relatively high rates that carry virtually no risk. I wouldn’t mind if these rates stayed this high but do not want to see them heading up much further.

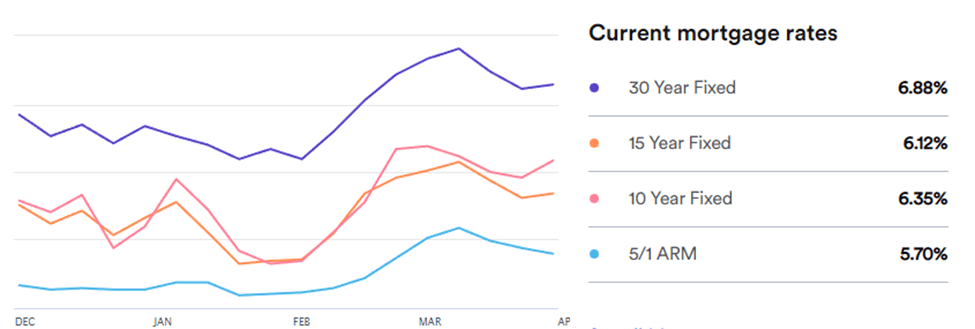
Mortgage rates resumed their downtrend in March after a one month rise in February (see chart below). Currently, the 30-year rate sits at 6.88%, down from 6.95% a month ago. It seems like any meaningful drop in mortgage rates causes demand to quickly heat up and it makes sense. Home buyers have a low inventory to choose from, which keeps home prices high. So, when mortgage rates drop, their potential home becomes more affordable and they want to jump on it while they can.

These rates are still the highest they have been in about fifteen years but that might last too much longer. The fixed income markets are predicting a recession based on the quick drop in short-term treasury bonds, which would force interest rates down, including mortgage rates.

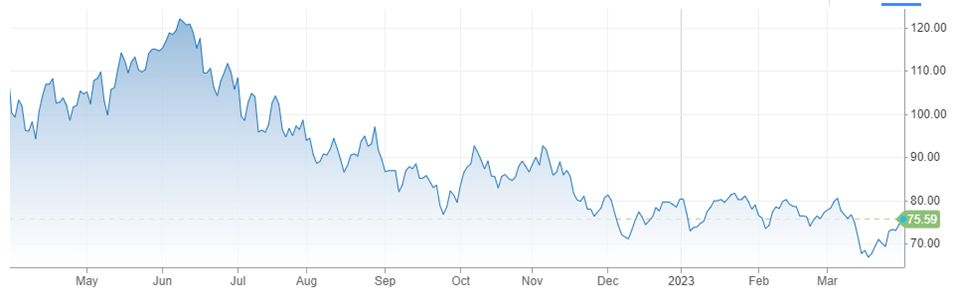
Oil prices dropped once again in March as lighter demand continued across the globe. Also, natural gas prices are down almost 80% from their highs last summer, as its price continues to collapse due to a warm European winter and ample supplies from the U.S. to counter the cuts from Russia.

For the month, the price for a barrel of oil settled at $75.54, about $1.40 less than it was at the beginning of March. This is a nice downtrend that hopefully will continue before the summer driving months and hurricane season begin.

Prices keep creeping lower, approaching a more sustainable price point, between $55 and $70 per barrel, that can keep both producers and consumers happy. This trend lower is also good for cooling down inflation since oil is a major input cost for almost everything that we consume.

Gasoline prices moved higher in March, as better weather sparked an uptick in recreational driving. Regular unleaded gasoline is now averaging $3.50 per gallon, up $0.14 from last month. Mississippi has the cheapest gas, at $3.03 a gallon. California has the most expensive gasoline at $4.83 per gallon. FYI, a year ago, we were paying $4.23.

Check out the prices at the pump in your area: AAA Gas Prices.

Outlook

Events on the horizon that could move the markets in the near term:

  • Fed & Inflation: In March, the Fed raised their overnight lending rate by 25 basis points once again. I thought that the multiple bank failures would have forced them to hit the brakes on raising rates, at least until they had a better understanding of how deep the problem was with the banking system. Even after the meeting, they still talked about raising rates even more. However, the markets don’t believe the Fed, at least based on the direction of interest rates recently. Investors feel strongly that the economy is heading for a recession and that the Fed is going to start cutting interest rates at some point this year. The 2 year treasury note, for instance, was yielding as high as 5.1% in the beginning of March but now is yielding only 4%, even after the Fed raised rates. I feel the Fed has done enough and needs to step back and reevaluate before they go too far and cause more damage than expected. By the way, the next Federal Reserve meeting is set for May 2nd-3rd.
  • Russia Invasion of Ukraine: I feel like news about this conflict has gone on the back burner and the world has accepted it and is adapting accordingly. Of course, this is just my observation from a continent away. I know close up, war zones are absolute hell on earth. Ukraine continues to hold its own and the only major news gaining traction is that Putin is thinking about placing tactical nukes in Belarus. Whether tactical or strategic, any nuke is a bad thing for everyone. Hopefully, this won’t come to fruition but I do believe Putin is getting desperate to try and end this war before he loses his grip on his own country. Any nuke movement will be bad for markets in the short term.

Joe Baker, CFP®

Baker Asset Management, LLC

joebaker@bakerassetmanagement.com
Some Good May Come Out Of This

There’s been a lot of bad news coming out of the financial sector of the economy these past few weeks. Amidst all these dark clouds, there may be a silver lining. First, let’s recap what happened recently.

For the last ten days, the banking sector has looked like it went back to 2008 all over again. Some banks have gone under, and others have been bailed out by the government and their bigger competitors. Poor leadership in these failed banks is, once again, the main culprit. But, this time, it’s a little different.

Back during the great recession, banks had a lot of bad loans and other sketchy assets on the books. When those loans couldn’t be paid back, all hell broke loose, and banks failed. Today, banks have much more solid balance sheets, with a big chunk of their deposits invested in long-term U.S. Treasury bonds. However, this became a problem for banks when interest rates began rising rapidly last fall. When interest rates go up, bond prices go down and long-maturity bonds are affected the most.

Subsequently, these long-term bonds that the banks held went down in price (lost value). Word got out about this and depositors wanted to get their money out of those banks, also known as a run on the banks. As you may or may not know, banks are required to keep a small percentage of total deposits on hand in cash at any one time to cover normal withdrawals by depositors. This works fine until there is a run on the banks, like what happened these past few weeks. So, banks had to sell those long-term bonds at a loss to raise cash, causing their balance sheets to implode. Now we have an idea of how these bank failures happened. Here’s where there might be some good news that comes out of all of this mess.

The Federal Reserve knows that there has to be many other banks that hold long-term bonds on their asset sheets and could suffer the same fate as the banks who have already fallen. So, this could be as good a time as any for them to pause raising interest rates. This would cause bond prices to go up and help stabilize the bond assets of banks, hopefully preventing more bank failures. Not to mention, it might help them from overshooting their inflation target and sending the economy into a recession, but that’s a discussion for another day. In any event, we will find out what they’re thinking this Wednesday afternoon when they conclude their next meeting. This is going to be an interesting week for the financial industry, to say the least!

Please comment or send an email if you have any questions. Thanks!

Joe Baker, CFP®

Baker Asset Management, LLC

joebaker@bakerassetmanagement.com
Why Homeowners Are Staying Put

It’s hard to find a For Sale sign on a neighbor’s lawn lately and it is showing up in the housing data across many parts of the country. In fact, existing-home sales in the U.S. fell for the twelfth straight month in January.

This drop in existing home sales and inventories makes complete sense when you look at a couple of data points: mortgage rates and treasury bond yields. First, there are fewer buyers out there who can afford to buy a house due to the relatively high mortgage rates, compared to the last decade or so. But the real reason for the drop in sales and inventories is on the selling side of the equation.

Existing homeowners either own their home outright or they have a mortgage with a rate in the 2 to 3 percent range when they bought their home or refinanced their mortgage in 2020-2021. So, for them to sell and buy another home with a 30 year mortgage rate that’s running over 7%, their monthly housing payments would jump considerably. Who is going to do that if they don’t have to move?

Plus, these homeowners can make some risk-free money from their current housing situation. This is where treasury bond yields come into play. For example, say a homeowner has a $250,000 mortgage at 3% and has $250,000 in cash available to invest. Instead of paying off the mortgage, they can invest in virtually risk-free treasuries or CDs and get over 5% interest annually. That difference in the mortgage rate and bond yields, in this case, 2% or $5,000 annually that they’ll be able to keep in their pockets, is a great way to take advantage of the current high interest rate environment.

This is an illustration of the types of scenarios that are going to keep existing home inventories suppressed until interest rates start falling again.

Please comment or send an email if you have any questions. Thanks!

Joe Baker, CFP®

Baker Asset Management, LLC

joebaker@bakerassetmanagement.com
Monthly Update – March 2023

Fun Facts about March

  • Birthstone: Aquamarine
  • Flower: Daffodil and Jonquil
  • Zodiac signs: Pisces and Aries
  • March’s equivalent in the Southern Hemisphere is September.
  • Sunday, March 12th, Daylight Saving Begins. We turn our clocks forward one hour (losing sleep!).
  • Friday, March 17th, is St. Patrick’s Day.
  • Monday, March 20th, is the 1st day of Spring, also known as Spring Equinox.

Stocks ran out of steam quickly after that big jump in January. For the month of February, the S&P 500 fell 2.5%. For the year, however, the index is still up 3.2%. The macro reason for the drop this month is, of course, the uncertainty of what the Federal Reserve is going to do when they meet again this month. There are conflicting signs regarding inflation and the potential for a recession. Concerning inflation, wages are still high, but energy and housing prices continue to drop. Concerning a recession, layoffs are muted outside of the tech sector and the economy is doing great in almost all industries. These higher wages by the way, especially in the retail, food and beverage, and travel sectors are probably here to stay. They needed to catch up with the rest of the economy because they were so low for so long. So, now it’s up to the Fed to decide how much higher they need to raise rates. If they raise them much more, it could spell trouble for stocks. There already is some stiff competition for stocks with interest rates as high as they are right now. Risk-free government bonds paying 5% are a solid, able-to-sleep-at-night alternative to stocks.

For you stock bulls, this table should give you some confidence that stock prices will rise over the short term. There have been seven instances where a January with a 4% or higher return was followed by a negative February. 2023 is now the eighth. For each one of these years, the following six months had an average gain of almost 10%. Will 2023 keep this undefeated streak going?

Take a look at the Outlook section below to see what events could move the markets over the short term.

Bond prices across the debt spectrum reversed course from January’s rise and dropped throughout February as economic data that pointed to stubborn inflation surprised investors. Yields subsequently went up through the end of the month as they move in the opposite direction of bond prices.

The 10-year US Treasury note yield moved up in February, closing the month at 3.91%. The 30-year bond yield ended higher as well, also closing the month at 3.91%, matching the yield of the 10-year note. These yields are still well below the short-term treasuries. For example, the 6-month T-bill is currently yielding 5.14%, confirming a strong inversion of the yield curve.

Bond buyers should be focusing on bonds with short-term maturities. I would keep it under two years and just plan on holding them to maturity, so you won’t have to worry about selling at a discount if interest rates continue to rise.

Savings rates remained relatively unchanged throughout February despite the Fed raising rates once again. There is still plenty of chatter that the Fed will continue to push rates higher, which should help boost our savings rates in money markets and CDs. However, it does feel like we are nearing the top on these rates.

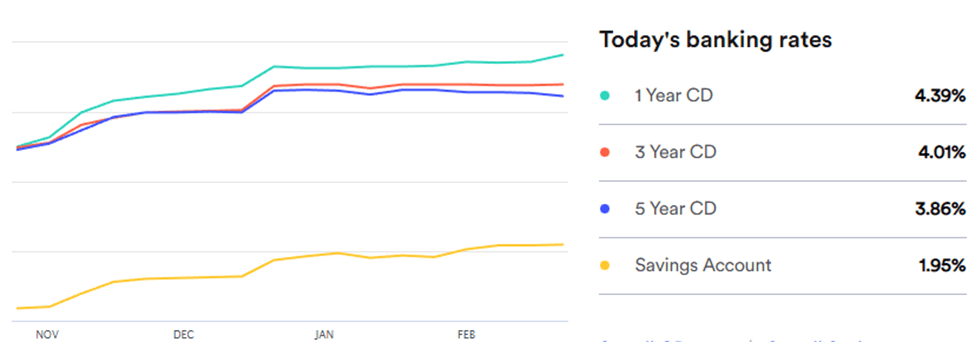
Currently, the average savings account is paying 1.95%, up from 1.79% last month. There are some online savings accounts that are paying much higher rates than these and are worth taking the time to research.

The 1-year CD interest rate is now averaging 4.39%, up modestly from 4.25% last month. The 5-year CD rate is currently at 3.86%, down from 3.95% last month. These rates are still inverted, just like the yield curve, meaning they are paying a higher rate to borrow your money for a shorter time period, which isn’t normal. These inversions typically do not last longer than six months. That said, if you’re looking for a place to park your savings or emergency spending money, just buy short-term CDs, 1 year or less, and reevaluate when they mature. CDs are becoming a nice alternative for risk-averse investors and have drawn money away from stocks because of these relatively high rates that carry virtually no risk. I wouldn’t mind if these rates stayed this high but do not want to see them heading up much further.

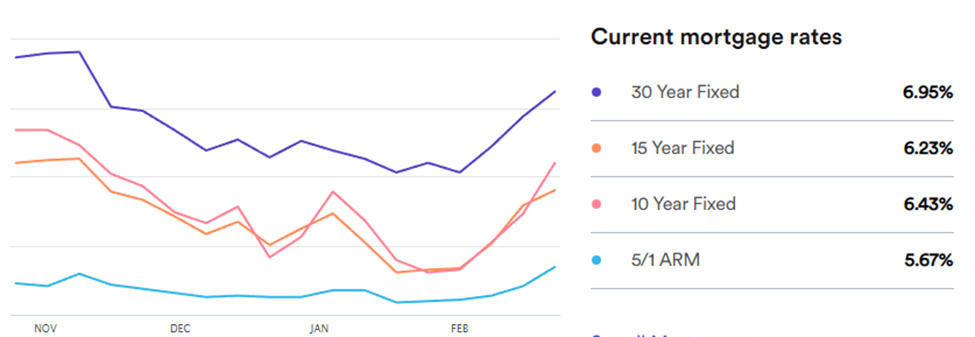
Mortgage rates did a major reversal in February and moved higher after a significant downtrend in the three months prior (see chart below). Currently, the 30-year rate sits at 6.95%, up from 6.43% a month ago. I think the main catalyst for this upswing is the hot inflation numbers that keep posting, which suggest that the Fed is going to keep raising interest rates. Also, demand has picked up since rates have fallen to lows not seen since last fall.

Going forward, that might not be the case, particularly with existing home sales. That’s because many occupied homes holding a mortgage have a fixed mortgage in the 2-3% range from the pandemic days and those owners have little incentive to sell if they have to buy a house with a 7% mortgage.

Oil prices continued to drop in February as demand waned due to an unusually warm winter. By the way, the same can be said for natural gas prices, which were nearly $10 per MMBtu this past summer and now are about $2.65!

For the month, the price for a barrel of oil settled at $76.92, about $2 less than it was at the beginning of February. This is a nice downtrend that hopefully will continue before the summer driving months and hurricane season begin.

Prices keep creeping lower, approaching a more sustainable price point, between $55 and $70 per barrel, that can keep both producers and consumers happy. This trend lower is also good for cooling down inflation since oil is a major input cost for almost everything that we consume.

Gasoline prices tracked lower with oil prices in February. Regular unleaded gasoline is now averaging $3.36 per gallon, down $0.15 from last month. Texas has the cheapest gas for a second month in a row, at $2.91 a gallon. Hawaii has the most expensive gasoline at $4.88 per gallon. FYI, a year ago, we were paying $3.61.

Check out the prices at the pump in your area: AAA Gas Prices.

Outlook

Events on the horizon that could move the markets in the near term:

  • Fed & Inflation: The Fed raised their overnight lending rate by 25 basis points, as expected, in February’s meeting. They also noted that they have solid data indicating that inflation has slowed its rise and may have peaked. Then, some hot inflation data points came in during this past month that spooked investors. Now, nobody is sure what the Fed may do at their next meeting or how much longer they plan on raising rates. This uncertainty has put a damper on the stock market recovery that we saw in the beginning of the year. Expect this volatility in the markets to continue as we approach the date of the next Fed meeting in late March. They’ll most likely raise rates again, but it is what they say about future rate hikes that will steer the direction of the market going forward.
  • Russia Invasion of Ukraine: Ukraine is holding on and for them, a stalemate is a win. But, on the ground, war is hell, especially for the Ukraine civilians just trying to survive. The warm winter was a godsend for the country and certainly helped erase the inflated oil and natural gas prices that we saw this past summer. It’s been over a year since the invasion started and the damage is massive for both countries: structurally for Ukraine, but Russia has been devastated economically regardless of the outcome. It will end and when it does, it will be a positive for the markets although not as much anymore since the world has learned to live with this conflict.

Joe Baker, CFP®

Baker Asset Management, LLC

joebaker@bakerassetmanagement.com
Will Social Security Run Out of Money?

I figured that I would talk about this topic again since it seems that Congress is considering doing something to try and fix social security.

I was perusing the 2022 Annual Report issued by the Social Security Board of Trustees recently and found some good news and some not-so-good news. First, let’s look at a few highlights from the report.

Here are some interesting facts that they talked about in the report:

  • There are actually 2 trust funds: Old Age and Survivors Insurance (OASI) fund and the Disability Income (DI) fund. However, everyone usually describes it as one fund (OASDI).
  • Federal Insurance Contributions Act (FICA) taxes are the primary source of revenues for OASDI and are the largest component of taxes that are commonly referred to as payroll taxes.
  • Employers and employees each pay 7.65 percent of wages in FICA taxes; the portion dedicated to Social Security is 6.2 percent. The other 1.45 percent is dedicated to Medicare’s Hospital Insurance program and is not subject to an earnings cap.
  • Self-employed individuals also contribute to those funds through Self-Employment Contributions Act (SECA) taxes. The rates for SECA taxes are identical to those for FICA taxes, with the only difference being that the individual is responsible for paying both the employee and employer portions of the tax.
  • The OASDI trust fund will be depleted by 2035. That means benefits after 2035 can be paid by new money coming in only.
  • After 2035, new money coming in via OASDI taxes will be sufficient to pay about 80% of benefits.
  • Currently, earnings up to $160,200 are taxed for Social Security benefits.

So, the good news is that there is that there is still a little cushion in the trusts. If the government takes action now, it will be a lot less painful than if we wait until it’s all gone. However, you know they won’t act unless their jobs depended on it so we have to hold our members of Congress accountable.

I don’t like whining about a problem unless I have a decent solution to fix it. In the case of running out of money to fully fund social security, there’s a couple of solutions that can help:

  • Raise or remove the income cap, currently $160,200, that is subject to OASDI payroll tax. There is even talk about keeping the cap where it is and then restarting OASDI payroll deductions at a higher income, say $500,000. This would give people making between 160k and 500k a little break. Either way, it would certainly bring in the kind of revenue needed to shore up the program’s balance sheet.
  • Another solution is means testing. This means that people who have an income over a certain level would be phased out of getting any benefits. People like Warren Buffet, Bill Gates, and the Walton family can probably get by without their social security check every month.

Using some variations of these 2 solutions could keep the OASDI trusts from drying up and will help the people that truly rely on their social security check to live, which is more people than you can imagine.

Please comment or send an email if you have any questions. Thanks!

Joe Baker, CFP®

Baker Asset Management, LLC

joebaker@bakerassetmanagement.com

Where Investors Are Putting Their Money In 2023 (so far)

2023 has started out with a bang for the U.S. stock market. After a disastrous 2022, stocks are trying to recoup their losses but they are finding some strong competition from other asset classes, particularly bonds and money market funds.

With interest rates back up to a much more competitive level than what we have seen in the past 15 years or so, there are now legitimate places to invest besides the U.S. stock market and get a decent rate of return.

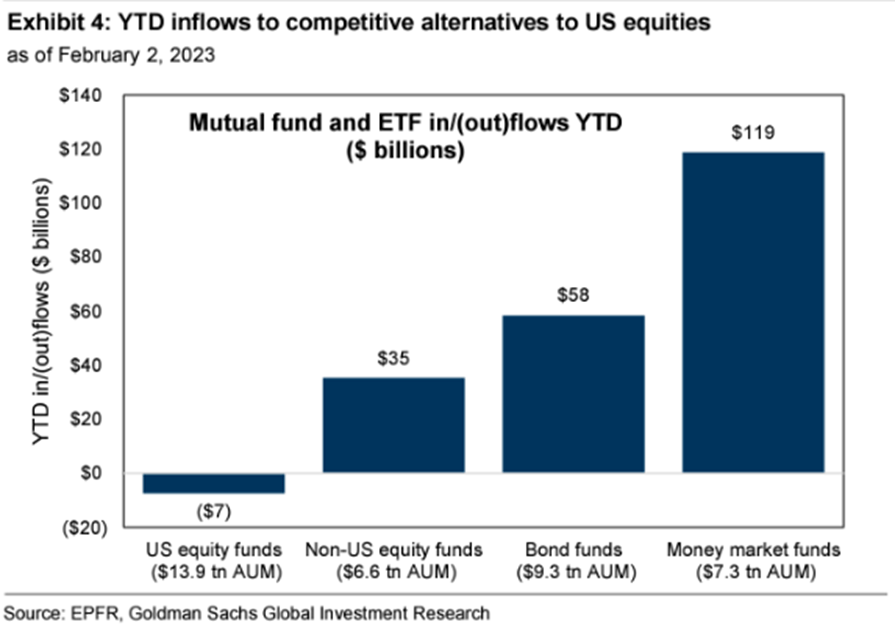
Let’s take a look at the flow of money going into and coming out of mutual funds, exchange-traded funds (ETFs), and money market funds since the beginning of 2023. The chart below shows the net flows of money for 4 different investment categories: U.S. stocks, Foreign stocks, Bond funds, and Money market funds.

As you can see, investors have been pulling money out of U.S. stocks and moving into foreign stocks, bonds, and savings (money market funds). Who can blame them? You can park your money in a money market account currently paying over 3% interest, or a 1-year CD paying almost 4.5%. That’s not bad for a risk-free investment.

Risk-averse investors have been waiting for rates like these for a good part of this century so this is welcome news for those that need investment income without risking their principal.

Now, if you’re an investor that goes against the herd, also known as a contrarian investor, you know this chart also signals a good time to get into the stock market. I definitely want to revisit this chart at the end of the year if stocks continue to go up, to see if the money flows change significantly or not.

The good news is that you don’t have to be all stocks or all cash. You can enjoy the best of both worlds by allocating your money according to your risk tolerance and time horizon.

Please comment or send an email if you have any questions. Thanks!

Joe Baker, CFP®

Baker Asset Management, LLC

joebaker@bakerassetmanagement.com
Monthly Update – February 2023

Fun Facts about February (How is it February already!!)

  • Birthstone: Amethyst
  • Flower: Violet and Primrose
  • Zodiac signs: Aquarius and Pisces
  • February’s equivalent in the Southern Hemisphere is August.
  • Thursday, February 2nd is Groundhog Day. This is the day we find out whether winter will last six more weeks or call it quits early.
  • Tuesday, February 14th is Valentine’s Day.
  • Monday, February 20th, is Presidents Day. The stock market, banks, and government offices will be closed that Monday.
  • Tuesday, February 21st, is Mardi Gras, aka Fat Tuesday.

Stocks started out 2023 with a nice performance in January. In fact, it was the best January for the S&P 500 since 2019. For the month of January, the S&P 500 had a positive gain of 6.5%. Historically, this is a good sign that stocks will finish positive for the rest of the year, with the average annual gain of about 11.5%. Plus, when the previous year (2022) was negative, the annual return for the ensuing year has been even better, averaging about +14%.

We have companies reporting their Q4 and 2022 numbers right now but the big news that will move the markets will be coming from the Federal Reserve this afternoon. They are expected to raise rates again but by a smaller amount, most likely 25 basis points. But, it’s what they say about their strategy going forward that could send the stock market reeling or give it a nice boost. Canada’s central bank has put a halt to their interest rate hikes last week, which could be a good sign to those of us who would like the Fed to do the same.

Take a look at the Outlook section below to see what events could move the markets over the short term.

Bond prices across the debt spectrum slowly drifted up as more signs of a slowing economy and possible recession popped up throughout this past month. Yields subsequently dropped through the end of the month as they move in the opposite direction of bond prices. This price action, coupled with the inverted yield curve, is sending a strong signal to the Federal Reserve that they should be more worried about sending the economy into a recession, rather than trying to rein in inflation (which they have already done).

The 10-year US Treasury note yield headed lower in January, closing the month at 3.51%. The 30-year bond yield ended lower as well, closing the month at 3.64%, still lingering just above the yield of the 10-year note once again. These yields are still well below the short-term treasuries. For example, the 6-month T-bill is currently yielding 4.83%, confirming a strong inversion of the yield curve.

Investors are going to be tuning in later today when the Fed announces their decision on interest rates and, more importantly, if they decide to adjust their strategy. Today and the rest of the week should be very interesting and will certainly move the bond and stock markets if there are any surprises. That said, bond buyers should stick to purchasing individual bonds with maturities less than 2 years.

Savings rates finally have levelled off after moving higher for fourteen straight months. Most rates stayed flat throughout January as we wait for the first Federal Reserve meeting of 2023 to end this afternoon with their decision on interest rates. We will see if savings rates continue to climb or if they have peaked. Regardless, it is nice to finally earn some interest in our money market and CD accounts.

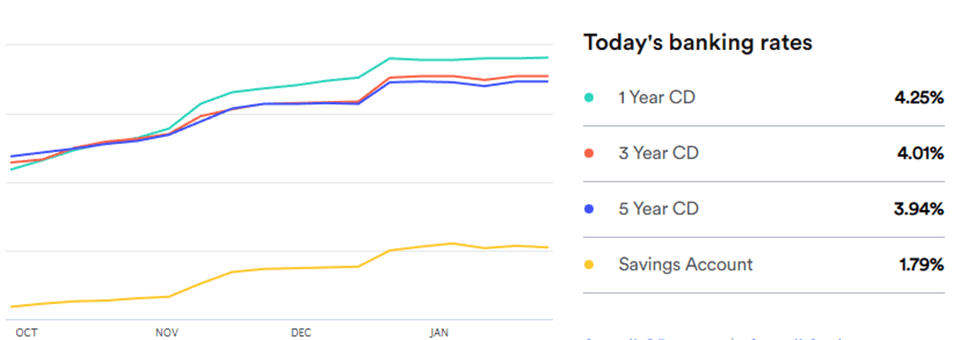
Currently, the average savings account is paying 1.79%, about the same as last month.

The 1-year CD interest rate is now averaging 4.25%, up slightly from 4.22% last month. The 5-year CD rate is currently at 3.94%, exactly the same as last month. These rates are still inverted, just like the yield curve, meaning they are paying a higher rate to borrow your money for a shorter time period, which isn’t normal. These inversions typically do not last longer than six months. That said, if you’re looking for a place to park your savings or emergency spending money, just buy short-term CDs, 1 year or less, and reevaluate when they mature. CDs are becoming a nice alternative for risk-averse investors and have drawn money away from stocks because of these relatively high rates that carry virtually no risk. I wouldn’t mind if these rates stayed this high but then that means that inflation is staying high as well, which is no good in the long run.

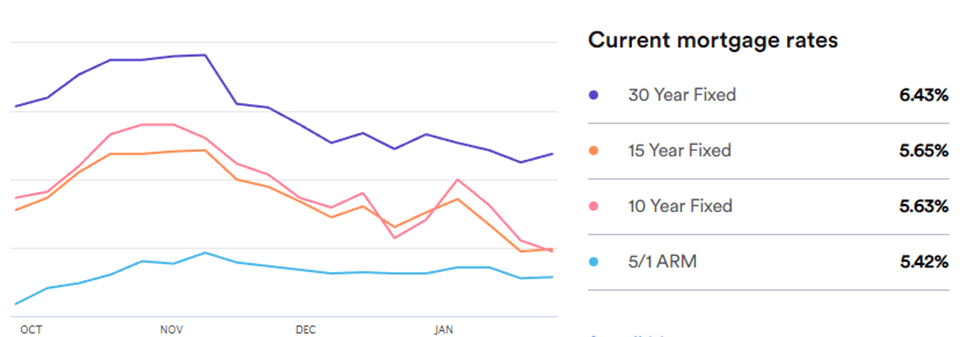
Mortgage rates continue to trend downward after peaking in November (see chart below). Currently, the 30-year rate sits at 6.43%, down from 6.59% a month ago. In most areas of the country, home prices continue to fall as demand wanes due to recession fears. Existing home sales for December came in down over 36% from one year ago. That is a huge drop. Also, the home builders’ confidence report has declined for thirteen months in a row now, nearly matching the lows at the start of the pandemic in 2020. The silver lining here is that the rate of decrease for both of these has slowed significantly.

Another ray of hope for the housing market is a data point known as the homeowner vacancy rate, which shows what share of owner-occupied housing units are vacant and for sale. It is currently just off its all-time low. That means inventory (supply) is still pretty low, which helps to keep prices from falling. I’m pretty sure there’s plenty of homeowners that have paid off their mortgage or have a 2-3% mortgage rate that are not even considering moving, which is certainly helping to keep existing home inventories low.

Oil prices dropped once again in January as fears of slowing demand outweighed China’s reopening from the pandemic. For the month, the price for a barrel of oil settled at $79.00, about $1.50 less than it was at the beginning of January. Another helpful data point confirming inflation has most likely peaked.

We’re getting back down to what I like to call the sweet spot for oil prices, between $55 and $70 per barrel. This price range is profitable enough for oil companies and tolerable for businesses and consumers when converted to diesel and gasoline. This downtrend in oil prices should be well noted by the Federal Reserve and hopefully they will cease and desist on raising rates further.

Gasoline prices did not follow the drop in oil prices and rose significantly in January. Regular unleaded gasoline is now averaging $3.51 per gallon, up $0.31 from last month. There are no states with gasoline under $3 (there were sixteen last month). Texas has the cheapest gas, at $3.13 a gallon. Hawaii has the most expensive gasoline at $4.94 per gallon. FYI, a year ago, we were paying $3.37.

Check out the prices at the pump in your area: AAA Gas Prices.

Outlook

Events on the horizon that could move the markets in the near term:

  • Fed & Inflation: The Federal Reserve Open Market Committee is wrapping up their two-day meeting this afternoon that will end with their decision on how much they plan to raise short term interest rates. Most bets are on a 25 basis points raise and that is already factored into stock and bond prices right now. The big question that needs to be answered is what they expect going forward. Everyone knows inflation peaked last year and has been coming down ever since. Does the Fed still need to raise rates, or have they done enough to tame inflation? If they keep raising rates after this meeting, it could trigger another leg down for stocks and bonds. If they plan to hold steady, we could see a new bull market emerge for stocks.
  • Russia Invasion of Ukraine: Really no change from last month. Putin has gone full crazy, and everyone is just hoping someone takes him out from the inside. They’ve been at it for almost a year and you really have to be amazed by the resiliency of the Ukraine people. Hopefully, they can continue to hang in there until Russia gives up and goes home. Because of the war’s unexpected lengthy duration, only a major change in this stalemate, like an end to it, will move the markets significantly.

Joe Baker, CFP®

Baker Asset Management, LLC

joebaker@bakerassetmanagement.com