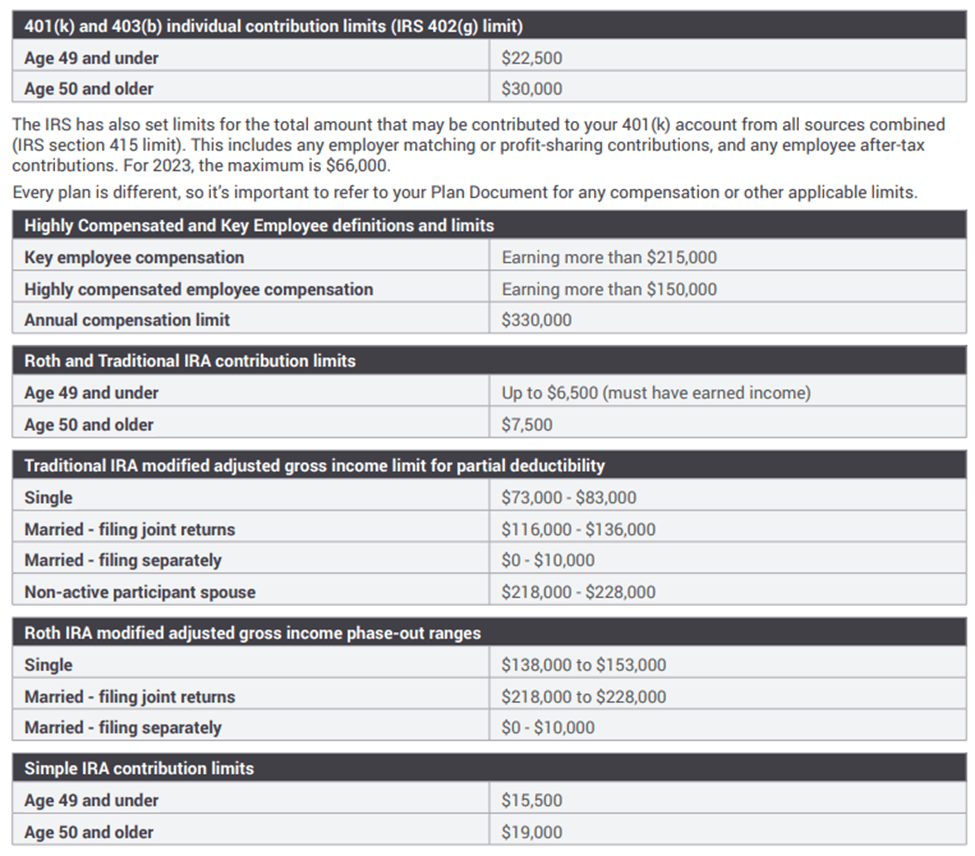
The IRS has just set the new contribution limits for retirement plans for 2023 and there are some big increases regarding how much that you can contribute. The big jump in contributions limits is mostly due to the high inflation that we are experiencing this year.
Here are the new limits:
With respect to IRAs, here are some additional notes:
For most people your modified adjusted gross income, or MAGI, is the same as your adjusted gross income, which can be found on the front page of form 1040.
Traditional IRA
The limits shown above are for those people that are covered by a retirement plan at work. If you have no plan at work, your IRA contribution is always fully deductible, regardless of how much you earn.
If you’re single and your MAGI is less than $73,000, you can get the full tax deduction.
If you’re married and your MAGI is less than $116,000, you can get the full tax deduction.
Roth IRA
If you’re single and your MAGI is less than $138,000, you can contribute the full amount allowed, $6,500 or $7,500 if over age 50.
If you’re married and your MAGI is less than $218,000, you can contribute the full amount allowed, $6,500 or $7,500 if over age 50.
Depending on your situation, it might make sense to contribute to both a traditional IRA and a Roth IRA. Your total contributions to both are still capped at the allowable limits for a single IRA.
Please comment or send an email if you have any questions. Thanks!
We are just a few weeks away from this administration’s mid-term elections. Mid-term elections occur in the second year of a president’s four-year term. So, for Biden, who was sworn in on January 20th, 2021, we are approaching the completion of his first two years in office, hence the name, mid-term elections.
Mid-term elections have an impressive track record for signaling the start of a positive year for the stock market. Here’s how impressive: Since the mid-term elections in 1942, the S&P 500 index has gone up every one-year period following the elections. That’s amazing! Plus, the average gain during those one-year periods has been almost 15%. So, if this trend holds true, we should expect stocks to go up from this November through November 2023. We could sure use it.
Most investors believe this happens because the elections remove some uncertainty in the markets. We will know who controls what gets passed and what doesn’t in Congress, specifically any changes in tax or fiscal policy, and also where government money will be spent.
Here is something else we should expect from this year’s mid-terms: a changing of the guard in Congress. Over the past 19 mid-term cycles, the party holding the presidency has lost an average of 26 seats in the House of Representatives and 4 in the Senate, regardless of how the economy or the stock market had performed. If this trend holds true, we should see political gridlock in D.C. This stinks for getting things done by Congress or the President, but it does bode well for stocks because there will most likely be no policy changes and no changes in the law that could adversely affect corporate profits and growth.
The timing could coincide with inflation peaking, which would really boost the stock market. Regardless, buckle up for what could be a wild end of the year for the financial markets.
Please comment or send an email if you have any questions. Thanks!
I came across a couple of charts and tables recently that I wanted to share with you. I think they can help you put this dismal stock market in perspective and help you make more informed decisions regarding your investments.
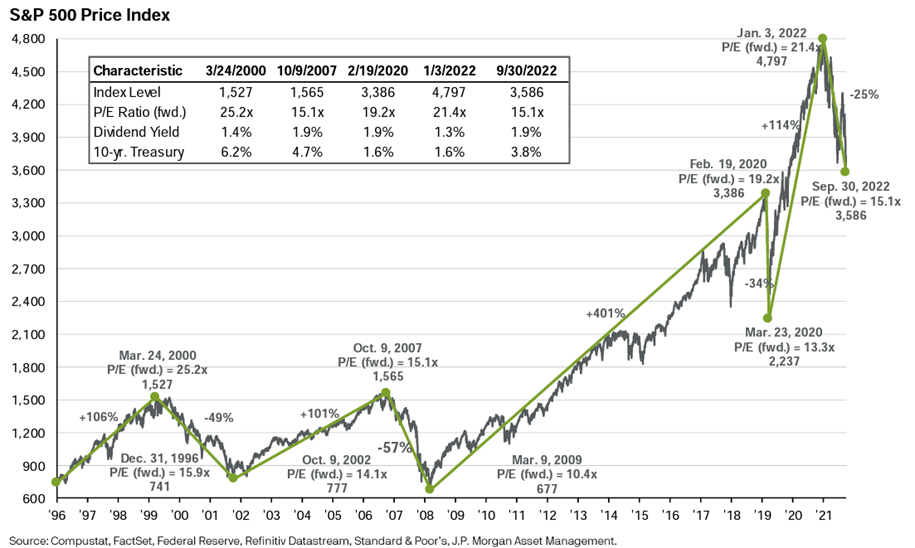
This first one is a graph that shows how the S&P 500 index has performed since 1996. You’ll notice that there have been four large downward moves in the S&P 500 since 2000 and the one that we are experiencing right now is the smallest of the four (and hopefully will stay that way!). The big picture takeaway from this chart is to remind you that these drawdowns occur periodically as part of a normal economic cycle. What causes them, i.e., the catalysts, are what typically change each time.
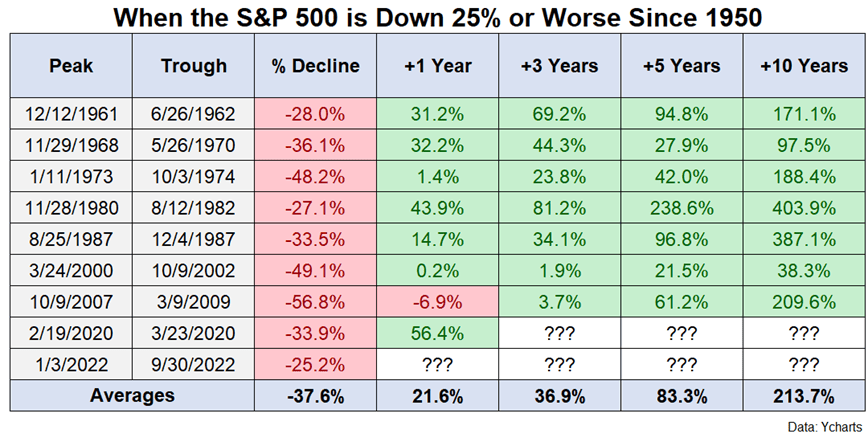
The following table gives us some hope that the stock market will eventually rebound.
As you can see, after stocks have had a decline such as the one that we are experiencing, the return on investment has been pretty good looking at the 1-, 3-, 5-, and 10-year time periods after the decline had ended.
To summarize, these big drops in the stock market occur periodically (we’ve already had 4 this century) but pave the way for solid returns soon thereafter.
Please comment or send an email if you have any questions. Thanks!
Joe Baker, CFP® Baker Asset Management, LLC joebaker@bakerassetmanagement.com
October’s name comes from the Latin word octo, meaning “eight.” This month had originally been the eighth month of the early Roman calendar.
October is the first full month of the autumn season in the Northern Hemisphere. Its Southern Hemisphere equivalent is April.
October 4th marks the start of Yom Kippur, at sundown.
October 10th is Columbus Day, a federal holiday, and is observed on the second Monday in October. It was on October 12, 1492, that Christopher Columbus landed on a small island in the Bahamas, convinced that he had reached Asia.
October 10th is also Indigenous Peoples’ Day —a holiday that celebrates the history and cultures of indigenous peoples native to the United States.
October 31 is Halloween (All Hallows’ Eve)!
Stocks had a brutal September, not to mention bonds, commodities, crypto, and real estate. The fear of a recession due to the Federal Reserve hiking interest rates too much made investors just throw in the towel and hit the sell button. When it was all said and done, the S&P 500 dropped nearly 10% in September. For the year, it is down nearly 25% and all hopes for a year-end rally now hinge on the Fed.
Stocks all of a sudden have some worthy competition that they haven’t had since 2007: bonds. Yields of risk-free U.S. government bonds that mature in two years or less are at or near 4.2% currently. That’s a huge increase from just a year ago when they were yielding about 0.75%. This is enticing investors to sell stocks and buy bonds. Add that to the fears of a Fed-induced recession and you have a gloomy scenario in place for the stock market.
Wages seem to be the biggest concern for the Fed. Unemployment is down to pre-pandemic levels (that’s a good thing, right?) so it’s an employee’s market. Employers have to raise wages to recruit/retain employees right now. More wages mean more people are willing to pay higher prices for groceries, cars, etc. Fortunately, we are seeing lower input costs for consumer goods, especially regarding transport costs (fuel, shipping rates, etc.). I’m cautiously optimistic that the Federal Reserve will take a step back at the end of the year and reassess their rate-hiking strategy to make sure that they don’t overshoot and drive us into a full-blown recession.
Q3 earnings will start coming out in a few weeks and it will be interesting to hear companies’ opinions on how the rate hikes have affected and will affect their businesses.
Take a look at the Outlook section below to see what events could move the markets over the short term.
Bond prices continued to sink as interest rates rose worldwide in September amid inflation fears. Even owners of government bonds that mature in a few years want out and are selling, indicating that there’s no safe haven in these markets.
The 10-year US Treasury note continued to ride the inflation wave up, almost touching 4% at one point, but eventually ending September at 3.80%. The 30-year bond almost yields the same as the 10-year, at 3.78%, ending the month higher as well.
If you are buying individual bonds, especially high-yield, or junk bonds, make sure you do your research before buying. Companies issuing bonds paying higher interest rates could be subject to default more easily if they are not managed well and are having a hard time making money in this economic environment. I would try to stick to government-issued bonds or bonds issued from high quality companies with strong cash flow and balance sheets, even though you will be getting a smaller interest payment than from junk bonds. I would avoid bond mutual funds or ETFs with no maturity date in this interest rate environment.
Savings rates continue to climb (11 months in a row!) as interest rates rise across the board. We’re finally getting paid something to put our money in money market and savings accounts.
Currently, the average savings account is paying 1.02%, up from 0.86% last month. Not great, but better than the 0.10% the banks were paying us just about a year ago.
The 1-year CD interest rate is now averaging 2.80%, up from 2.34% last month. The 5-year CD rate is currently at 2.97%, up from 2.70% last month. They are getting to a pretty decent rate for risk-free returns, at least the one-year CD anyway. I would like to see the 5-year at 4.25% to be worthwhile, in my opinion.
Mortgage rates continued their march higher, in step with other lending rates. They reached their highest levels of the year in September, even as demand wanes for new home loans and refinanced mortgages. Currently, the 30-year rate sits at 6.83%, up from 5.93% a month ago. Home prices continue to fall across the country as buyers shun the larger mortgage payments for both new and existing homes. I would think mortgage rates have to be leveling off due to weak demand, but I said the same thing last month and they are still heading higher. Over the last 50 years, rates are still lower than average, but they are the highest they’ve been since 2008. Rates might peak pretty soon if demand for mortgages continues to drop.
Oilprices continue to step down as global inflation curbs spending and traveling. No hurricane activity near rigs or refineries is helping to keep prices low, particularly in the U.S. In September, the price for a barrel of oil settled at $79.67, $10 less than it was at the beginning of the month. For the year, oil is now only up about 3.5%.
The drop in oil prices should continue as demand slows down from the effects of inflation. Fuel is a big component of the input costs for most consumer products so this drop in oil prices is good news for those looking for signs that inflation is easing. I’m sure the Fed is monitoring this as they consider more rate hikes (please, no more).
Gasoline prices dropped significantly once again in September. Regular unleaded gasoline is now averaging $3.78 per gallon, down $0.05 from last month. Mississippi now has the cheapest gas, at $3.07 a gallon. California recaptured the crown from Hawaii (that was short lived) for the most expensive gasoline at $6.29 per gallon. FYI, a year ago, we were paying $3.19.
Check out the prices at the pump in your area: AAA Gas Prices.
Outlook
Events on the horizon that could move the markets in the near term:
Russia Invasion of Ukraine: The world seems to be settling into this conflict with no end in sight. I feel for the Ukrainians as well as the Russians trying to flee their own country as Putin slips ever so farther into madness. This war is still affecting energy prices, especially for Europe. However, the one factor that could wreak havoc on the world is if Putin goes full Dr. Evil and uses nukes. I’m hopeful that there are people surrounding him that are aware of the consequences of such actions and will prevent it from happening. This is really the one thing that is not priced into the markets yet. Hopefully, it won’t have to be.
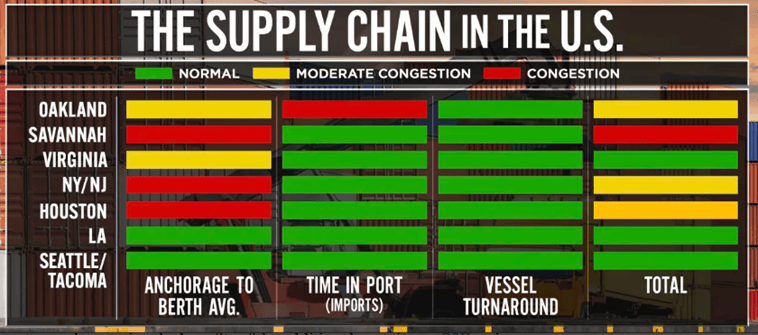
Supply Chain Status: Shipping costs continue to retreat as fuel prices decline and port congestion eases up on the west coast. NY/NJ ports have now become the biggest importer by container volume as shippers divert more cargo to the east coast to avoid possible port labor strikes on the west coast. In fact, this August was the busiest August in the history of the Port of New York and New Jersey and the fourth busiest month ever. The port’s five busiest months have all occurred in 2022. The graphic below gives you a big-picture view of the U.S. supply chain, shipping specifically.
Green is good and this bodes well for retailers wanting to stock their shelves for the holiday shopping season. Hopefully, prices will have fallen enough for us to buy some of this stuff!
Fed & Inflation: The Fed raised short term lending rates 75 basis points once again to help cool down inflation. They’ve indicated that they will continue to raise rates for the foreseeable future until they get inflation down to 2%. They are trying to do this without raising rates too far too fast, which will throw us into a recession. I think they should pause and monitor the data before raising rates anymore. Prices have come down across the board for almost every consumable. Home and auto prices have dropped as well. The Fed sees this but is also worried about wages getting too elevated. That should be the least of their worries, in my humble opinion. At this point, I believe more damage will be done by raising rates than by taking a pause. Any pause or change in the Fed’s strategy would be a positive catalyst for stocks and bonds.
Trying to figure out how much money that you will need in your retirement years is a complex endeavor. There are so many variables and unknowns that have to be accounted for in order to get a somewhat accurate estimate. Even with accurate inputs, these calculations need to be reevaluated often to account for tax code changes, lifestyle changes, and actual investment returns, just to name a few of those variables.
The one that I wanted to focus on today is the withdrawal rate of your retirement accounts. That is, how much will you need to take out of your IRA, 401k, etc., to live the life that you desire during retirement.
The most common method is to figure out what your expected monthly expenses will be and then determine if you’ll have enough in your accounts to cover those expenses for the rest of your life.
For example, if you expect to need $6,000 per month in retirement over the next 30 years, you’ll need a about $1,300,000 to start with in your retirement savings. This accounts for everything, including all the fun that you’re going to have: trips, vacations, etc.
What most people, and their advisers, don’t account for is their activity levels throughout retirement. That’s why I feel this method for calculating your “number” is kind of misleading.
Using the same example, you might only need that $6,000 monthly amount for, say, the first 15 years of retirement. Then, after all that partying, you might want to take it down a notch. So, let’s make it $4,000 per month that you’ll need for the remainder of your retirement years. It turns out in this scenario, that you’ll only need about $1,080,000 to start with, or about $220,000 less than if you just used the same monthly amount for your entire retirement.
Of course, the bigger the number that you can start with, the better. So, the next time you want to calculate your retirement “number”, consider making the adjustment above. It might make you realize that you are doing all the right things to prepare for the future and will take some stress out of your life today.
The following is an excerpt from a very interesting article that I read recently regarding the financial implications of being married in our golden years.
It talks about how the current tax laws can wreak havoc on our retirement income and financial security as we grow older. The two areas that are the biggest causes for concern are Social Security and long-term care. It’s well worth the time to read:
A devastating new critique in the Washington University Law Review has spelled out how federal law punishes older couples for being married.
It’s not just that if you meet and fall in love during your golden years you may be much better off staying unwed than tying the knot; it’s that under current federal law if you and your long-term spouse make it into your 60s you might well be able to help your struggling finances by divorcing.
These are the implications of “Preferencing Nonmarriage In Later Years,” by law professor Richard Kaplan, the Guy Raymond Jones Chair in Law at the University of Illinois.
He highlights two key areas of elder finance where a couple is often better off unmarried than married: Social Security and nursing-home care. As these are two of the most important financial issues facing all elders, the argument about elder marriage — or elder divorce — may be more than academic.
On Social Security, Uncle Sam started taxing benefits in 1983. As Kaplan points out, the taxation system is so “bizarre” (his word) that taxes are higher on a married couple than on an unmarried couple with the exact same finances. That’s because Social Security taxes kick in at two thresholds, and in both cases, Kaplan says, “the applicable threshold for a married couple is less than twice the threshold for an unmarried person.”
The first income threshold is $25,000 for a single person, and $32,000 for a couple. The second threshold is $34,000 for a single person, and $44,000 for a couple. That means two unmarried people living together with incomes of $25,000 apiece will end up paying no Social Security taxes in retirement. They won’t even hit the first threshold. But a married couple with income of $50,000 blows through both thresholds and ends up paying tax on 85% of their benefits.
“The current income-tax structure pertaining to Social Security benefits makes nonmarriage the law’s preferred status on this important and widely applicable issue,” Kaplan writes.
This isn’t the only way the taxation of Social Security takes on a bizarre character. The taxes were introduced in 1983, under Alan Greenspan’s plan to “save” the system. As noted before, these are double taxes, because you pay into the Social Security system with after-tax dollars. So your contributions are subject to income tax, and then the benefits are subject to income tax as well. They get you coming and going, as the expression goes.
Meanwhile it’s also worth noting that the income thresholds at which you start paying Social Security taxes weren’t even indexed for inflation. They were introduced in 1983 as taxes on high earners only. Ask yourself if a retired couple today with a total income of $32,000 is high earning.
But if the marriage penalty for Social Security taxes looks strange, it pales compared with the treatment of married couples when it comes to paying for nursing-home care. The average nursing home now costs about $110,000 a year per person. Many people still think Medicare will pay for them to stay in a nursing home, if they end up needing to. As Kaplan points out, it won’t, except in very narrow circumstances (such as skilled nursing care for a couple of months after discharge from hospital). The only federal program that will pay for nursing-home costs is Medicaid, and it will only do so once you have spent nearly all your own assets and income and are effectively broke.
Here’s the twist. When it comes to making sure you’ve spent nearly all of your own assets first, Medicaid will consider a married couple as a unit, but an unmarried couple as two separate people.
So if, say, Bill and Betty are married, and Bill has to go into a nursing home, Medicaid will demand the couple run through nearly all their money — Betty’s as well as Bill’s — before it starts chipping in.
“As a married person, some of Betty’s income might be required to pay for Bill’s nursing-home bill,” Kaplan writes. “If Bill and Betty were not married, however, none of her income would be subject to this mandatory contribution requirement.”
Naturally there are some allowances — the Medicaid law is not to render Betty destitute — but they are not extensive. They generally include the primary residence if the spouse is still living there; a single car; a prepaid burial plot; and something called the “Community Spouse Resource Allowance,” or CSRA, which varies from state to state, rises to a maximum of $137,400, and is supposed to be enough for the remaining spouse to live on.
“There is no concept comparable to the CSRA for couples who are not married, and accordingly there is no limit on how much an unmarried partner can keep,” Kaplan writes.
He continues: “Assume that Bill in the preceding example has $100,000 in financial assets beyond the ‘exempt resources’ while Betty has $600,000 of such assets. Assume further that Bill needs to apply for Medicaid long-term-care benefits, so his and Betty’s combined nonexempt resources are $700,000. In this case, all of those assets would need to be spent on Bill’s care until only $137,400 (at most) remains. But if Bill and Betty were not married, Bill would be required to spend down his $100,000 to $2,000, while Betty’s $600,000 of financial assets would be completely unaffected.”
To add insult to injury, after Bill dies, if the couple is married, Medicaid can come after Betty to help defray Bill’s nursing-home costs. They can even come after Betty’s estate after she dies. But not if they aren’t married.
It’s not entirely a one-way street, as Kaplan admits. Marriage has its legal benefits, even in your senior years. But in many cases, such as estate planning and healthcare power of attorney, you can replicate some of those benefits through legal documents and smart planning — even without tying the knot.
Marriages are made in heaven, goes the saying, but they are lived here on Earth. Sadly, Uncle Sam doesn’t make the latter any easier when you’re older.
Please let me know if you have any questions.
Joe Baker, CFP® Baker Asset Management, LLC joebaker@bakerassetmanagement.com
September’s name comes from the Latin word septem, meaning “seven.” This month had originally been the seventh month of the early Roman calendar.
September is the first of the autumn months in the Northern Hemisphere. Its Southern Hemisphere equivalent is March.
September 5th —the first Monday in September—is Labor Day.
September 22nd marks the start of fall. This year’s Autumnal Equinox occurs at 9:03 P.M. EDT on Thursday, September 22. At this time, there are approximately equal hours of daylight and darkness as the sun crosses the equator.
Stocks couldn’t continue the one-month streak they started in July. Stocks came out of the gates quick in August, picking up where they left off in July but by mid-month, fears of both a recession and rising interest rates had spooked investors enough that the markets turned south, ending August in the red. For the month of August, the S&P 500 dropped 4%. For the year, it is down almost 17%.
Consumer prices are down across the board, which shows the Federal Reserve’s efforts are working. Hopefully, they won’t have to raise rates much more so we can have a soft landing and avoid a recession. The uncertainty of what the Fed will do is the biggest influencer on the markets right now.
Regarding jobs and wages, we’re back to the good news is bad news for the markets. Currently, unemployment is at record lows and wages are increasing. While this is good news, it means that the Fed will continue to bump up interest rates, which is bad news for stock prices.
We still have a month until Q3 earnings start to come out so the big mover of stock prices in the near-term will be the Fed meeting on September 21st.
Take a look at the Outlook section below to see what events could move the markets over the short term.
Bond prices pulled another U-turn and headed south in August. I think they might have finally figured out which way to go after the Federal reserve conference about a week ago.
The 10-year US Treasury note jumped above the 3% level, ending in August at 3.14%. The 30-year bond is at 3.25%, ending the month higher as well.
Buyers of individual bonds, especially high-yield, or junk bonds, have to do their research when selecting their purchases. Companies issuing bonds paying higher interest rates could be subject to default more easily if they are not managed well and are having a hard time making money in this economic environment. I would try to stick to bonds issued from high quality companies with strong cash flow and balance sheets, even though you will be getting a smaller interest payment.
Savings rates have been on a nice, steady climb for 10 consecutive months now, which is great news for savers and risk-averse investors. Although these rates can’t compete with inflation (yet), at least they are in the stadium somewhere! Plus, with the Fed almost guaranteeing that they are going to raise rates again in September, savers should expect an 11 straight month of higher interest rates for their savings and money market accounts.
Currently, the average savings account is paying 0.86%, up from 0.62% last month. At this rate, we could see a 1.00% rate by next month.
The 1-year CD interest rate is now averaging 2.34%, up from 1.94% last month. The 5-year CD rate is currently at 2.70%, up from 2.52% last month. They are getting to a pretty decent rate for risk-free returns, at least the one-year CD anyway.
Mortgage rates reversed course in August and rose to near their highest levels this year. Currently, the 30-year rate sits at 5.93%, up from 5.57% a month ago. Houses are staying on the market longer and sellers are lowering their offering price in most major markets. Also, refinancing mortgages has fallen off a cliff, not surprisingly. Everyone refinanced when rates were in the 2% – 4% range. Having said that, rates have crept back up close to their highs earlier in the year, but I can’t see them getting much higher just based on supply and demand in the housing market.
Oilprices continued to drop in August once again as businesses and consumers continued to adjust their spending and travel habits to combat inflation. Also, Russia is flooding the market with oil as it tries to pay for the ongoing war with Ukraine. The low hurricane activity this year is also helping keep prices lower. The price for a barrel of oil settled just above $89 for August, $9 less than it was at the beginning of the month. For the year, oil is still up almost 19%.
The drop in oil prices should continue as demand slows down from the effects of inflation. Any hurricane activity over the next couple of months or more shenanigans from Russia could negate the demand slowdown so expect prices to continue to be volatile.
Gasoline prices dropped significantly once again in August (again, thank you!). Regular unleaded gasoline is now averaging $3.83 per gallon, down $0.43 from last month. Arkansas now has the cheapest gas, at $3.33 a gallon. Hawaii has overtaken California with the most expensive gas at $5.30 per gallon. FYI, a year ago, we were paying $3.17.
Check out the prices at the pump in your area: AAA Gas Prices.
Outlook
Events on the horizon that could move the markets in the near term:
Russia Invasion of Ukraine: It seems like a stalemate over there, except for the fact that Russia continues to bomb nuclear reactor plants in Ukraine. Amidst the war, both countries are exporting their wheat crop, which is welcoming news since they are two of the largest exporters of wheat in the world. Besides the great toll on human life and the destruction of Ukraine, this war is creating an inflation crisis in Europe, particularly with energy prices. As we head into cooler weather, it could be trouble for many countries in Europe to keep warm.
Supply Chain Status: Shipping costs continue to retreat and port operations here in the states have begun to normalize. We still have a shortage of truck drivers and that’s a tough fix, in my opinion, because it is such a demanding job in terms of time away from home and the long hours behind the wheel. We will see how well the chain has repaired itself in the next few months as we head into the busy season for shipping: prepping for holiday shopping.
Fed & Inflation: The Fed held their annual conference in Jackson Hole, Wyoming last week. It is not considered an official Federal Reserve meeting where they decide on interest rate policy, but it still caused shockwaves in the stock and bond markets. Fed Chairman Powell was pretty forceful in his speech that they plan on continuing to tighten money supply, aka raise interest rates, to stave off inflation. It looks like the inflation that they are most concerned about is wage growth. Other prices, such as metals, food, energy, housing, autos, etc., have all dropped significantly since the beginning of the year. However, wages continue to go up and workers are continuing to quit jobs with no fear of not getting another one almost immediately and for higher pay. Of course, this is good for us but then we will keep buying stuff and then prices for everything will stay high. The Fed is tasked with trying to find the right balance. So far, I think they are doing a pretty good job. The final verdict won’t be in until later next year I would guess. Investors sticking with well-run companies with strong balance sheets will do well in this environment.
Tax loss harvesting (TLH) is a term used in the financial industry to describe strategies employed by investors to minimize their taxes due on any realized gains of investment sales for the year. Realized gains occur when you sell an investment at a higher price than when you bought it.
Before reading any further, please note that TLH only applies to investments in taxable accounts, not retirement accounts or any other tax-deferred accounts. That said, let’s take a look at what this harvesting is all about.
I think an example is the best way to understand how this strategy works:
Suppose you sold shares of XYZ earlier this year for a $10,000 profit, also known as a realized gain. Let’s say that you also have a stinker, ABC, in your account that is down $15,000 from when you bought it. You can sell ABC and now have a realized loss of $15,000. This will offset the $10,000 realized gain. It will also offset up to $5,000 of any other realized gains that you have this year. If you don’t have any other gains, you can apply $3,000 to reduce your taxable income and the remaining $2,000 of losses can be carried forward to next year.
In this example, you were able to avoid paying taxes on that gain of $10,000 by using the TLH strategy.
Most investors prefer to do this strategy towards the end of the year, but you can do it any time during the calendar year. I like to do it for my clients during the slow summer months because that is one less thing to worry about during crunch time in December.
I also want to share with you some do’s and don’ts when you are considering TLH:
Don’t sell losers just to offset gains. Make sure that the investment no longer fits with your investment objectives.
Considering #1 above, do maximize your tax savings by using TLH when you have short term capital gains, since they are taxed at your ordinary income tax rate, which may be much higher than the long-term capital gain tax rate.
Do sell losers if they no longer fit your strategy, even if you don’t have any gains to offset. You can always carry the losses forward to use in later years.
Don’t buy a substantially identical investment within 30 days before or after the TLH sale. If you do, this will disallow the loss.
Don’t ever consider any tax strategy, such as TLH, as the sole reason to buy or sell any investment. They should be incorporated into your investment decisions as part of your overall game plan.
Please let me know if you have any questions.
Joe Baker, CFP® Baker Asset Management, LLC joebaker@bakerassetmanagement.com
Stock options have a tough time trying to convince investors that they can be used to lower your portfolio risk. They are typically categorized as a high risk investment. But this is not always the case. The following talks about one way that we can use stock options to mitigate losses if stock prices fall. It is a strategy known as covered call writing and can help protect your portfolio while also generating some income. Here you go:
Writing covered calls is the strategy of writing (selling) call option contracts while at the same time owning an equivalent number of shares of the underlying stock. It is probably the most basic and most widely used option strategy by individual investors. Here’s how it works:
The option buyer pays you, the covered call writer, a premium for the right, not the obligation, to buy your shares or exercise the option on or before the expiration date, which is usually the third Friday of the month that the option expires.
When you think about it, covered call investing isn’t much different than simply buying and selling stocks, which most people are already doing and are already familiar with. The difference is when you write covered calls on stock that you already own, you agree to sell your stock at a specific price known as the strike price. The covered call that you sell generates income for you via an option premium that you pocket immediately (actually, it is deposited into your brokerage account the following day). This ability to generate income, over and above any dividends paid out by the stock that you own, is the key and the strength of covered call investing.
Now let’s look at a scenario where a covered call would be considered:
You just bought 500 shares of XYZ stock at $10 in May for a total investment of $5,000. You consider it a long term holding (hold for at least five years) but you do not expect the stock to significantly increase in value over the next two years. You can generate income from this stock by selling 5 XYZ call options with a strike price of $15 that expire in June. If the price of the option is $1.00 per contract, then the premium that you would receive is calculated as follows:
5 contracts x 100 shares per contract x $1.00 per contract = $500
As long as the XYZ stock price does not go above the $15 strike price before expiration date in June, you will keep the stock and pocket the $500 premium. This equates to a 10% return (120% annualized) on your original investment of $5,000. Additionally, you can now write another 5 covered calls on the same XYZ stock.
However, if the stock price rises above the $15 strike price at anytime before the expiration date in June, the call options can be assigned and you will have to sell your 500 shares of XYZ stock at $15 per share. This time, your profit would be calculated as follows:
$500 premium + $2,500 ($5 gain per share x 500 shares) = $3,000.
This equates to a 60% return on your original investment of $5,000. Now, you can take that $8,000 to buy XYZ stock again and write some more covered calls.
Here are the characteristics of the covered call strategy. Knowing these will help you make the best decisions on implementing your covered call program.
Best Time to Use
Though the covered call can be utilized in any market condition, it is best employed when you meet the following criteria:
Bullish on the underlying stock.
Feel that its price will not fluctuate substantially over the lifetime of the call contract.
Desire to generate additional income (over dividends) from shares of the underlying stock.
Want to provide a limited amount of protection against a decline in the underlying stock price.
Advantages
Generates income because you keep the premium received from writing the call regardless of what happens to the underlying stock.
Offers some protection from a decline in price of the underlying stock.
Lowers the overall risk of your portfolio.
Disadvantages
Places a ceiling on any additional gains in the underlying stock price.
Downside protection is limited (but still less risky than owning the stock without any covered calls).
This strategy doesn’t fully protect your stock investments if prices fall but it lessens the blow by providing income. Option strategies can be very confusing, especially if you are not using them every day, so if you have any questions, please feel free to contact me.
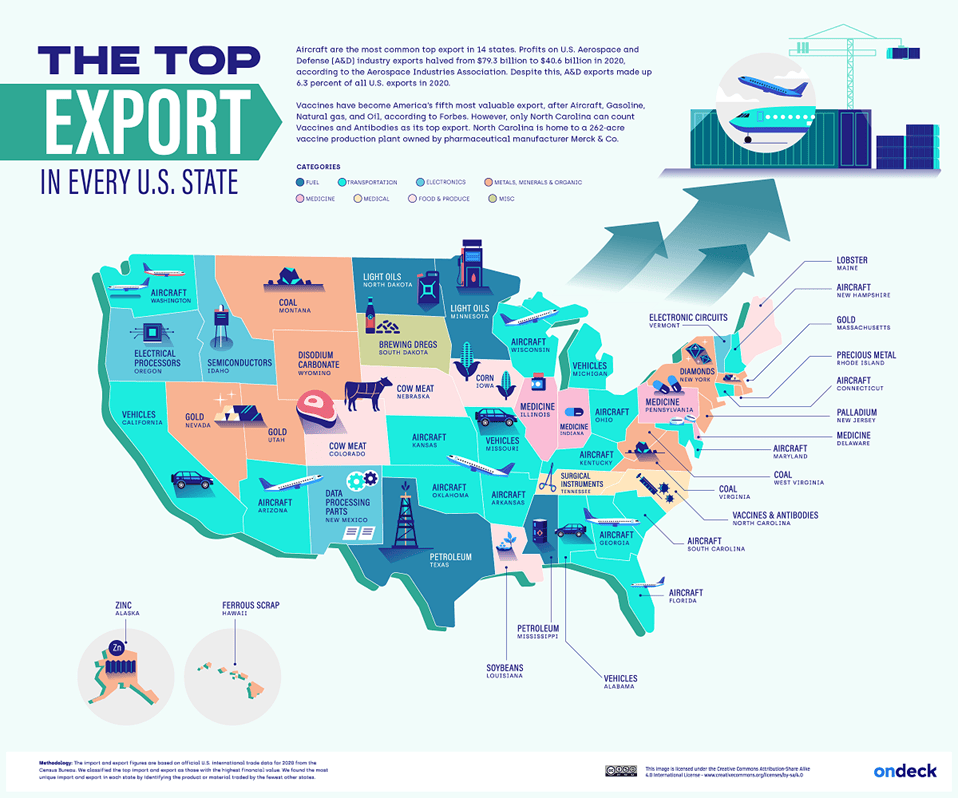
I came across this illustration while catching up on some industry reading. I think it is very interesting to see what each state is sending out to the world.
You could have guessed some states’ top exports without even looking, like oil for Texas and lobster for Maine. But it was suprising to see how many states have their top export in the aerospace industry. In fact, aircraft exports was the country’s second biggest export, behind only oil.
Then, there were some unique exports that would have been hard to guess, especially if you weren’t from those specific states. Here are a few that I would have never known:
South Dakota: Brewing Dregs – the sediment found in brewing beer! It’s used by farmers for use in animal feed.
Massachusets: Gold
New York: Diamonds
New Jersey: Palladium
Wyoming: Disodium Carbonate – It is used in the manufacture of detergents, soaps, and paper.
It will be interesting to see this map 10 years from now to see how industries have changed across the country. Particularly, I would be interested in seeing the states that currently have fossil fuels as their top export and finding if they were bypassed by other indsutries.