
I came across a couple of charts and tables recently that I wanted to share with you. I think they can help you put this dismal stock market in perspective and help you make more informed decisions regarding your investments.
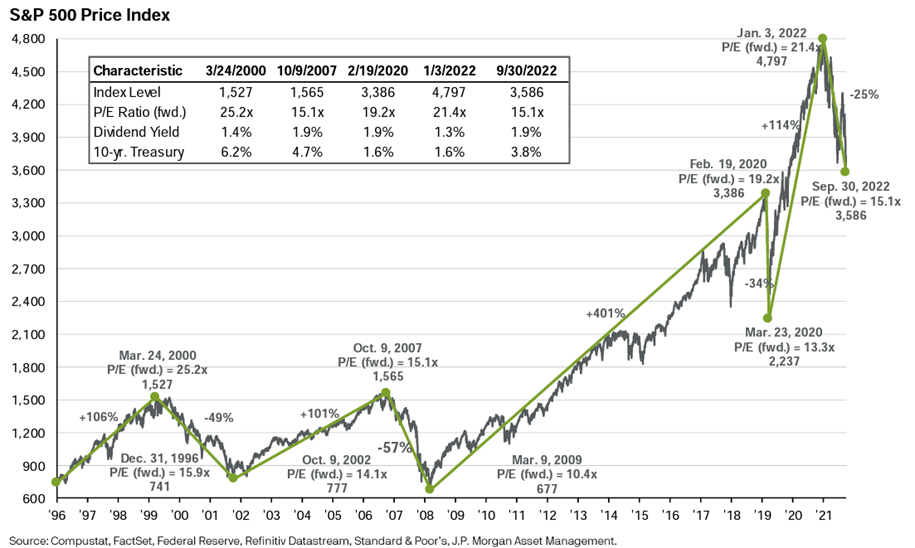
This first one is a graph that shows how the S&P 500 index has performed since 1996. You’ll notice that there have been four large downward moves in the S&P 500 since 2000 and the one that we are experiencing right now is the smallest of the four (and hopefully will stay that way!). The big picture takeaway from this chart is to remind you that these drawdowns occur periodically as part of a normal economic cycle. What causes them, i.e., the catalysts, are what typically change each time.
The following table gives us some hope that the stock market will eventually rebound.
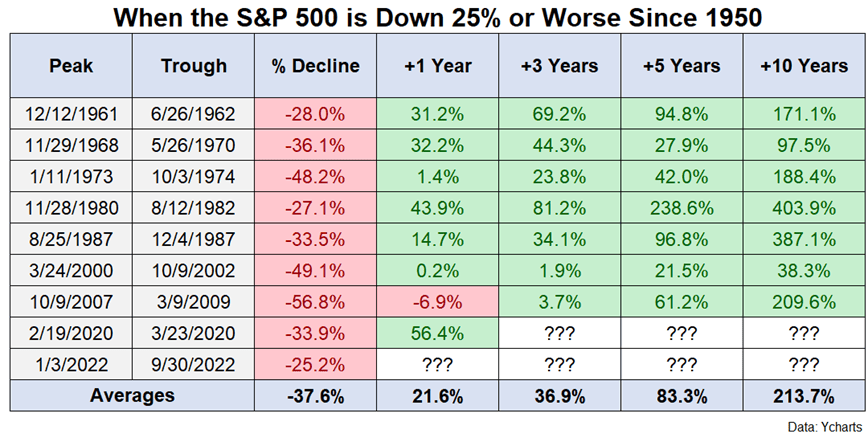
As you can see, after stocks have had a decline such as the one that we are experiencing, the return on investment has been pretty good looking at the 1-, 3-, 5-, and 10-year time periods after the decline had ended.
To summarize, these big drops in the stock market occur periodically (we’ve already had 4 this century) but pave the way for solid returns soon thereafter.
Please comment or send an email if you have any questions. Thanks!
Joe Baker, CFP®
Baker Asset Management, LLC
joebaker@bakerassetmanagement.com

