BAM Blog

Monthly Update – August 2022

Fun Facts about August

  • Birthstone: Peridot, spinel, or sardonyx
  • Flower: Gladiolus or Poppy
  • Zodiac signs: Leo and Virgo
  • August was named after the first emperor of Rome, Augustus. The month was previously called Sextilis (Latin for sixth). It became the eight month after January and February were added to the calendar.
  • August is the last of the summer months in the Northern Hemisphere. Its Southern Hemisphere equivalent is February.
  • Many cultures refer to August as the harvest month.

Stocks had their best month in July since 2020 with increases across all major stock indices. Catalysts for the rise include decent corporate earnings and signs of inflation easing. I think another big factor is the heavy negative investor sentiment. Investors are fearful and this usually is a good indicator of a market bottom. In other words, it is a good time to be buying stocks. That is, be greedy when others are fearful.

For the month of July, the S&P 500 popped up 9.2%. For the year, it is still down over 13%. Hopefully, this is the start of a nice comeback for 2022. We’re in the midst of the dog days of summer and the markets are typically very quiet until after Labor Day. Company outlooks are encouraging for the most part as Q2 earnings continue to come out. The conflict in Ukraine is still hurting the markets, particularly in Europe since Russia is pretty much their gas station. Here in the U.S., consumer prices have come down some to the relief of all of us. The stronger dollar is hurting our companies selling goods abroad but is making our imports cheaper. It’s also making a vacation to Europe or pretty much anywhere outside of the country a little bit easier on the wallet!

Take a look at the Outlook section below to see what events could move the markets over the short term.

Bond prices reversed course once again and headed up in July. The flip-flopping in bond prices is partially due to the uncertainty of the Federal Reserve’s response to inflation. We do have a somewhat clearer picture on their stance now (less aggressive in raising rates) that their July meeting is in the rearview window. Also, they don’t meet again until September so we will get a little reprieve while we wait for them to meet again.

The 10-year US Treasury note stayed below the 3% level, ending in July at 2.66%. The 30-year bond is at 3.02%, ending the month lower as well. Rates are staying low because investors are flocking to the safe haven of government bonds as recession fears continue to spook the stock market.

Savings rates moved higher for the ninth consecutive month. Once again, this is really good news for savers and risk-averse investors. Of course, these rates are still no match for the current inflation rates but at least we’re seeing some improvement. These increased saving rates are great, but we are probably going to see them start to level off towards the end of the year, especially if the Federal Reserve moves to a wait-and-see approach on raising interest rates.

Currently, the average savings account is paying 0.62%, up from 0.51% last month. We actually might make enough interest on our savings accounts this year that the bank will have to send a 1099-INT. These forms are only required to be sent out if you make more than $10 of interest annually.

The 1-year CD interest rate is now averaging 1.94%, up from 1.69% last month. The 5-year CD rate is solidly above 2% still and now sits at 2.52%, up from 2.38% last month. That said, I would rather buy some blue-chip stocks that pay 3% or 4% dividends, but at least now, CDs are getting a little more attractive for conservative investors.

Mortgage rates stumbled in July as demand waned for new mortgages as rates turned higher. Currently, the 30-year rate sits at 5.57%, down from 5.83% a month ago. Home sellers are slashing their offering prices and builders are seeing an increase in cancellations from new home buyers. As I said last month, this should come as no surprise due to the big increase in mortgage rates. We are just returning to a more normal housing market. Normal means a house is on the market for 1-3 months before selling and gets maybe a handful of offers, most of which are below the asking price. People are comparing 2022 to the 2008 financial crisis and that is just ridiculous. I might agree if homeowners start leaving their keys in the mailbox and walk away from their homes like they were back in ’08. Back to mortgage rates, they most likely have already peaked for the year and will level off even drop a bit more as demand continues to fall for new mortgages.

Oil prices continued to drop in July as businesses and consumers continued to adjust their spending and travel habits to combat inflation. The price for a barrel of oil settled just above $98 for July, $8 less than it was at the beginning of the month. For the year, oil is still up over 27%.

The drop in oil prices could continue as demand slows down from the effects of inflation. Any hurricane activity over the next couple of months or more shenanigans from Russia could negate the demand slowdown so expect prices to continue to be volatile.

Gasoline prices took a nosedive in July (thank you!). Regular unleaded gasoline is now averaging $4.26 per gallon, down $0.55 from last month. Texas now has the cheapest gas, at $3.76 a gallon. California has the most expensive at $5.64 per gallon, although Hawaii is not far behind at $5.48. FYI, a year ago, we were paying $3.17.

Check out the prices at the pump in your area: AAA Gas Prices.

Outlook

Events on the horizon that could move the markets in the near term:

  • Russia Invasion of Ukraine: Russia continues to push through Ukraine, albeit at a snail’s pace and at great cost to Russia, both financially and in lives lost. The sanctions against Russia are also taking a huge toll on the country and its citizens but Putin is just too stubborn to admit their invasion failed miserably. I’m sure that he will press on using his leverage as the main energy supplier to Europe to prevent any more sanctions from being imposed. Some good news did come out this past month: Russia and Ukraine struck an agreement to allow exports of their wheat crop to the world. This is big because Russia is the world’s largest exporter of wheat and Ukraine is the fifth largest.
  • Supply Chain Status: Shipping costs have been coming down recently for a couple of reasons: consumer demand has slowed due to higher prices, fuel costs have dropped significantly, and covid restrictions have been lifted in China’s ports. But now, we’re heading into the start of peak shipping season in August, and we have some new problems that are causing freight rates to reverse course and head higher: strikes by truckers and port workers have caused congestion at shipping nodes throughout the supply chain. Any delays in the supply chain usually means higher freight rates. Sustained higher freight rates ultimately means higher prices for the consumer, aka inflation. I don’t like it because then the Fed is going to be pressured to keep raising rates (see Fed & Inflation below). Hopefully, we can work through these supply chain kinks once again and keep the boxes moving.
  • Fed & Inflation: The Fed raised short-term interest rates another 75 basis points for the second meeting in a row. This pushed the prime rate to 5.50%, which is the basis for many consumer loans (mortgages, credit cards, autos). They did say at their meeting last week that their plan of tightening money supply is working to ease inflation, as can be seen in the drop in most raw material and energy prices. The markets took this as a sign that the Fed will ease up on the rate increases which should help stock prices at least until the next Fed meeting in September.

Joe Baker, CFP®

Baker Asset Management, LLC

joebaker@bakerassetmanagement.com
Has Inflation Peaked?

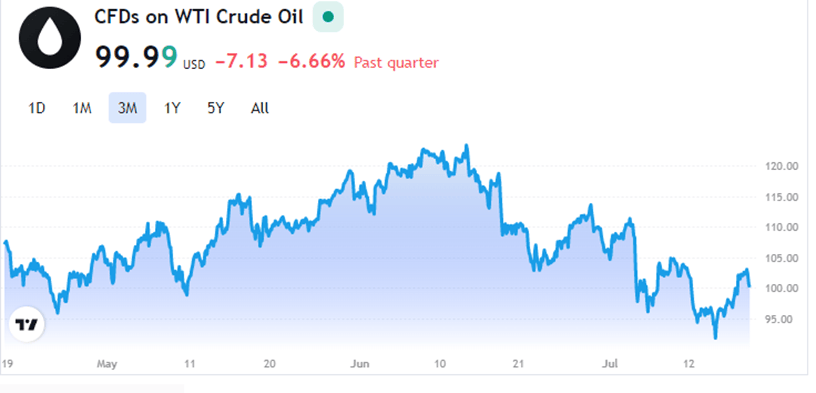
Certainly, the biggest drag on the stock market right now is inflation and the possibility of a recession as the Federal Reserve tries to slow it down. Most recently, though, several indicators are pointing to the possibility that inflation has already peaked this past June. The main driver of our current high inflation numbers have been energy prices, particularly diesel and gasoline prices, which contribute to the costs of almost every product that we use. The following chart shows the significant drop of the price of oil from its highs in June:

Another indicator that I like to look at are shipping costs. Shipping costs from Shanghai to Los Angeles has dropped 40% since peaking in mid 2021, and are down over 15% since the start of 2022.

Here some other prices that have dropped substantially recently:

  • Iron Ore prices have fallen nearly 50% from their highs in July 2021 and have fallen 25% since the start of June.
  • Copper prices have fallen nearly 30% from their highs in March 2022 and have fallen 20% since the start of June.
  • Aluminum prices have fallen 35% from their highs in March 2022 and have fallen 25% since the start of June.
  • Tin prices have fallen 50% from their highs in March 2022 and have fallen 23% since the start of June.
  • Cotton prices have fallen 40% from their highs in May 2022, with nearly all of that since a peak in early June.
  • Corn prices have fallen 25% from their highs in May 2022, with most of that since a peak in early June.
  • Wheat prices have fallen 40% from their highs in March 2022 and have fallen 23% since the start of June.
  • Lumber prices have fallen 60% from their highs in May 2021, 55% from the highs in March 2022, and modestly risen since the start of June.

Home prices have also started dropping as demand is being curbed by higher mortgage rates.

Of course, the Federal Reserve is looking at all of these numbers as well and such big price drops might give them pause on raising interest rates as furious as they have done in the recent past. Those higher rates are doing their job so they might want to pump the brakes a little so they don’t raise rates so much that they put us into a recession. We shall see soon enough.

Joe Baker, CFP®

Baker Asset Management, LLC

joebaker@bakerassetmanagement.com
No, Medicare Does Not Pay For Your Long-term Care Expenses

Seventy percent of Americans who reach age 65 will at some point need long-term care, whether at home or in an assisted care or nursing home facility, according to the U.S. Department of Health and Human Services.

The big problem is how to pay for that care.  Most people believe, incorrectly, that Medicare will pay for their long-term care expenses.  Medicare will only pay for the first 20 days.  The next 80 days you will have to pay $194.50 per day before any help from Medicare kicks in.  After day 100, you are on your own as far as paying for long-term care.

Medicaid, which is a totally separate program from Medicare, will pay for your long-term care but only after you spend down almost all of your assets.  You definitely want to avoid this situation if you can because it is financially and emotionally terrifying for your entire family.  Unfortunately, this option is the only option for the majority of Americans.  Solving this dilemma is a whole other topic.

You can self fund your LTC expenses but you’ll have to plan accordingly.  LTC can cost anywhere from $50,000 to $120,000 per year, depending on your location and the level of care that you’ll need.  As you can see, if you will need LTC for more than a few years, it can be financially devastating if not adequately planned for in advance.

Another way to plan for the eventuality of long-term care is to purchase long-term care insurance.  It is actually much more affordable than you might think.  Plus, once you realize you can easily spend your entire retirement nest egg on long-term care, it makes even more sense.

For example, a couple in their mid-50’s can get a long-term care insurance policy on each of them for about $3,700 total annual premium.  Keep in mind that there are many options to choose from when buying LTC insurance so you definitely want to do your homework.  The biggest factors in determining your premium amount are your health, current age, and the length of the benefit period.

LTC insurance is very complex so make sure that you talk to a licensed adviser so you fully understand all of the ins and outs.

The biggest problem with LTC insurance, or any insurance for that matter, is writing that premium check every month to pay for something that you hope you will never use.  But, when you consider that the average cost of a year’s stay in a LTC facility is about $100,000, cutting that premium check is a little less painful.

Planning for long-term care is probably the most avoided part of retirement planning but it could become the biggest obstacle in realizing your retirement dreams.  Please let me know if you have any questions.

Joe Baker, CFP®

Baker Asset Management, LLC

joebaker@bakerassetmanagement.com

Monthly Update – July 2022

Fun Facts about July

  • Birthstone: Red ruby
  • Flower: Water Lily and Larkspur
  • Zodiac signs: Cancer and Leo
  • The 4th of July falls on a Monday this year. Happy birthday USA!
  • July is, on average, the warmest month of the year in the northern hemisphere. Its southern hemisphere equivalent is January.

Stocks continued to drop throughout June as negative news continued to grab the headlines. As with most of this year, we still have a bunch of negative catalysts putting downward pressure on stock prices: high inflation, supply chain disruptions, Russian/Ukraine conflict, and the Fed raising interest rates.

For the month of June, the S&P 500 dropped about 8.4%. For the year, it is now down over 21%. That’s a bad six months. In fact, it’s the worst first half of a year since 1970. Will it continue or are we going to turn it around? If you watch or listen to the financial news, you would think the world is going to end next week. There seems to be no positive news out there. This is keeping investors scared and on the sidelines.

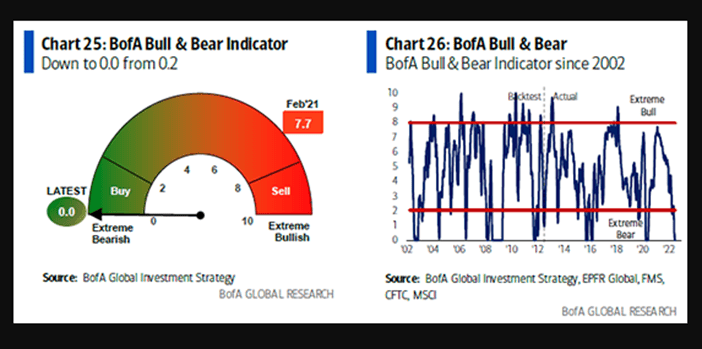
I thought this illustration below is an accurate depiction of investor sentiment right now.

The good news is that investor sentiment is a pretty accurate contrarian indicator for stocks, meaning when investors feel the worst, stock prices usually bottom out and start to rise. If the pattern on Chart 26 holds true, stock market investors should be pretty happy over the next couple of years.

Take a look at the Outlook section below to see what events could move the markets over the short term.

Bond prices reverted back to its downward trend in June after a move higher in May. With bond interest rates going up, they are becoming more attractive and will be bought, which will slow down the rate of increase in these rates.

The 10-year US Treasury note breached the 3% watermark during June but ended the month just below it at 2.98%. The 30-year bond is at 3.12%, ending the month higher as well but off its peak from the middle of the month. We could see these rates roll over and stay flat or even continue to drop as investors give up on stocks and seek the safety of government bonds.

Savings rates moved higher for the eighth consecutive month. This is really good news for savers and risk-averse investors. Of course, these rates are still no match for the current inflation rates but at least we’re seeing some substantial improvement. Hopefully, savings rates will continue to head up and narrow the gap between what banks charge us to borrow and what they pay us to hold our money.

Currently, the average savings account is paying 0.51%, up from 0.38% last month. We’re still not making much interest here, but it’s getting better, and we should see higher rates throughout the rest of this year.

The 1-year CD interest rate is now averaging 1.69%, up from 1.36% last month. The 5-year CD rate is solidly above 2% and now sits at 2.38%, up from 2.04% last month. I would still rather buy some blue-chip stocks that pay 3% or 4% dividends, but at least now, CDs are getting a little more attractive for conservative investors.

Mortgage rates resumed their march higher in June after a pause in May. Currently, the 30-year rate sits at 5.83%, up from 5.28% a month ago. Home sellers are seeing much less competition for their homes. Stats are showing about 1 in 4 homes are dropping their selling price, which indicates that some homes are getting no offers. This should come as no surprise with the large spike in mortgage rates this year. This is becoming more of a normal housing market than the last two years. Also, we will probably see mortgage rates level off here or even drop a bit as demand wanes for new mortgages.

Oil prices dropped in June as businesses and consumers tightened their belts to combat inflation. The price for a barrel of oil settled up just below $106, $9 less than it was at the beginning of June. For the year, oil is still up almost 50%.

The drop in oil prices could continue as demand slows down from the effects of inflation. Any hurricane activity over the next couple of months could negate the demand slowdown so expect prices to continue to be volatile.

Gasoline prices rose again at the pump in June. Regular unleaded gasoline is now averaging $4.81 per gallon, up $0.19 from last month. South Carolina now has the cheapest gas, at $4.32 a gallon. California has the most expensive at $6.24 per gallon. FYI, a year ago, we were paying $3.13.

Check out the prices at the pump in your area: AAA Gas Prices.

Outlook

Events on the horizon that could move the markets in the near term:

  • Russia Invasion of Ukraine: Russia defaulted on their debt for the first time since 1918. Their economy is in a freefall. But they are making progress against Ukraine, capturing some territory along the northeast border. Amidst all the death and destruction, both sides are looking to find a way to move one of their biggest export products: wheat. I believe they will get a deal done to allow their wheat exports to go out, since it would be a big humanitarian crisis if it was not able to reach the rest of the world, particularly many of our poorer nations. The quickest way out of this mess is a coup from within Russia to get Putin out of there. That would give us one less uncertainty in the markets.
  • Supply Chain Status: It’s been easier to get raw materials and finished products to market over the last month as China unlocks from Covid again and demand drops due to higher prices all around. The reduced demand should also allow the supply chain to take a breath finally and get back on track. Shipping and trucking rates have dropped considerably since earlier in the year. This should help in reducing prices at the consumer level.
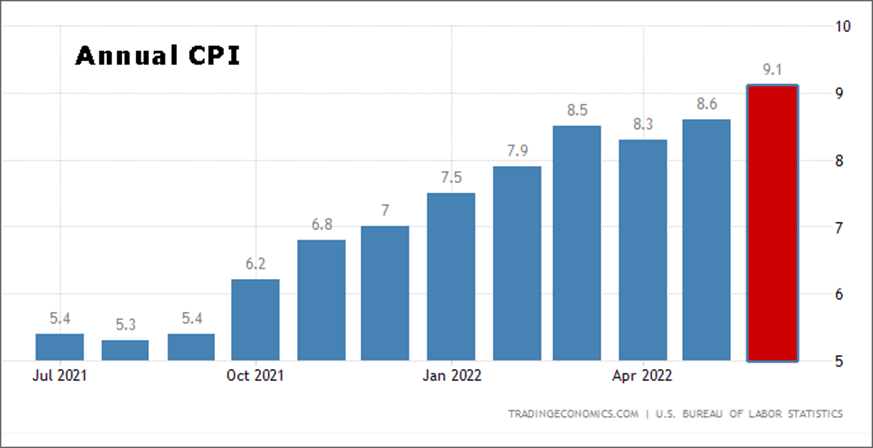
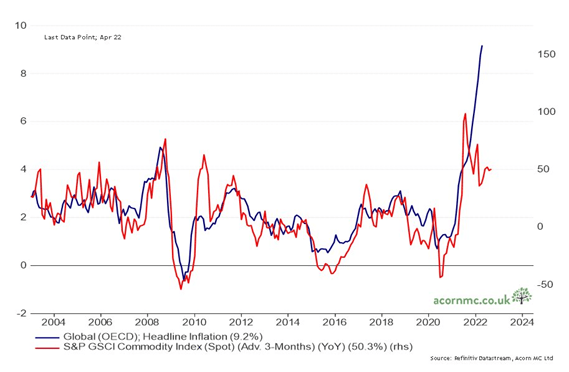
  • Fed & Inflation: The Fed raised short-term interest rates another 75 basis points. This pushed the prime rate to 4.75%, which is the basis for many consumer loans (mortgages, credit cards, autos). The Fed has talked about how their actions have already had an effect on prices and consumer spending. This is one of the reasons that stock markets had a nice rebound in the latter part of June. I think if raw material prices continue to drop and mortgage rates stay where they are, the Fed should have a wait and see approach on raising interest rates further. Their previous rate-raising actions have been working and they could sell more of their assets that they have on the books to tighten money supply without having to raise rates again. Money is already pretty tight thanks to the $10 trillion loss in stockholder value. This greatly reduced the collateral available to guarantee loans. The following graph shows where inflation is heading (down):

Joe Baker, CFP®

Baker Asset Management, LLC

joebaker@bakerassetmanagement.com

New RMD Formula Is Good For Retirees

The IRS has made changes to the Required Minimum Distribution (RMD) formula this year that will help retirees keep more of their retirement money in their retirement accounts.

For the first time in 20 years, the IRS has updated its actuarial tables that dictate how much a person is required to withdraw from his or her retirement accounts starting at age 72. The new tables, which now project longer lifespans, are used to calculate RMDs from individual retirement accounts and most qualified retirement plans.

Exceptions to the RMD requirement are Roth IRAs and, if you are still employed, the retirement plan account at your employer.

The reason that the new RMD formula is good for retirees is because the IRS raised the average life expectancy of us from 82.4 to 84.6. This means that they expect us to spread out our savings over a longer period of time. As a result, RMDs that begin in 2022 will be less than they were under the previous formula, which had been in place since 2002.

With smaller withdrawals required each year, more of our retirement assets can remain in their accounts. Smaller RMDs will lessen our tax liability and could potentially drop us into a lower tax bracket.

Calculating your RMD is relatively easy. First, look up the market value of your retirement account as of Dec. 31 from the previous year. Then, divide that value by the distribution period figure that corresponds with your age on the IRS Uniform Lifetime Table:

Appendix B. Uniform Lifetime Table

    
Table III
(Uniform Lifetime)
(For Use by: Unmarried Owners, Married Owners Whose Spouses Aren’t More Than 10 Years Younger, and Married Owners Whose Spouses Aren’t the Sole Beneficiaries of Their IRAs)
AgeDistribution PeriodAgeDistribution Period
7227.4977.8
7326.5987.3
7425.5996.8
7524.61006.4
7623.71016.0
7722.91025.6
7822.01035.2
7921.11044.9
8020.21054.6
8119.41064.3
8218.51074.1
8317.71083.9
8416.81093.7
8516.01103.5
8615.21113.4
8714.41123.3
8813.71133.1
8912.91143.0
9012.21152.9
9111.51162.8
9210.81172.7
9310.11182.5
949.51192.3
958.9120 and over2.0
968.4  

For example, a 72-year-old retiree with $500,000 in her IRA would divide $500,000 by her distribution period figure, which is 27.4. As a result, she would be required to withdraw at least $18,248 from her IRA in 2022.

Please let me know if you have any questions.

Joe Baker, CFP®

Baker Asset Management, LLC

joebaker@bakerassetmanagement.com
Who Gets Your Stuff When You Die?

This is a topic that almost nobody wants to think about: Who will inherit your money and other assets when you die? Talking about your beneficiaries means talking about death, specifically your death. Planning for your death may sound like worst thing ever but it is really an incredibly thoughtful act on your part and will help to minimize stress for your family and loved ones when you ultimately check out.

Beneficiaries are typically assigned to retirement accounts (401k, IRAs, etc.), life insurance and annuity policies, and transfer-on-death (TOD) accounts. If you don’t name any beneficiaries, these accounts will be passed on to your estate where they will go through probate based on your state laws. Probate is a legal proceeding that determines who will get your stuff. It is a lengthy, complex process that can be pretty expensive. If you have a will, probate will use that to determine how your assets get divvied up. If you don’t have a will, the state will do the best they can to determine who gets what. Suffice it to say, naming beneficiaries is the way to go. Getting this done before you pass away will make things simpler, quicker, and cheaper for your heirs during a very stressful time.

You should name both primary and contingent beneficiaries. The primary beneficiary is first in line to receive your assets. If the primary passes away before you, the contingent beneficiary will receive those assets, depending on your selection of per capita or per stirpes (see explanation below). You can have as many primary and contingent beneficiaries as you want.

Now, here is the most overlooked section of the beneficiary page: Choosing per stirpes or per capita.

Per stirpes (derived from the Latin word for roots) means that if a beneficiary dies before you die, the deceased beneficiary’s children inherit your money.

Per capita (Latin for each head) means that if a beneficiary dies before you die, their share of the inheritance goes back to the estate and gets divided among the other living beneficiaries.

Choosing which one of these for your beneficiaries is very important and should be considered carefully. In the most basic instance, you should elect per stirpes on your beneficiary designations to ensure that your heirs’ heirs receive their share.

I mentioned transfer-on-death (TOD) accounts earlier and just wanted to review what they are and when to use them. TOD is used for taxable accounts, since IRAs, annuities, and life insurance are already technically TOD accounts. Making a taxable account a TOD account allows you to assign beneficiaries to taxable accounts, thereby avoiding the probate process. This makes everything quicker and simpler for your heirs.

Finally, remember to review your beneficiaries at least annually and certainly after any major life events, such as death, divorce, marriage, adoption, etc.

Please let me know if you have any questions.

Joe Baker, CFP®

Baker Asset Management, LLC

joebaker@bakerassetmanagement.com
Stock Split Basics

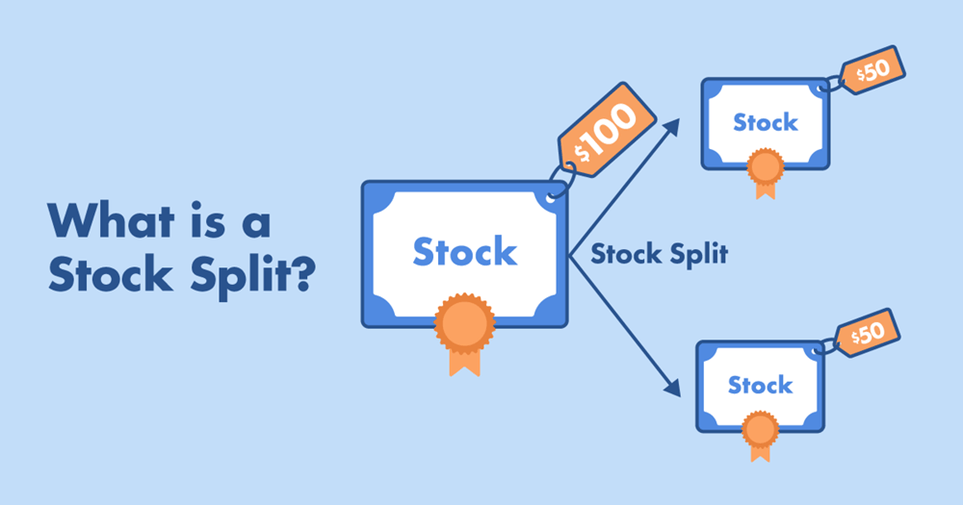
I thought stock splits would be a good topic to talk about since two of the world’s biggest companies are about to do a stock split. Amazon is doing a 20-for-1 stock split that will happen on June 6th. Google will also be doing a 20-for-1 stock split next month, on July 15th. A stock split changes the number of outstanding shares available to investors without changing the market value of the company. This is because the share price changes in proportion to the split ratio.

Here’s an example to illustrate this:

You own 100 shares of ABC stock with a share price of $10, a$1,000 value. If they have a 2-for-1 stock split, you will now have 200 shares at a price of $5 per share, still a $1,000 value.

Companies do stock splits mainly to change its share price to appeal to more investors, particularly individual, or retail, investors. They may also do splits to try and get into a certain stock index or to remain listed on a particular stock exchange.

Because Amazon’s split takes effect this Monday, if you own Amazon stock today, on Monday you will have twenty times as many shares in your account and the price will be 1/20th, or 5% of its closing price at the end of today. So, if today you own 1 share of AMZN, current price of $2,510, on Monday you will own 20 shares of AMZN at a price of $125.50 per share.

I suspect that both Amazon and Google are doing a split to get more retail investors to own their stock. Also, I believe they want to be a part of the Dow Jones Industrial Average Index (DJIA), the most popular index in the world. This index is a price-weighted index so reducing their share prices to be more in line with the prices of other companies in the index will give them a better chance of being included. This usually is a positive for a company’s share price when included in this index since many mutual funds and other institutional investors are obliged to buy it as part of their ownership mandates.

Finally, a quick mention of reverse stock splits. These are typically done to help a company stay listed on an exchange and usually are not a good sign for a company. This is when the stock price goes up and the number of shares go down. For example, if you own a 100 shares of ABC stock at $1 per share, a 1-for-10 reverse stock split means you will now own 10 shares at $10 per share. I usually run from companies that do reverse stock splits.

Please let me know if you have any questions.

Joe Baker, CFP®

Baker Asset Management, LLC

joebaker@bakerassetmanagement.com

Monthly Update – June 2022

Fun Facts about June

  • Birthstone: Pearl, the Moonstone, and the Alexandrite
  • Flower: Rose and the Honeysuckle
  • Zodiac signs: Gemini and Cancer
  • June 14 is Flag Day (U.S.). Be sure to raise the flag!
  • June 19 is Juneteenth (also known as Freedom Day or Emancipation Day). On this day in 1865, Union General Gordon Granger read the Emancipation Proclamation aloud in Galveston, Texas, effectively liberating enslaved people in the state, which had thus far been beyond control of the Union Army.
  • June 19 is also Father’s Day this year.
  • June 21 is the summer solstice, which heralds the start of summer in the Northern Hemisphere. It’s the day with the most hours of daylight, so enjoy! In the Southern Hemisphere, winter begins at this time.

Stocks went on another wild ride in May. The good news is that they ended up almost where they started at the beginning of the month. We still have all of the same catalysts moving the markets and none of them in a good way: high inflation, supply chain disruptions, Russian/Ukraine conflict, and the Fed raising interest rates.

For the month of May, the S&P 500 was essentially flat, just up 0.02%. For the year, it is still down over 13%. That’s not bad, considering where we were in the middle of the month.

It seems like the markets had priced in some of the worst-case scenarios regarding inflation and interest rates earlier in May, based on the bounce that we saw at the end of the month.

Seasonally speaking, this is the time when the big investors take a break from trading for the summer (sell in May and go away). This can cause some more volatility in price movement due to the lower trading volumes. It feels like we are already there after watching the markets over the past few months.

Take a look at the Outlook section below to see what events could move the markets over the short term.

Bond prices finally reversed course and headed higher in May. I can’t imagine that they have bottomed out but at least we are in a pause of some kind. We are in a weird situation right now because bond and stock prices are moving in concert with each other. Normally, they aren’t as correlated as they are right now. It also looks like investors are betting that the Fed may not be as aggressive as they thought earlier in the year because inflation looks to be peaking for many consumer items. Not seeing that with gasoline, that’s for sure.

The 10-year US Treasury note is now yielding about 2.84% and the 30-year bond is at 3.05%, both about the same as last month. This could be the pause that we were expecting after such a sharp runup in rates this year.

Savings rates moved higher for the seventh consecutive month. It looks like banks finally got the memo because savings rates really made some nice, big moves up. There is quite a time lag from when consumer borrowing rates go up and when consumer savings rates rise. Hopefully, savings rates will continue to head up and narrow the gap between what banks charge us to borrow and what they pay us to hold our money.

Currently, the average savings account is paying 0.38%, up from 0.33% last month. We’re still not making much interest here, but it’s getting better, and we should see higher rates throughout the rest of this year.

The 1-year CD interest rate is now averaging 1.36%, a big jump from 0.85% last month. The 5-year CD rate crested above 2% and now sits at 2.04%, up from 1.41% last month. I would still rather buy some blue-chip stocks that pay 3% or 4% dividends, but at least now, CDs are getting a little more attractive for conservative investors.

Mortgage rates finally took a breather and had their first monthly drop this year after four straight months of rising rates. Currently, the 30-year rate sits at 5.28%, slightly down from 5.42% a month ago. Existing home sales continue to drop but new construction homes are starting to get finished quicker as the supply chains repair themselves. Windows, cabinets, and pools seem to be some of the toughest items to get installed. Home prices are still increasing but at a lower rate than the past six months. The higher mortgage rates are starting to price out a bunch of home buyers which is causing sellers to start dropping prices or at least not having multiple offers.

Oil prices continued to move higher in May, making it the sixth straight month of higher prices. The price for a barrel of oil settled up just below $115, $10 more than it was at the beginning of May. For the year, oil is now up almost 53% and this upward trend in prices looks like it will continue.

The action by Europe to place an embargo on Russian shipments of oil, excluding shipments via pipeline, has put added upward pressure on oil prices worldwide. It is also affecting prices here in the U.S. even though we stopped importing Russian oil back in early March. This could definitely put a damper on the summer driving season here in the states.

Gasoline prices shot back up in May after taking a little breather in April. Regular unleaded gasoline is now averaging $4.62 per gallon, up $0.48 from last month. Kansas now has the cheapest gas, at $4.13 a gallon. California has the most expensive at $6.17 per gallon. We’re heading into driving season so don’t expect prices to drop down too much. FYI, a year ago, we were paying $3.05.

Check out the prices at the pump in your area: AAA Gas Prices.

Outlook

Events on the horizon that could move the markets in the near term:

  • Russia Invasion of Ukraine: Russia has become bogged down in their invasion of Ukraine. They are concentrating on smaller areas to control versus trying to capture the entire country. They are making some headway but at considerable costs. World sanctions are crippling the Russian economy and now Europe is stopping all shipping imports of oil (still receiving pipeline shipments). This has caused oil prices to rise sharply across the globe, which is the fuel that moves the world’s commerce. This will keep consumer prices going up in the near term. Also, about 8% of the world’s wheat is supplied by Ukraine and they are going to have a tough time trying to move it out of there while fighting a war. This is not good for the consumer, either. The good news is that the world can outlast Russia economically. Let’s just hope Ukraine can, not just economically but literally.
  • Coronavirus: This is really a supply chain issue now and I’ll be naming it as such going forward. Cases are dropping in Shanghai and other areas of importance in China for our imports. This is allowing those areas to get back to work. Of course, there will be a lag from now until actual product starts moving, but markets have already factored that into stock prices. Consumer prices are going to be higher, but the demand is still there from the American consumer so far. The main reason for that is the huge buildup of cash during the pandemic. Now, people want to spend it and they are, according to airlines, hotels, and restaurants as well as durable goods manufacturers (appliances, furniture, etc.).
  • Fed & Inflation: The Fed raised short-term interest rates 50 basis points, as expected. This pushed the prime rate to 4%, which is the basis for many consumer loans (mortgages, credit cards, autos). I think they are doing a good job so far trying to control inflation without pushing us into a recession. Most material prices (metals, lumber, etc.) are continuing to drop. However, oil, agricultural, and livestock prices are still quite elevated. So, we have a mixed reaction to higher rates with regards to raw materials. This will be a tricky road for the Fed to navigate. So far, the markets aren’t surprised by their moves yet. Let’s hope it stays that way.

Joe Baker, CFP®

Baker Asset Management, LLC

joebaker@bakerassetmanagement.com

Here’s Why You Shouldn’t Look At Your Investments Every Day

Part of a sound investment strategy is monitoring your investments to ensure that you are on track to meet your financial goals, such as retirement, college funding, home purchase, etc. But for many investors, monitoring their accounts has become a daily, or even more frequent, task in their typical day.

Studies have found that you should only check your investments about once every three months and there is a psychological explanation for this recommendation. Human beings are vulnerable to a natural tendency to avoid losses over making profits. This is a bias known as loss aversion. Behavioral scientists have found that the pain of a loss is more strongly felt than the pleasure of an equivalent gain. In my twenty-five years in the business, I can confirm that these findings are correct.

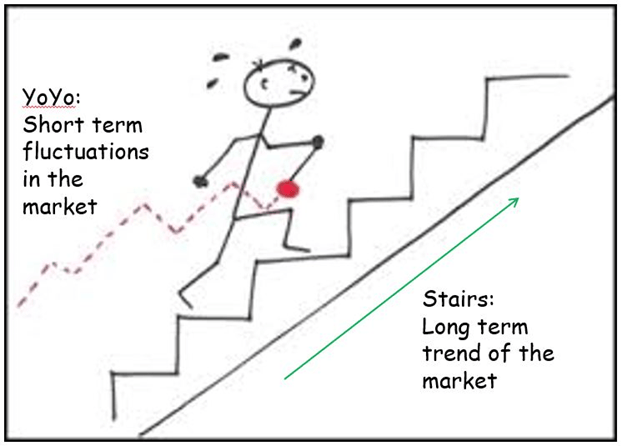
Research has also shown that investors are more likely to make investment decisions based on emotions when they check their investments every day. This can have detrimental consequences to their portfolio performance when looking long-term, such as with retirement accounts. This is because stocks, in general, have always moved higher when looking at longer time frames than just one day or month. This illustration is my go-to when trying to explain stock market action:

Right now, we are in a pretty decent decline in the stock market. Nobody knows when it will turn around, but it will, and when people least expect it. A recent example of a big market drop that reversed course was in early 2020 at the start of the pandemic. The S&P 500 lost 34% in less than a month as investors sold in a panic. As you know, the market rebounded quickly and hit all-time highs soon after. However, most of the panic sellers missed out on those gains.

I know it is tough not to check your investments, especially when access to this information is readily available 24/7. But, checking them every few months instead of every few days could keep you from making emotional knee-jerk decisions that could hurt your account performance in the long run.

Please let me know if you have any questions.

Joe Baker, CFP®

Baker Asset Management, LLC

joebaker@bakerassetmanagement.com
The Fed Just Raised Interest Rates – What That Means

Yesterday, the Federal Reserve Open Market Committee (FOMC) raised the federal funds target rate 50 basis points, or 0.50%. The main premise behind this big move is to try and cool down inflation that is running very hot lately. It makes money tighter, or, put another way, more expensive to get (borrow). How will this affect us as consumers as well as investors? Before we look at that, let’s review exactly what the Fed did.

The federal funds target rate is the rate banks charge each other when lending to one another. This is the basis that most rates that we are familiar with are calculated. For instance, the prime rate is the rate U.S. banks charge their best customers when lending to them. It is typically 3% plus the federal reserve funds rate, which is currently at 1%. So, the prime rate is now 4%. This is the foundation for mortgage rates, car loans, credit card rates, student loans, etc. Now that we know what was changed, let’s look at how it will affect us as both consumers and investors.

As consumers, borrowing money is going to cost more, plain and simple. Any type of loan with a variable rate, such as a variable rate mortgage, home equity line of credit, credit card, etc., has already gone up as of today. Any new loans will have a higher rate than if you took it out last week.

For savers, money market, bank savings accounts, and CD rates will go up, but unfortunately, not as much or as quickly. Well, anything is better than the 0.01% that I have been getting in my money market for the past 13 years!

For investors, it provides an alternative, i.e., bonds, for equity investors (stock market investors) to park their money and still get a decent return. Before this past six months, rates were so low since the great financial crisis that there was no place to go to but the stock market if you wanted a good return on your investment. Now, with the 10-year U.S. Treasury note paying about 3%, investors can at least get paid to wait before jumping back into stocks.

The Fed has a tough job on their hands: they have to tame inflation without pushing the economy into a recession. They already signaled that they will be bumping the fed funds rate higher throughout this year. They just have to monitor economic indicators vigilantly, so they don’t go too far. Good luck to them.

Please let me know if you have any questions.

Joe Baker, CFP®

Baker Asset Management, LLC

joebaker@bakerassetmanagement.com