

Fun Facts about August
- Birthstone: Peridot
- Flower: Gladiolus and Poppy
- Zodiac signs: Leo and Virgo
- August was named after Augustus Caesar (63 B.C.–A.D. 14). He was the first Roman emperor and grandnephew of the previous ruler Julius Caesar (who named July after himself).
- August is the last month of summer and the hottest month of the year in the Northern Hemisphere.
- August in the Northern Hemisphere is similar to February in the Southern Hemisphere.
- Friday, August 4th, is Great American Outdoors Day. Entrance fees are waived for all national parks that day.
Stocks had a strong July as the appetite for big technology, banks, and drug makers’ stocks continued. They started off the second half of the year the same way they finished the first half of 2023, with pretty substantial gains.
The S&P 500 rose 3.3% during the month of July and is now up 19.7% for the year.
There is still plenty of cash on the sidelines that was parked there at the beginning of the year in fear of a recession. So far, that has not come to fruition. In fact, the economy has been growing above market expectations and is taking stock prices with it. Investors can stay out of the stocks and still get a decent return investing in short-term bonds and CDs. But, if they want to have the potential to get double digit returns, they’ll have to get back into stocks. The prudent investor will have a little of both.
There’s still plenty of Q2 earnings coming out over the next few weeks but other than that, there aren’t many catalysts on the horizon that will move the markets (that we know of).
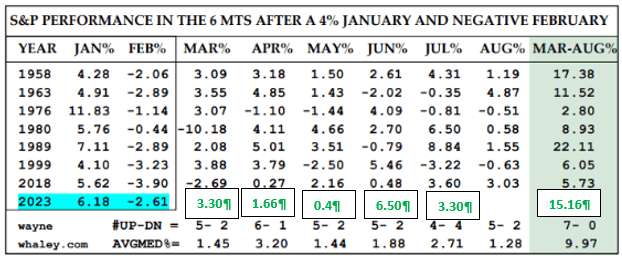
I’m leaving this table in the update through August to see if history repeats itself. We have one more month to go. There have been seven instances where a January with a 4% or higher return was followed by a negative February. 2023 is now the eighth. For each one of these years, the following six months had an average gain of almost 10%. Will 2023 keep this undefeated streak going?
Take a look at the Outlook section below to see what events could move the markets over the short term.
Bond prices headed lower in July, especially after a strong GDP report that came out at the end of the month. This helped shift the yield curve a little bit from a highly inverted curve towards a more normalized curve where long-term interest rates are higher than short-term rates.
The 10-year US Treasury note yield moved higher again in July, closing the month at 3.96%. The 30-year bond yield did the same, closing the month at 4.01%. It’s nice to finally see the 30-year bond yield higher than the 10-year bond yield. That said, these yields continue to remain below the yields of short-term treasuries. For example, the 6-month T-bill is currently yielding 5.50%, confirming a strong inversion of the yield curve and one of the best indicators of an impending recession. However, the gap is narrowing and if the Fed holds off on raising short-term rates for a while, we could see the yield curve revert back to its normal shape.
Bond buyers should continue to focus on bonds with short-term maturities. I would keep maturities under 18 months and just plan on holding these bonds to maturity. That way, you won’t have to worry about selling at a discount if interest rates head higher.
Savings rates continued to drift higher in July once again in response to the Federal Reserve raising short-term rates. Brick and mortar banks are having a tough time trying to match the rates that the online-only banks are offering. This could spell trouble for those smaller, regional banks that lent out mortgages in the 2-3% range a few years ago. They are losing money on those loans right now and could exacerbate their shrinking profit margins when they have to raise their depositors’ savings rates to help retain those customers. This is all good stuff for risk-averse investors and for our emergency reserves accounts. But do your research if you plan on investing in the smaller, regional banks.
The data for the average savings and CD rates was not accurate at the time of this writing so I don’t have those numbers or the chart. However, I can tell you that I am seeing FDIC-insured savings accounts online with rates as high as 4.80%.
The 1-year CD interest rate is hitting close to 5.40%. The 5-year CD rate high watermark right now is close to 4.65%. These rates are still inverted, just like the yield curve, meaning they are paying a higher rate to borrow your money for a shorter time period, which isn’t normal. These yield inversions are lasting longer than normal and have a lot to do with the Federal Reserve continuing to hike short-term rates as well as recession fears keeping pressure on long-term rates. That said, if you’re looking for a place to park your savings or emergency spending money, just buy short-term CDs, 1 year or less, and reevaluate when they mature. Keep the total under $250,000 per person at any one bank to ensure you are fully covered by the FDIC. CDs have become a nice alternative for risk-averse investors and have drawn money away from stocks because of their relatively high rates that carry virtually no risk.
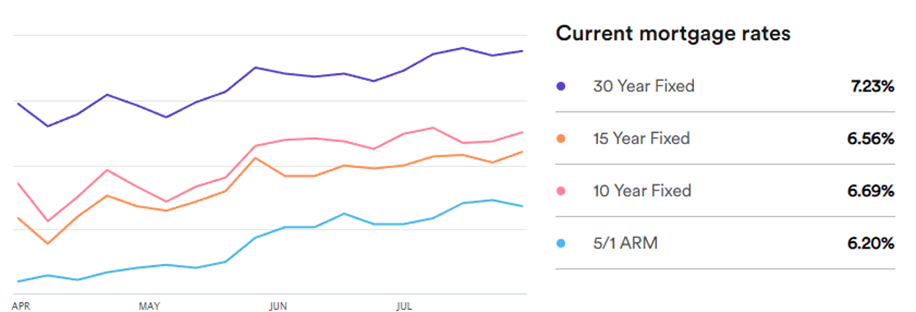
Mortgage rates remained above the 7% level once again in July as the Fed’s strategy really sinks into the consumer lending arena. Currently, the 30-year rate sits at 7.23%, a bit higher than what it was a month ago, at 7.10%. Nobody with a 2-4% mortgage rate is moving that doesn’t have to move. If they are, they are going to be downsizing and paying cash. This bodes well for homebuilders. Also, home building material prices have come down quite a bit, which will help both the builders and the home buyers.
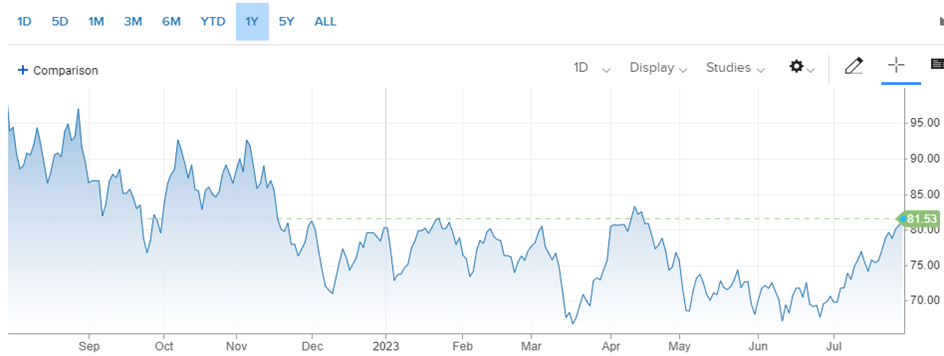
Oil prices headed higher in July with confidence, reaching prices that we haven’t seen since this past April. Demand appears to be increasing around the world that is more than offsetting the slowing Chinese economy. Also, we still have the big unknown that is Russian oil output. For the month, the price for a barrel of oil settled around 81.50, up from $70.46 at the beginning of July. Prices have breached the upper limit of the goldilocks range of oil prices ($55 to $70 per barrel range), so we’ll see if that puts some pressure on consumption here in the U.S. as well as worldwide.
Here’s a look at the one-year chart for U.S. oil. It looks like we may have bottomed out for the year:
Gasoline prices reversed their two-month drop and headed higher in July. It appears the rise is mainly due to seasonal demand (peak driving season). Regular unleaded gasoline is now averaging $3.78 per gallon, up $0.21 from last month. Mississippi has the cheapest gas for the fourth month in a row, at $3.25 a gallon. California is back on “top” with the most expensive gasoline at $5.00 per gallon. FYI, a year ago, we were paying $4.22.
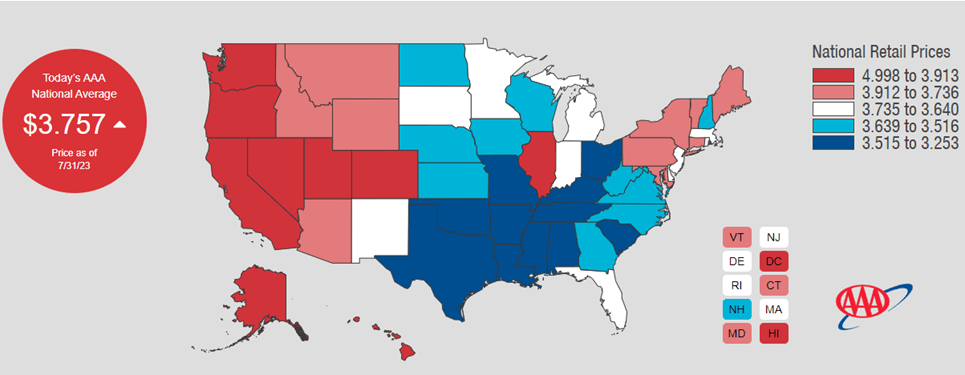
Check out the prices at the pump in your area: AAA Gas Prices.
Outlook
Events on the horizon that could move the markets in the near term:
- Fed & Inflation: The Federal Reserve raised rates 25 basis points this past month after a pause in June. The rate increases are having their desired effect on our economy as evident in the most recent data. I would think that we are at a place now where rates can stay put for a little bit and we can see how inflation reacts. The Fed doesn’t need to strong-arm it and drive us into a recession when it is unnecessary. The market believes that they are done raising rates this year so if they continue to bump them up, it could force stocks and even some bonds into a reversal downward.
Joe Baker, CFP®
Baker Asset Management, LLC
joebaker@bakerassetmanagement.com

