
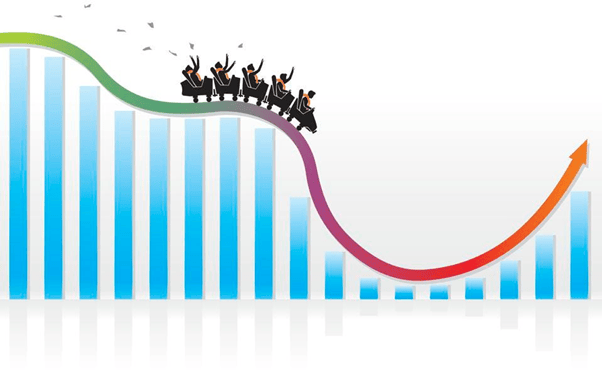
It would be nice if your investing journey was always a steady uphill march. In reality, it’s more of a sometimes run/sometimes crawl with plenty of downhill moments along the way. In spite of the obstacles, over time, the path typically trends upward. The bumps of stock market volatility are an inescapable part of the investment experience, but with some context, they don’t have to be so scary.
Here are some interesting stats that should help you sleep better at night if you are investing for the long term. For me, that typically means that you don’t plan on using your invested money for at least 5 years.
Historically, the glass has been more than half full when it comes to stock market returns. If you’re worried about the next market crash, remember that markets have been positive more often than not. In fact, stocks have turned in a positive return 64 out of the last 84 calendar years, which means they’ve been on the rise 76% of the time.
Long-Term Investors Have Historically Seen Less Volatility
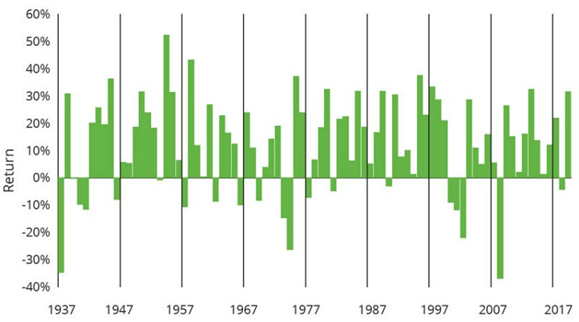
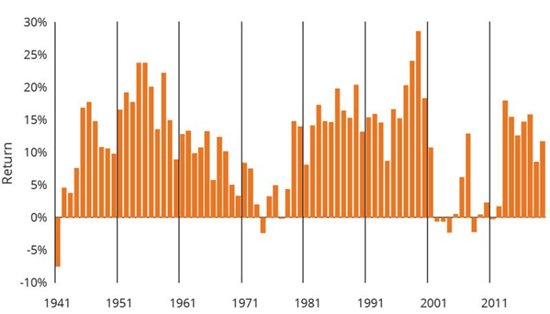
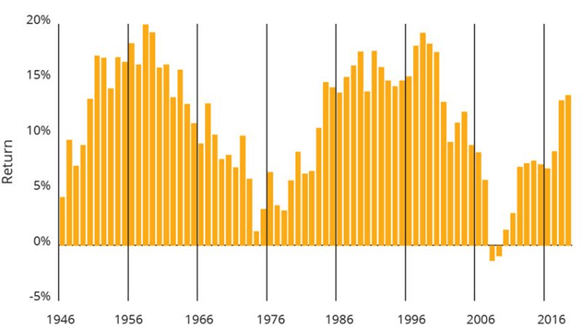
Each of the charts below shows the investment results for the S&P 500 Index for different lengths of time. The longer an investor holds stocks, the greater the potential for an overall positive return.
One-Year Holding Periods (Jan. 1, 1937–Dec. 31, 2020)
Stocks were up 76% of the time—64 up periods, 20 down
Five-Year Holding Periods (Jan. 1, 1937-Dec. 31, 2020)
Stocks were up 90% of the time—72 up periods, 8 down
Ten-Year Holding Periods (Jan. 1, 1937-Dec. 31, 2020)
Stocks were up 97% of the time—73 up periods, 2 down
The big thing to take away from this is that patience pays off when it comes to investing. If you know your time horizon (how long you can invest before needing that money), you can invest accordingly without having to worry about the day-to-day gyrations of the markets.
Please let me know if you have any questions.
Joe Baker, CFP®
Baker Asset Management, LLC
joebaker@bakerassetmanagement.com

