
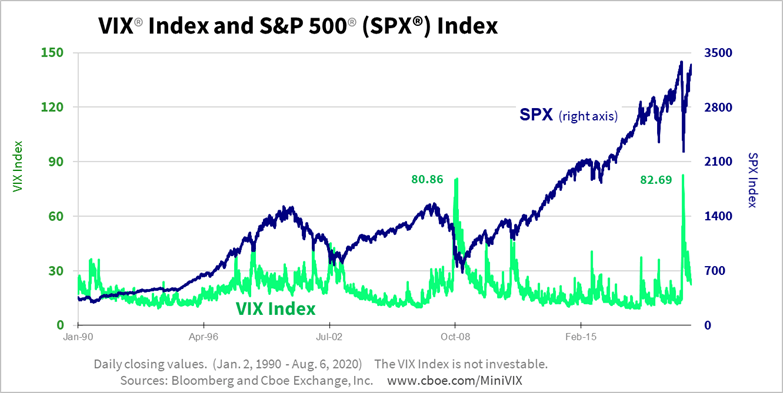
One of the metrics that I like to look at when assessing market risk is the CBOE Volatility Index, more commonly known as the VIX. The VIX measures the level of fear, anxiety, and/or uncertainty in the stock market. Technically, it looks at the options pricing of the S&P 500 index into the near future (about a month). When investors buy a lot of call options, meaning they expect the stock market to go up, the VIX drops. Conversely, when a lot of put options are bought, meaning people expect the stock market to drop, the VIX rises.
Of course, like everything else on Wall Street, there is a saying for the VIX: “When the VIX is high, it’s time to buy. When the VIX is low, look out below!” You’re probably thinking that this doesn’t make sense. A high VIX means there are a lot of pessimistic investors and so it would be bad for stocks. This is true but it is also true that the herd is usually wrong, so the VIX is normally interpreted as a contrarian indicator. This means when everyone is fearful, a high VIX, it’s probably not a bad time to buy stocks and vice versa.
Right now, we have a VIX of about 24, a little bit higher than what most investors consider a neutral VIX of 20. This makes sense because there is still some uncertainty in the market due to the pandemic and the new administration in DC.
Using the VIX as part of your big picture view of the market’s risk is a useful data point to help with your portfolio management. Please let me know if you have any questions.
Joe Baker, CFP®
Baker Asset Management, LLC
joebaker@bakerassetmanagement.com

