Monthly Update – Novemeber 2021

Fun Facts about November

  • Birthstone: Topaz and citrine
  • Flower: Chrysanthemum
  • Zodiac signs: Scorpio and Sagittarius
  • In the original Roman calendar, November was the ninth month of the year. It got its name from the Latin word “novem” which means nine. However, it became the eleventh month when the Romans added in January and February to the start of the year.
  • November’s equivalent in the Southern Hemisphere is May.
  • November 1 is All Saints’ Day.
  • November 2 is Election Day (U.S.).
  • November 7 at 2 A.M. is the end of Daylight Saving Time. Set your clocks back one hour on Saturday night at bedtime!
  • November 10 is United States Marine Corps birthday.
  • November 11 is Veterans Day.
  • November 25 is Thanksgiving Day.

Stocks bounced back from a rough September and resumed their upward trajectory in October. The S&P 500 gained 6.8% for the month and the index is now up 22.8% for the year. That is very impressive, considering the negative backdrop caused by the pandemic, rising consumer prices, and supply chain snafus.

We are in the midst of Q3 earnings season and most companies are reporting earnings that are beating analysts’ expectations, another catalyst for rising stock prices. As far as future revenue and profit outlooks go, most companies see the current supply chain issues resolving themselves by spring of 2022. Still, for the holiday shopping season, there are going to be a lot of empty shelves this year as literally tons of goods sit off our coasts.

Covid is off the front-page news but continues to impede the economic recovery, more with vaccine mandates and the stiff resistance to comply. Still, even as we have reached 5 million deaths worldwide due to Covid, we are seeing a steady drop in hospitalizations and deaths here in the states.

Seasonally, we are entering that time of year where stocks have consistently performed well. The November through April timeframe has historically been the best time of the year to be invested in the stock market. We will see if that holds true as the market gets pushed and pulled towards the end of the year.

Take a look at the Outlook section below to see what events could move the markets over the short term.

Bond prices of nearly all flavors fell again in October as inflation continued to pop up across most industries. Still, the Fed doesn’t look like it’s going to raise rates any time soon. They will stop buying government bonds and other securities, in other words, start tapering, to tighten up the money supply, which should cause rates to rise. I think the plan is to taper purchases through the middle of 2022 and then start raising rates, if needed. This action by the Fed will cause bond prices to drop and their yields to rise. So, please be cognizant of this when buying bonds with a maturity date greater than 1-2 years. In this type of interest rate environment, you can expect to lose principal unless you hold the bonds to maturity.

The 10-year US Treasury note is now yielding about 1.6% and the 30-year bond is almost at 2%, both about the same from last month. The path of least resistance for these rates is up, so expect these yields to rise and their respective bond prices to drop as the fed pumps the brakes on buying so many of these bonds every month.

Interest rates were flat in October. CD, money market, and savings account rates are still incredibly low. These rates should move higher over the rest of the year, but the savings rates will most likely still be too low to keep up with inflation. They certainly won’t rise as much as debt service rates, such as credit card interest rates.

Currently, the average savings account is paying 0.28%, just a smidge lower than last month’s 0.29% average. Although safe from market fluctuations, putting all your eggs in a savings account is not the best bet, especially if you need to grow your account value. Plus, you have to pay taxes on that interest. I do expect these rates to start inching up over the next year.

The 1-year CD interest rate is now averaging 0.46%, the same as last month. The 5-year CD rate remained flat as well, at 0.73%. You’re certainly not getting rich owning these. Hopefully, these rates will continue to head higher over the next few months.

Mortgage rates saw a nice little bump up as everyone prepares for the Federal Reserve to act on taming inflation. Currently, the 30-year rate sits at 3.14%, up from 3.03% one month ago. This rise in rates was certainly expected and more increases should be on the horizon. Still, historically speaking, mortgage rates are still near all-time lows, which will continue to help the housing industry, which is having an amazing year.

Oil prices accelerated their move higher in October as demand picked up due to the pandemic recovery. The price for a barrel of oil went up by over 11% to settle at $83.57 at the end of the month. Prices for the year are up over 73%. It’s hard to believe that oil was selling for negative $40 (that’s right, -$40) a barrel back in April 2020!

OPEC is not in any hurry to increase oil production and who can blame them. I’m sure they want to maximize their profit while they can. But this will only accelerate the inevitable acceptance of electric vehicles and clean energy fuels to replace fossil fuels as the standard energy source for so many industries. Of course, this transition won’t happen overnight, but the writing is certainly on the wall for fossil fuel producing countries and companies.

As expected, gasoline prices moved up in unison with oil prices this past month. Prices at the pump are averaging about $3.40 per gallon, about 21 cents higher than a month ago. Oklahoma has the cheapest gas right now, at $3.01. California has the most expensive at $4.61 per gallon. FYI, a year ago, we were paying $2.13.

Fuel prices are high but, as the saying goes, the best cure for high fuel prices is high fuel prices.

Check out the prices at the pump in your area: Gas Buddy.

Outlook

Events on the horizon that could move the markets in the near term:

  • Infrastructure Bill: Finally, it looks like The House of Representatives will vote on this bill some time this week. Sectors that could benefit from this bill passing are clean energy, building materials, and electric vehicle stocks. Although these sectors have been performing well already in anticipation of this legislature getting approved, we still should see a nice bump in stock prices in these industries.
  • Coronavirus: The pandemic has left the front-page news cycle once again as both cases and deaths have continued to drop across the country over the past month. Sadly, we are still averaging about 1,400 deaths per day, upping our death total to near 750,000. Only 1% of these deaths occurred in people who were fully vaccinated, according to the CDC. This amazing stat should convince anyone who is skeptical of the vaccine to get the shot. The vaccination rate slowed down yet again in October, which now shows that only about 67% of the U.S. population has received at least one dose, up from 65% last month. New vaccine mandates around the country are being met with stiff resistance so these numbers may not improve any time soon. If this is the case, people who were vaccinated and/or infected early in 2021 will lose their immunity and will be vulnerable again, creating a vicious cycle. Eventually, we will break the cycle, either by convincing more people to get vaccinated or by more people getting infected, or most likely, both.
  • Fed & Inflation: Fuel and material prices continue to rise, albeit at a slower pace than in the past few months. These price increases are being fueled by both a huge supply/demand imbalance (heavy on the demand) and major disruptions to the global supply chains. With this backdrop, the Fed might act quicker than expected, raising short term rates to curb inflation. They aren’t expected to mess with rates until mid-2022, but things could change without notice, especially as the economy continues to expand from the pandemic’s grip. This is something that investors should monitor closely, in my opinion, since the current low-interest rate environment has been providing a solid floor for stock prices over the last several years.

Joe Baker, CFP®

Baker Asset Management, LLC

joebaker@bakerassetmanagement.com

Can We Fix Social Security? {Yes!}

I was checking out the 2021 Annual Report issued by the Social Security Board of Trustees recently and wanted to share some of the projections that the board summarized in their report. The good news is that the bad news can be fixed if Congress wants to fix it.

Before we look at what Washington can do to fix this program, let’s look at a few highlights (lowlights may be a better word) from the report.

  • There are actually 2 trust funds: Old Age and Survivors Insurance (OASI) fund and the Disability Income (DI) fund. On your pay stub, these are combined and referred to as OASDI.
  • The OASI Trust Fund, which pays retirement and survivors benefits, what we typically refer to as social security, will be able to pay scheduled benefits on a timely basis until 2033. At that time, the fund’s reserves will become depleted and continuing tax income will be sufficient to pay 76 percent of scheduled benefits.
  • The DI Trust Fund, which pays disability benefits, will be able to pay scheduled benefits until 2057. At that time, the fund’s reserves will become depleted and continuing tax income will be sufficient to pay 91 percent of scheduled benefits.
  • Currently, earnings up to $142,800 are taxed for Social Security (OASDI) benefits.

Here is what the Social Security Board of Trustees concluded from this report:

Lawmakers (Congress) have many policy options that would reduce or eliminate the long-term financing shortfalls in Social Security and Medicare. Lawmakers should address these financial challenges as soon as possible. Taking action sooner rather than later will permit consideration of a broader range of solutions and provide more time to phase in changes so that the public has adequate time to prepare.

So, the good news is that there is that there is still a little cushion in the trusts.  As the board stated, if the government takes action now, it will be a lot less painful than if we wait until it’s all gone.

Now, let’s see what actions Congress can take that are relatively painless and good for everybody, not just their party:

  • Remove the income cap, currently $142,800, that is subject to OASDI payroll tax.  Some estimates show that eliminating the cap next year would mean the trust fund reserves would be depleted in 2057 instead of 2033.
  • Another solution is means testing.  This means that people who have an income over a certain level would be phased out of getting any benefits.  I’m pretty sure that millionaires and billionaires can probably get by without their social security check every month.

Using these 2 solutions could keep the OASDI trusts from drying up and will help the people that truly rely on their social security check to live, which is more people than you can imagine.

These are simple solutions that, I believe, would have bipartisan support in both the House of Representatives and the Senate. Unfortunately, if past performance is any indication, I am pretty certain that they won’t do anything until the eleventh hour, which means about December 2032.

Please let me know if you have any questions.

Joe Baker, CFP®

Baker Asset Management, LLC

joebaker@bakerassetmanagement.com

How To Max Out Your Retirement Plan Contributions Before End Of Year

We are already in the middle of October and the end of the year will be here before we know it. Now is the time to check your paystub and make sure that you are on course to max out your employee contributions to your employer-sponsored retirement plan.

I just want to point out that this information pertains to W-2 employees that participate in a retirement plan at work, such as a 401k, 403b, or SIMPLE IRA. If you are self-employed or a 1099 contractor, you most likely have some type of self-employed retirement plan, like a Simplified Employee Pension (SEP) plan or IRA. For these plans, you have until the date that you file your tax returns to make the contributions.

Before doing anything, check your latest paystub to determine how much you have contributed to your retirement plan year-to-date. Also, check out how much you contribute per pay period. Pay periods are typically every two weeks. If you are salary based, this amount should be the same each pay period. Then you can calculate how much you will contribute for the rest of the year.

Using the 2 week pay period as an example, if you look at your pay stub for the pay period ending this week, 10/15/2021, you can take that contribution and multiply it by 5 (number of remaining pay periods in 2021) and then add it your contributions year-to-date to figure out your total employee contribution for 2021. If this amount is less than the max contributions allowed in the table below, you can update your contribution rate on your retirement plan’s website or contact your payroll department to make the change.

Here are the maximum employee contributions in 2021 for the most common retirement plans:

 401k403bSIMPLE IRA
 2021 max contribution$19,500$19,500$13,500
    
Catch up amount if over age 50 in 2021$6,500$6,500$3,000

For example, if you are age 52, you can contribute a total of $26,000 of your pay to your 401k. There can be some variations to the general rules, depending on your plan documents, so be sure to check with your employer.

Please let me know if you have any questions.

Joe Baker, CFP®

Baker Asset Management, LLC

joebaker@bakerassetmanagement.com

3 Important Tax Deadlines Coming Up on October 15th

This is more of a public service announcement than anything, but I wanted to make sure that you were aware that Friday, October 15, 2021, will mark three important tax deadlines for tax year 2020:

Here they are:

■  Final Deadline for Individual Federal Income Tax Returns: the nationwide final deadline for filing an individual federal income tax return (Forms 1040, 1040A, 1040EZ) for tax year 2020 after having filed for an extension.

For more information, go to When, How, and Where to File on the IRS website.

■  Removal of Excess (ROE) and Recharacterization Deadline: the processing deadline for tax year 2020 Removal of Excess (ROE) and Recharacterization requests, in accordance with an automatic extension granted by the IRS. We will process all requests received in good order by close of business Friday, October 15 on a best-efforts basis; however, we encourage you to submit all requests as soon as possible to ensure processing for tax year 2020.

Any Prior Year Removal of Excess request(s) processed after the deadline will be reported to the IRS as an after-tax filing. Recharacterization requests received after the deadline will not be processed, in accordance with IRS regulations.

Requests must be received in good order for processing.

If a new IRA is being established to facilitate a Recharacterization, the new account forms must be received in good order.

■  SEP and SIMPLE IRA Contribution Deadline: the postmark deadline for Qualified Retirement Plan (QRP), Simplified Employee Pension (SEP) IRA, and Employer Savings Incentive Match Plan for Employees (SIMPLE) IRA Prior Year Contributions, in accordance with an automatic extension granted by the IRS.

Please let me know if you have any questions.

Joe Baker, CFP®

Baker Asset Management, LLC

joebaker@bakerassetmanagement.com

Monthly Update – October 2021

Fun Facts about October

  • Birthstone: Opal & Pink Tourmaline
  • Flower: Calendula, aka Marigold
  • Zodiac signs: Libra and Scorpio
  • October was named after the Latin word ‘octo’ meaning “eight”. This is because October was originally the eighth month of the year. It was only the eighth month until July and August were introduced to the Roman calendar by Julius Caesar and Augustus and it became the tenth month in the year.
  • October’s equivalent in the Southern Hemisphere is April.
  • Columbus Day is always on the second Monday in October. This year, that day is Monday, the 11th.
  • The Statue of Liberty arrived in the United States all the way from France in October 1886.
  • October has seen more presidents of the United States born than any other month of the year.

Stocks suffered their worst month of the year in September. The S&P 500 dropped 4.8% for the month but is still up 14.7% for the year. The drop broke a nice streak of seven straight positive months. Q4 historically starts off a little shaky but turns out to be one of the best times to be in the market, speaking on a seasonal basis.

Supply chains are still a mess worldwide. The Pacific Ocean off the coast of Los Angeles is a container ship parking lot right now. If you bought something coming from overseas recently, don’t expect it to get to your house until 2022. It looks like the most popular gift this year for the holidays will be gift cards.

Covid is still creating a headache for the markets as waves of the disease ebb and flow around the globe. Fortunately, we are seeing a nice downtick in hospitalizations and deaths here in the states. Hopefully, we will soon have enough people vaccinated that we won’t see another mutation creep back in.

The end of September marks the beginning of Q4, which means earnings season is starting shortly. What happened in Q3 isn’t that big of a deal for investors. It’s what companies say about Q4 projections that really moves the markets.

The market does have a few headwinds, but these can turn into tailwinds quickly once we get supply chains repaired and more of the population vaccinated.

Take a look at the Outlook section below to see what events could move the markets over the short term.

Bond prices across the debt spectrum fell smartly throughout September as inflation worries grew. Now that it looks like the Fed is going to start tapering their asset purchases, meaning buying less government bonds, demand for these assets will shrink. This, in turn, will cause bond prices to drop and their yields to rise. So, please be cognizant of this when buying bonds with a maturity date greater than 1-2 years. In this type of interest rate environment, you can expect to lose principal unless you hold the bonds to maturity.

The 10-year US Treasury note is now yielding 1.5% and the 30-year bond is at 2.06%, both higher than last month. These rates should continue to rise as the fed pumps the brakes on buying so many of these bonds every month.

Interest rates were flat to just slightly higher in September. CD, money market, and savings account rates are still historically low. These rates should move higher over the rest of the year, but the savings rates will most likely still be too low to keep up with inflation.

Currently, the average savings account is paying 0.29%, a slight bump higher from last month. Although safe from market fluctuations, putting all your eggs in a savings account is not the best bet, especially if you need to grow your account value. Plus, you have to pay taxes on that interest.

The 1-year CD interest rate is now averaging 0.46%, the same as last month. The 5-year CD rate inched up slightly to 0.73%. You’re certainly not getting rich owning these. Hopefully, these rates will continue to head higher over the next few months.

Mortgage rates changed very little during the month of September. Currently, the 30-year rate sits at 3.03%, about the same as one month ago. Rates continue to remain incredibly low, which is great news for home buyers, real estate investors and refinancers. Home prices continued to break records for the fourth month in a row as supply chain issues delay deliveries of building materials (and pretty much everything else). We should start to see rates rise but so far, there has not been much movement at all.

Oil prices headed back up in September after it first down month (August) since early spring. The price for a barrel of oil went up by 10% to settle at $75.05 at the end of September. Prices for the year are up an impressive 55%.

Since almost all materials, products, etc. need oil to move, prices for almost everything have risen steadily over the year. This, coupled with wage increases and high demand, has really stoked the inflation embers.

Gasoline prices crept up in September in response to the increase in the price of oil. August. Prices at the pump are averaging about $3.19 per gallon, about 3 cents higher than a month ago. Mississippi has the cheapest gas right now, at $2.82. California has the most expensive at $4.40 per gallon. FYI, a year ago, we were paying $2.18.

Gas prices in England are really out of control and the main reason is because they don’t have enough drivers to get the petrol to the filling stations. Hopefully, that won’t happen over here.

Check out the prices at the pump in your area: Gas Buddy.

Outlook

Events on the horizon that could move the markets in the near term:

  • Infrastructure Bill: The House of Representatives delayed voting on this bill because the Democrats are feuding internally. Hopefully, they can iron out whatever their problems are and get something done by the end of the year. I think the market knows this bill will get passed so we should see a nice leg up for industrial, materials, and heavy machinery stocks when it actually does.
  • Coronavirus: The data is now confirming that we did reach the peak transmission of the covid delta variant in late August, which is great news. Unfortunately, we are still averaging almost 1,400 deaths per day. Hopefully, this rate will come down as well. The vaccination rate slowed down in September, which now shows that 65% of the U.S. population has received at least one dose, up from 62% last month. New vaccine mandates around the country should help improve this number. I think if we add this amount of the population to the number of unvaccinated people that caught covid and survived, we could be closer to 80% of the population that has some form of immunity. This might be enough to slow down the virus mutations, which would help us turn the corner on the pandemic. No doubt a positive for the economy and the markets.
  • Fed & Inflation: It looks like the Fed is going to start slowing down (tapering) its monthly bond purchases by the end of this year. I’m guessing that will go on until mid-2022. After that, we could see them start to raise interest rates, especially if our economy continues to recover from the pandemic. This is something that investors should monitor closely, in my opinion, since the current low-interest rate environment has been providing a solid floor for stock prices over the last several years.

Joe Baker, CFP®

Baker Asset Management, LLC

joebaker@bakerassetmanagement.com

Must-See Charts If You’re Worried About Market Volatility

It would be nice if your investing journey was always a steady uphill march. In reality, it’s more of a sometimes run/sometimes crawl with plenty of downhill moments along the way. In spite of the obstacles, over time, the path typically trends upward. The bumps of stock market volatility are an inescapable part of the investment experience, but with some context, they don’t have to be so scary.

Here are some interesting stats that should help you sleep better at night if you are investing for the long term. For me, that typically means that you don’t plan on using your invested money for at least 5 years.

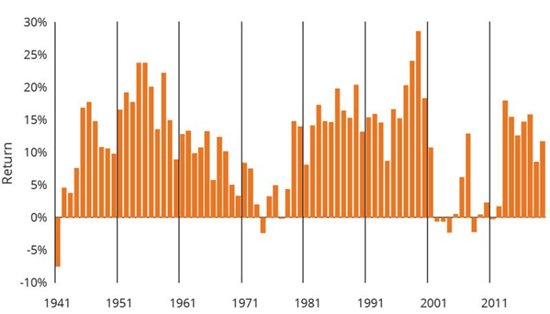
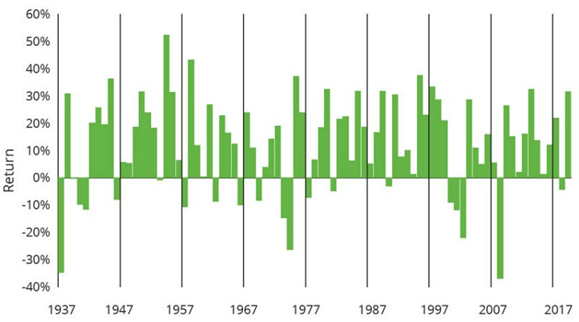
Historically, the glass has been more than half full when it comes to stock market returns. If you’re worried about the next market crash, remember that markets have been positive more often than not. In fact, stocks have turned in a positive return 64 out of the last 84 calendar years, which means they’ve been on the rise 76% of the time.

Long-Term Investors Have Historically Seen Less Volatility

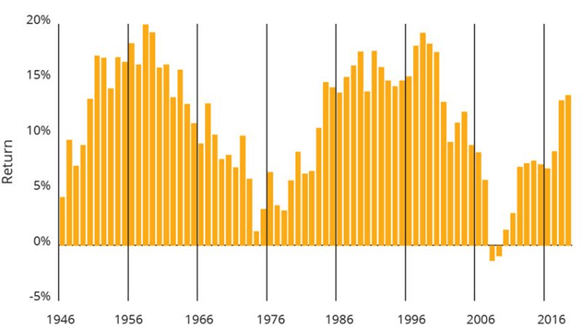
Each of the charts below shows the investment results for the S&P 500 Index for different lengths of time. The longer an investor holds stocks, the greater the potential for an overall positive return.

One-Year Holding Periods (Jan. 1, 1937–Dec. 31, 2020)

Stocks were up 76% of the time—64 up periods, 20 down

Five-Year Holding Periods (Jan. 1, 1937-Dec. 31, 2020)

Stocks were up 90% of the time—72 up periods, 8 down

Ten-Year Holding Periods (Jan. 1, 1937-Dec. 31, 2020)

Stocks were up 97% of the time—73 up periods, 2 down

The big thing to take away from this is that patience pays off when it comes to investing. If you know your time horizon (how long you can invest before needing that money), you can invest accordingly without having to worry about the day-to-day gyrations of the markets.

Please let me know if you have any questions.

Joe Baker, CFP®

Baker Asset Management, LLC

joebaker@bakerassetmanagement.com
Can We Survive Without Fossil Fuels?

There was an interesting research piece in The Guardian by Damina Carrington recently on how much of the world’s fossil fuel reserves need to stay in the ground to have a meaningful impact on rising global temperatures. I thought this would be of particular interest to those investors looking at, or already invested, in the energy sector.

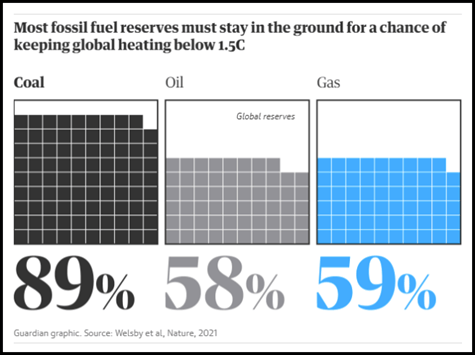
Basically, the analysis found that the vast majority of fossil fuel reserves owned today by countries and companies must remain in the ground if the climate crisis is to be ended.

Here are some fascinating numbers from this article:

  • The research found 90% of coal and 60% of oil and gas reserves could not be extracted if there was to be even a 50% chance of keeping global heating below 1.5°C (34.7°F), the temperature beyond which the worst climate impacts hit.

To keep below this temperature increase, here’s some of the things that need to happen:

  • The US, Russia and the former Soviet states have half of global coal reserves but will need to keep 97% in the ground, while the figure for Australia is 95%. China and India have about a quarter of global coal reserves and will need to keep 76% in the ground.
  • Middle Eastern states have more than half the world oil reserves but will need to keep almost two-thirds in the ground, while 83% of Canada’s oil from tar sands must not be extracted.
  • Virtually all unconventional oil or gas, such as from fracking, must remain in the ground and no fossil fuels at all can be extracted from the Arctic.

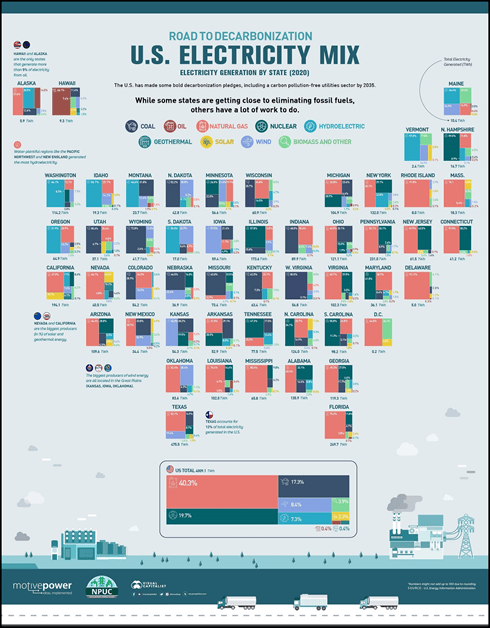
These objectives are going to be daunting tasks to say the least, based on our current fossil fuel usage. For example, this chart shows how we produce our electrical energy in America:

This shows that 60% of our electrical usage is powered by fossil fuels (natural gas and coal).

The other major headwind to completely shutting down fossil fuel extraction would be the fact that the value of these assets would become virtually worthless, which would bankrupt companies and countries alike. This is especially worrisome for major oil-producing countries in the Middle East.

I don’t know if there are any easy solutions other than more rapid adaptation of nuclear and renewable energy sources. I just can’t see this happening any time soon because right now there is such a huge disconnect between the climate change community and the rest of the world.

Please let me know if you have any questions.

Joe Baker, CFP®

Baker Asset Management, LLC

joebaker@bakerassetmanagement.com

How Presidential Approval Ratings Affect Stock Prices

In this politically charged era, it would not be prudent for investors to ignore who lives in the White House when developing portfolio strategies. I have found this to be true probably starting back in 2000 but has become most profound over the last 5 years. Investors from both parties get very nervous when their party doesn’t win the presidency. But just because your pick didn’t win, doesn’t mean your investments are going to suffer.

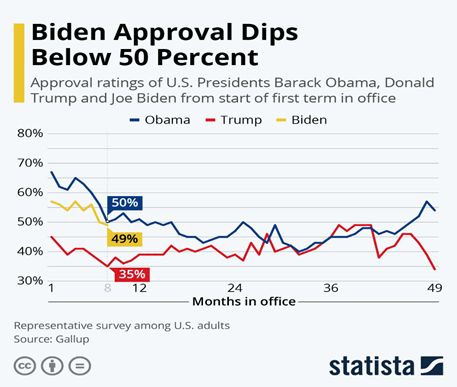
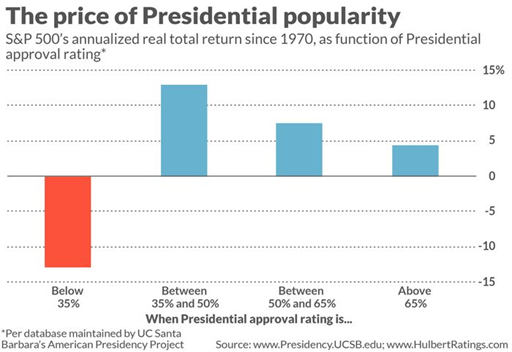
In fact, there is some interesting data that shows how stocks perform in relation to presidential approval ratings. The numbers show that there is an inverse relationship between stock prices and approval ratings. Historically, the stock market has performed the best when presidential approval ratings are below 50%.

Mark Hulbert wrote a great article for MarketWatch that does a great job explaining this relationship. Here is a chart from that article that shows the relationship between ratings and stock prices:

As you can see, the market has performed best when the sitting President approval rating is between 35% and 50%. Also, the relationship is not perfectly inverse. When ratings get really bad, below 35%, the markets tank. Currently, Biden’s approval rating has dipped below 50%. This bodes well for the stock market, historically speaking.

The most popular explanation for this contrarian indicator is that the stock market likes gridlock in D.C. So, when a president is unpopular, the government probably won’t be able to get much done with regards to major policy changes. No change means no uncertainty for the stock market which is always a good thing for stock prices.

Having said all of that, I’m still a firm believer that if you have more than five years until you need money from your investments, it is irrelevant who the President is today.

Please let me know if you have any questions.

Joe Baker, CFP®

Baker Asset Management, LLC

joebaker@bakerassetmanagement.com

Monthly Update – September 2021

Fun Facts about September

  • Birthstone: Sapphire
  • Flower: Aster
  • Zodiac signs: Virgo and Libra
  • September’s name comes from the Latin word septem, meaning “seven.” This month had originally been the seventh month of the early Roman calendar.
  • September is the first of the autumn months in the Northern Hemisphere. Its Southern Hemisphere equivalent is March.
  • September 6—the first Monday in September—is Labor Day.
  • September 22 marks the start of fall. This year’s Autumnal Equinox occurs at 3:20 P.M. EDT on Wednesday, September 22. At this time, there are approximately equal hours of daylight and darkness.

Stocks continued their march higher in August, defying history as one of the worst months for stock market performance. The S&P 500 moved up 2.9% for the month and is now up over 20% for the year. This rise will be the seventh straight positive month for the index. It is even more impressive considering the negative impacts that the recent surge in Covid has inflicted on our economic recovery.

Supply chains appeared to be repairing themselves last month but as the delta variant of covid continues to spread, we seem to have stalled. For example, there are currently 44 container ships off the coast of California waiting to be off-loaded. Usually, there is no more than one! Shippers are now seeing delays of over 1 month to get their cargo where it needs to be. These delays will have a negative impact on Q3 and Q4 numbers this year for many companies so keep that in mind when looking at potential investments.

Another factor that could send ripples through the markets is inflation. The Federal Reserve doesn’t seem to be too worried and sees many price increases, such as fuel and food, to be only temporary. Of course, temporary is a relative term so we’ll just have to wait and see.

Take a look at the Outlook section below to see what events could move the markets over the short term.

Bond prices ended flat for the month across the board: government, corporate, and junk. The monthly chart for most bond indices looked like a profile of a roller coaster as inflation fears ebbed and flowed, but eventually ended up where they were at the beginning of the month. I think with the Fed now letting us know that they will start tapering their asset purchases, my expectation of lower bond prices at the end of the year should still pan out.

The 10-year US Treasury note is now yielding 1.30% and the 30-year bond is at 1.92%, both slightly higher than last month. These rates should start to rise as the fed pumps the brakes on buying so many of these bonds every month, aka tapering. Any noticeable uptick in inflation will get these rates moving higher as well.

Interest rates moved a bit higher on the long end of the curve but were mostly flat once again in August, very similar to last month’s moves. CD, money market, and savings account rates are still historically low. These rates should move higher over the rest of the year, but the savings rates will most likely still be too low to keep up with inflation.

Currently, the average savings account is paying 0.27%, exactly the same as the last 3 months. Although safe from market fluctuations, putting all your eggs in a savings account is not the best bet, especially if you need to grow your account value. Plus, you have to pay taxes on that interest.

The 1-year CD interest rate is now averaging 0.46%, down a bit from last month. The 5-year CD rate fell slightly as well, now yielding 0.70%. Hopefully, these rates will start to head higher over the next few months.

Mortgage rates changed very little during the month of August. Currently, the 30-year rate sits at 3.02%, the same as one month ago. Rates continue to remain incredibly low, which is great news for home buyers, real estate investors and refinancers. Home prices rose at a record pace for the third consecutive month. In fact, home prices rose in all 50 states in August. These price increases are due to lack of inventory, low mortgage rates, and population shift from urban apartments to suburban homes due to covid. These price increases should put some upward pressure on mortgage rates but so far, rates haven’t move that much.

Oil prices dropped as much as 17% at one point in August but rallied toward the end of the month to only be down about 7%. This snapped oil’s 4-month rally. Even with this month’s drop, prices are up nearly 42% in 2021, mostly due to recovering from the pandemic. The price for a barrel of oil settled near $68.50.

There are a few reasons why oil prices have come down in August. First, OPEC plans on increasing their output by 400,000 barrels a day. Second, the resurgence in covid due to the delta variant has curbed travel, shipping, etc., resulting in less fuel consumption.

Not surprisingly, gasoline prices dropped slightly in August. Prices at the pump are averaging about $3.16 per gallon, about 2 cents lower than a month ago. Texas has the cheapest gas right now, at $2.78. California has the most expensive at $4.40 per gallon. FYI, a year ago, we were paying $2.23.

Check out the prices at the pump in your area: Gas Buddy.

Outlook

Events on the horizon that could move the markets in the near term:

  • Infrastructure Bill: The Senate approved their version of the bill and now has to go to the HOR for passage before landing on Biden’s desk for his signing into law. Expectations are for it to be a done deal by the end of September. If so, we should see a nice leg up for industrial, materials, and heavy machinery stocks that haven’t already priced it into their stock price.
  • Coronavirus: With the delta variant spreading through the U.S. population so quickly this summer, it may have convinced some people who didn’t want to get the vaccination to go ahead and get it. People with at least one dose jumped to 62% from 54%, more than double the rate of vaccinations from last month. That’s great news but still nowhere near the numbers that we need to put this pandemic behind us for good. New cases for this wave look like they may have peaked in late August which means we should see covid deaths peak in mid to late September. We’re currently averaging over 1,300 deaths per day, which is just horrible. With the Pfizer vaccine now fully approved by the FDA, many institutions and companies are mandating vaccines, which should get our vaccination numbers up to where we can ease the pressure on our health care infrastructure and personnel. This will, in turn, help supply chains and the economy in general, which is all good for the stock and bond markets.
  • Fed & Inflation: The Fed just held its annual Jackson Hole, WY meeting (virtually, for the second year in a row). They started laying the groundwork for tapering its asset purchases but have no plans to start raising interest rates. This has eased investors’ fears as evidenced by the continued rise of stock market indices. This should bode well for stocks for the remainder of the year but not so much for government and high-quality corporate bonds.

Joe Baker, CFP®

Baker Asset Management, LLC

joebaker@bakerassetmanagement.com
When You Can Withdraw From Your Roth IRA

We recently talked about distribution rules for IRAs. Today, I wanted to go over the distribution rules for Roth IRAs, which are a little bit different. Before we do that, let’s look at the main differences between an IRA and a Roth IRA:

ROTH IRATRADITIONAL IRA
+ Contributions are made with after-tax dollars, meaning no tax benefit for contributing.
+ Contributions can be withdrawn at any time without taxes or penalties.
+ Qualified withdrawals in retirement are tax-free.
+ No required minimum distributions (RMDs).
+ Contributions are tax deductible in the year they are made.
+ Distributions in retirement are taxed as ordinary income.
+ At age 72, there are required minimum distributions (RMDs).

From the above, you can see that the biggest difference between a Roth IRA and a traditional IRA is how and when you get a tax break. Contributions to traditional IRAs are tax-deductible, but withdrawals in retirement are taxable. Conversely, contributions to Roth IRAs are not tax-deductible, but the withdrawals in retirement are tax-free.

Keep in mind that there are two types of money in your Roth IRA: contributions and earnings. Contributions are the funds that you put into (contribute) to the Roth IRA. This is money that has already been taxed. Earnings are any gains that you made on the investments within your Roth IRA. Earnings grow tax-deferred and can be withdrawn tax-free if you follow the distribution rules.

It’s important to note that withdrawals always come out of a Roth IRA using the First In, First Out (FIFO) method. This means that contributions will always come out first, before earnings.

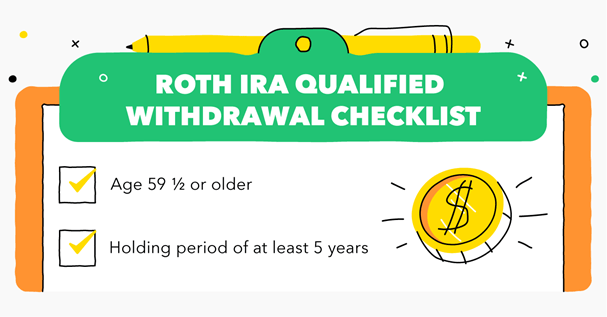
Now, let’s look at when you can withdraw from your Roth IRA tax-free and penalty-free, also known as a qualified distribution:

  • you’re older than age 59 1/2.
  • This means that you can be younger than 59 ½ and pay no taxes or penalties.
  • It’s been at least 5 years since you first contributed to your Roth account and your withdrawal will be used to purchase your first home. There is a $10,000 maximum on this withdrawal.

If you inherit a Roth IRA, the rules depend on if you are the spouse of the account owner or not. If you are a spouse beneficiary, you can simply roll it into your own Roth IRA, which almost always makes the most sense.

For non-spouse beneficiaries, you have to withdraw all of the money in the inherited Roth IRA account within 10 years of the account owner’s death. No taxes or penalties will be due, but the account has to be emptied within 10 years.

The key takeaways from this post are:

  • Contributions to your Roth IRA can always be withdrawn at any time without taxes or penalties.
  • You can withdraw earnings tax-free and penalty-free if you are over age 59 ½ and the Roth IRA account is at least 5 years old.

Please let me know if you have any questions.

Joe Baker, CFP®

Baker Asset Management, LLC

joebaker@bakerassetmanagement.com